A dal mill plant processes pulses into consumable dal – a product with consistent demand across Indian households and a growing demand in emerging markets. Yet, machinery capacity and projected sales alone cannot confirm whether a dal mill business will generate adequate returns. This article examines how to assess dal mill ROI, IRR, payback period, break-even and sensitivity for promoters, investors and businesses seeking bank finance in India.
Key Takeaways
Dal mill ROI depends primarily on raw material prices, dal recovery percentage, finished dal selling prices, capacity utilisation and funding structure. A 3 TPH or 5 TPH machine does not, by itself, establish profitability. The financial outcome is shaped by the spread between procurement cost and sales realisation, the percentage of saleable dal recovered from raw pulses, operating efficiency and the cost of working capital required to fund seasonal procurement.
- Promoters must distinguish between project returns (project IRR, project ROI on total investment) and promoter returns (equity IRR on their own capital). Mixing these two leads to misleading conclusions about dal mill investment returns.
- Payback period, break even analysis and DSCR are different financial tools. Payback measures how quickly the initial investment is recovered. Break-even focuses on the volume or utilisation at which a dal mill covers its costs. DSCR checks whether the project generates enough cash to repay bank loans on schedule.
- Sensitivity analysis on raw pulse purchase price, recovery ratio, selling prices and capacity utilisation is essential before finalising investment decisions and applying for a bank loan for any dal mill project.
- A dal mill plant can be a profitable venture for entrepreneurs, but returns depend on location, scale, management quality and realistic assumptions – not on generic industry averages.
Project Report Bank, led by CA Manish Gugliya, prepares customised dal mill DPRs, financial projections, CMA Data and ROI/IRR analysis for bank finance and investor discussions.
By CA Manish Gugliya – Professional Context and Article Purpose
I am CA Manish Gugliya, a practising Chartered Accountant with more than 20 years of professional experience in project finance, Detailed Project Reports, financial modelling and CMA Data preparation for manufacturing and food processing projects across India, including dal mill business proposals.
This article focuses on dal mill ROI, IRR, payback period, break-even and sensitivity analysis for entrepreneurs seeking term loan and working capital from Indian banks and financial institutions. All figures used in the illustrative examples below are hypothetical – they are not market benchmarks, assured returns or current market prices. GST and recoverable taxes are excluded unless explicitly mentioned. The analysis approach aligns with bankable Detailed Project Reports prepared by Project Report Bank for dal mill project proposals.
Why Dal Mill Investment Returns Need Careful Assessment
A dal mill is a food processing unit operating with relatively thin margins where small changes in raw material cost or recovery percentage can sharply alter ROI. Pulses are a core part of the daily diet in India, and the increasing demand for processed pulses creates genuine business ideas for entrepreneurs – but rising demand alone does not guarantee profitable business outcomes.
Machinery capacity and projected sales cannot prove project viability because:
- Raw pulse purchase prices fluctuate with harvest, MSP policy and market supply, and raw material costs constitute about 80% to 90% of operational expenses in dal milling.
- Dal recovery percentage determines how much saleable product is available from each quintal of raw input; even a 1–2 percentage point change can alter annual profit materially.
- Capacity utilisation in the first two years is often well below nameplate capacity, inflating per-unit fixed costs.
- Working capital requirements – driven by seasonal procurement, inventory holding and customer credit – affect cash availability and interest costs.
The key drivers of dal mill profitability include raw material procurement price, dal recovery, by-product income, capacity utilisation, operational costs, working capital interest and loan structure. These must be modelled carefully before committing capital.
Core Drivers of Dal Mill Profitability
Dal mill profitability analysis must begin with technical and commercial assumptions – not just a high-level business plan. A comprehensive understanding of the entire process from pulse processing to finished product sales determines whether the projected numbers are defensible.
Pulse Type and Raw Material Quality
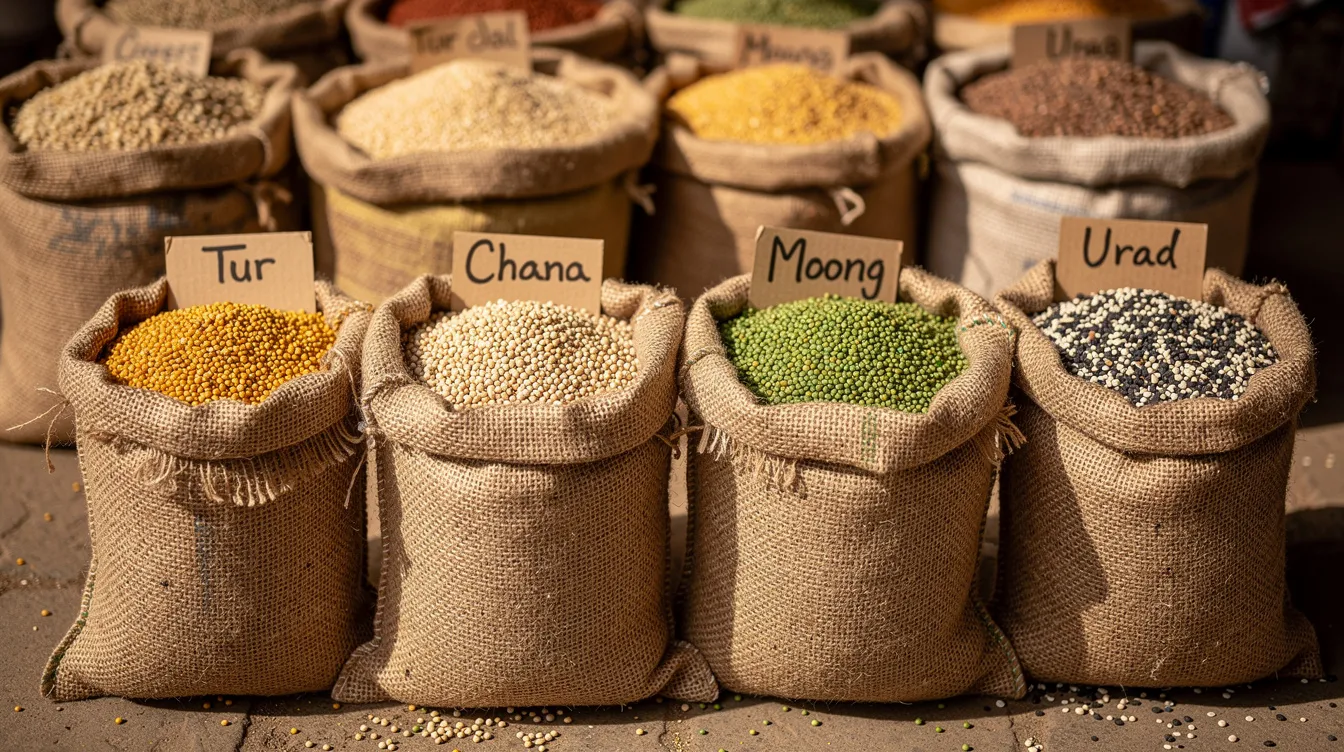
The type of pulse processed – Tur, chana dal, Masoor, Moong or Urad – directly affects recovery, processing cost and selling price spread. Quality raw materials directly impact the output’s quality and reputation. High-moisture, thick-husk or impurity-laden pulses reduce effective recovery and increase cleaning and sorting losses. High-quality pulses directly impact the output’s quality, and quality control measures are essential at every production stage. Dal milling processes include cleaning, dehusking, and grading before the final product reaches the market.
Raw Pulse Purchase Prices and Dal Selling Prices
A dal mill’s profitability depends fundamentally on raw pulse prices and recovery rates. In a study of Tur dal processing units in Bharuch, Gujarat, raw Tur was purchased at approximately ₹4,750 per quintal while finished Tur dal sold at approximately ₹7,382 per quintal. Even a ₹50–₹100 per quintal variation in raw pulse price can change annual profit significantly for a plant processing 10,000 MT per year.
Saleable Dal Recovery, Broken Dal and Process Losses
Dal recovery rates from modern mills typically range from 75% to 85%, depending on pulse type, conditioning and machinery quality. Traditional mills often achieve only 65–75%. The dal mill recovery ratio and milling losses must be clearly established in any financial projection. Broken dal, husk, powder and cleaning losses together may range from 12% to 20% of input. Broken dal and by-products must not be double-counted within both recovery percentage and separate revenue line items.
Husk, Chuni and By-Product Income
Dal mill by-products and additional revenue from husk, chuni and broken dal can add 3% to 5% to overall revenue margins. These realisations, while individually small, contribute meaningfully over large volumes.
Capacity Utilisation and Operating Days
Operating 250–300 days per year across one or two shifts is typical. Mills operating below 60% capacity may struggle to recover fixed costs. Capacity utilisation usually ramps up from 60–70% in Year 1 towards 80–85% by Year 3 as the business develops customers and stabilises production.
Variable Operating Costs
Major variable costs include power and fuel, skilled labor, packing materials, repairs and selling expenses. Processing cost per quintal in the Bharuch study was approximately ₹291.56, of which variable costs accounted for approximately ₹245 per quintal and fixed costs approximately ₹46 per quintal. Transportation costs for both raw material inbound and finished product outbound also affect net realisation.
Inventory Holding and Working Capital Interest
Inventory holding of raw pulses (often purchased in bulk during harvest season) and finished dal, combined with debtor days for wholesale customers, drives working capital requirements. The interest cost on this working capital directly reduces dal mill ROI.
Dal Mill Business Model Choices and Their Effect on Returns
ROI and IRR are materially influenced by the chosen business model: job work, bulk sale, or branded retail packaging.
Bulk processing model: The dal mill sources raw material, processes it through milling processes, and sells finished dal in 25–50 kg bags to wholesalers. This model involves lower profit margin per quintal but faster inventory rotation and lower selling expenses.
Branded retail packaging: Selling in 1 kg and 5 kg consumer packs can increase selling prices significantly but adds costs for advertising, branded dal packaging, warehousing, distribution and trade credit. The promoter may also choose to sell directly to retailers or institutional buyers.
Job-work model: Farmers or traders supply raw pulses and the mill charges a fixed processing fee per quintal. This model has lower risk and lower working capital but limited upside on ROI. It suits promoters testing market entry or operating in regions with limited capital.
Market Research and Raw Material Planning Before ROI Calculations
Realistic dal mill ROI starts from thorough market research and raw material mapping – not from reverse-calculating a desired profit margin. Market research reports on regional pulse consumption patterns, B2B and B2C demand segments, and competitive landscape help in selecting the right product mix and identifying the target market demand.
Promoters must study raw pulse availability in surrounding mandis, farmer clusters and FPCs to estimate assured annual quantity and transport cost. Raw pulses should be procured during harvest seasons to minimise costs, but seasonality introduces price movement risk: one season’s procurement price affects the average annual purchase price and therefore the entire year’s margins. India’s pulse production and pulse consumption patterns, along with dietary habits favouring a vegetarian diet, create high demand, but the competitive landscape requires careful planning. The health benefits of pulses continue to support consistent demand.
A detailed raw pulse procurement and seasonal inventory planning strategy should inform stocking decisions, storage loss assumptions and cash flow timing in any dal mill financial model.
Dal Mill Project Cost, Means of Finance and ROI Denominator
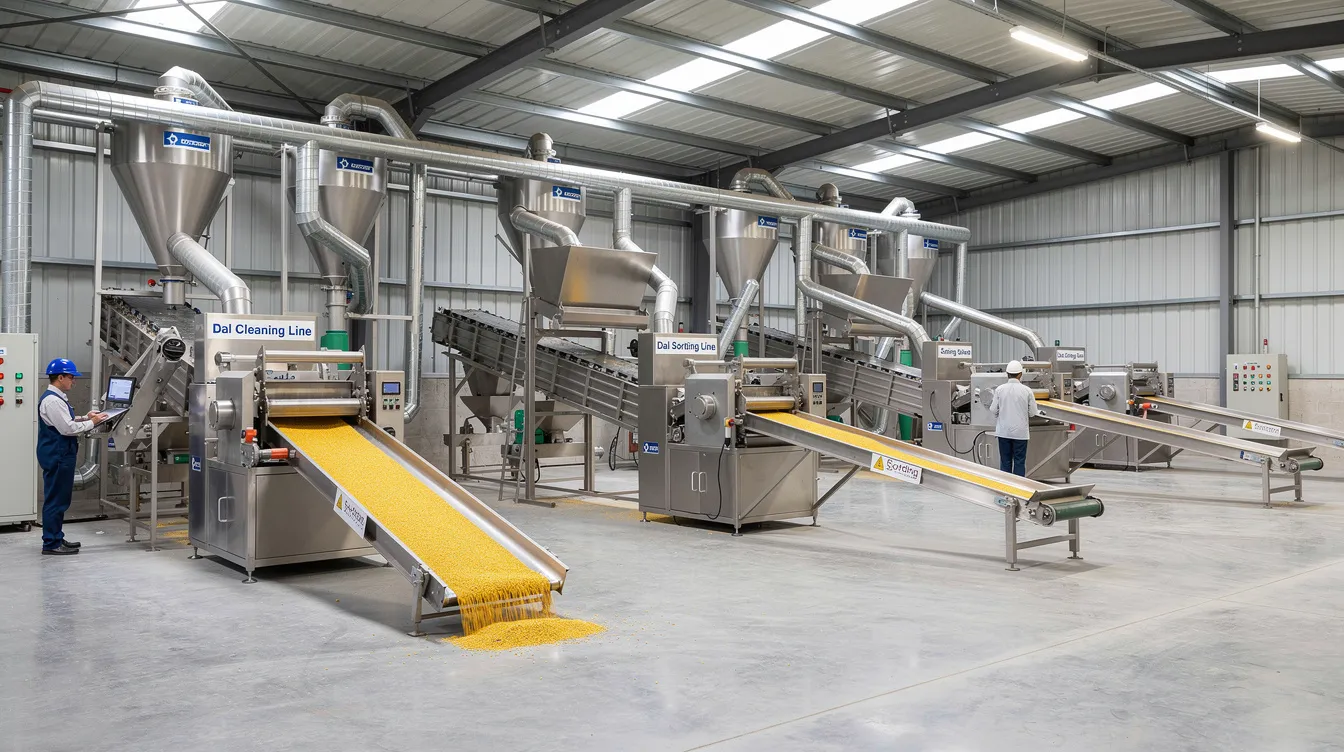
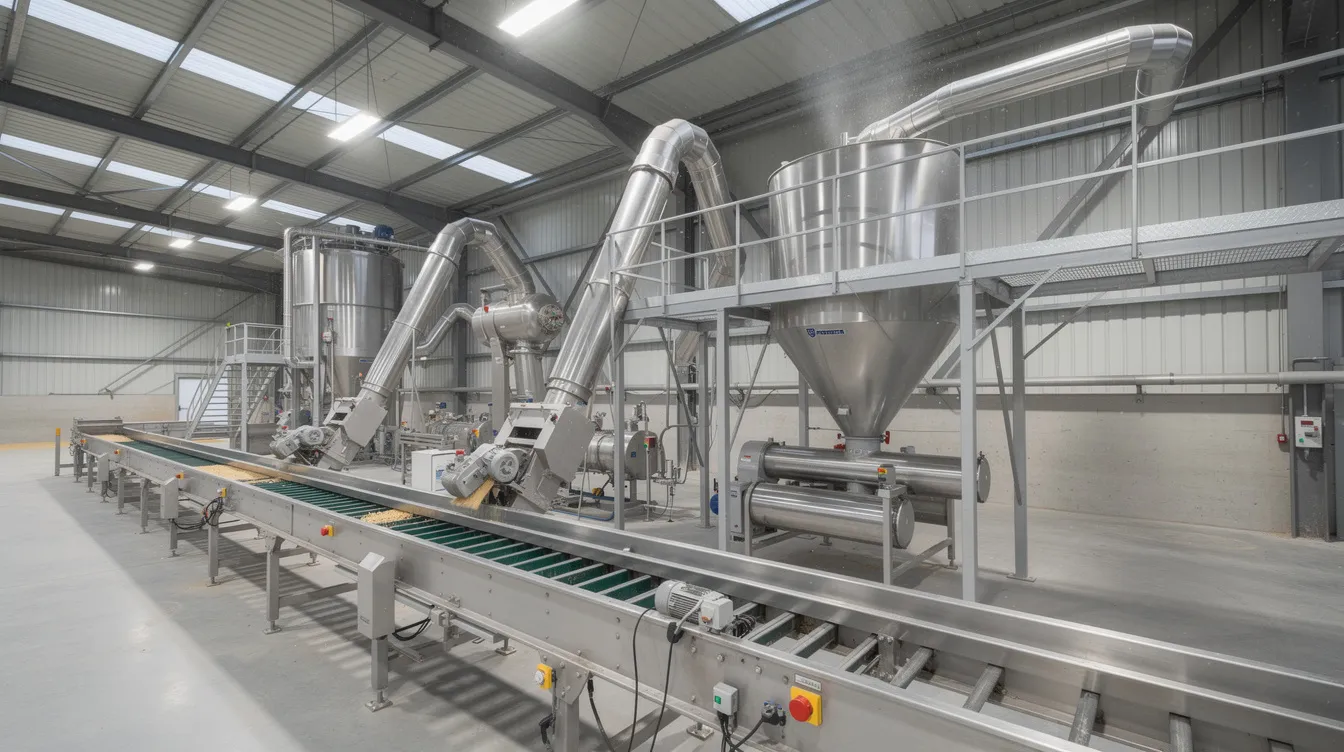
Total project cost for a dal mill includes land and building, plant and machinery (dehuskers, splitters, polishers, graders, conveyors), electricals, civil works, pre-operative expenses, contingency and margin for working capital. The total cost defines the denominator for project ROI calculations.
For reference, illustrative project costs vary widely by scale:
| Capacity (TPD) | Approximate Total Project Cost |
|---|---|
| 3 TPD | ₹0.85–1.50 crore |
| 5 TPD | ₹1.50–2.50 crore |
| 10 TPD | ₹3.50–6.00 crore |
| 20 TPD | ₹7.00–11.00 crore |
Source: Indicative ranges from industry DPRs; actual costs depend on location, machinery specification and automation level.
Project ROI is commonly calculated on total project cost – not just on plant and machinery or only on the equity portion. If land is owned rather than purchased, its opportunity cost should ideally be reflected in the analysis for a fair comparison.
Means of finance typically comprise promoter’s equity, term loan and sometimes unsecured loans. Government support through schemes like PMFME can provide credit-linked capital subsidies for food processing units. Subsidies under government initiatives can reduce initial capital costs by 15% to 35%, and government funding for agricultural machinery increased by 15% last year, providing additional financial support for small and medium enterprises entering agro processing.
Changing the debt–equity ratio affects equity returns (equity IRR) but does not change the unlevered project IRR. A detailed breakdown of dal mill project cost and means of finance is essential for any bankable proposal.
Illustrative anchor for later calculations: Consider a hypothetical 3 TPH dal mill with total project cost of ₹4.00 crore, financed with 30% promoter equity (₹1.20 crore) and 70% term loan (₹2.80 crore).
How to Calculate Dal Mill ROI (Return on Investment)
In the context of a dal mill project, ROI is most commonly expressed as:
Project ROI = Annual Profit After Tax (PAT) ÷ Total Project Cost × 100
This gives a single-year accounting return on the total investment. It is important to distinguish this from:
- Return on capital employed (ROCE): PAT plus interest on long-term debt, divided by total capital employed.
- Return on equity (ROE): PAT attributable to equity divided by net worth (promoter’s investment).
ROI based on one stabilised year is an accounting measure. It does not capture the timing of cash flows across the project’s life – that is what IRR does. Net profit margins for commercial dal mills typically range from 8% to 15% of sales. Small-to-medium scale dal mills generally achieve an ROI between 25% and 40% on total project cost, though actual results vary considerably with scale, location and management.
A stabilised-year ROI is useful for quick comparison but should not be confused with the multi-year project IRR. Interest on term loan is a financing cost, not operating income – it should be deducted from profit but should not appear twice in the analysis. Notional items like revaluation gains have no place in a project ROI calculation. Realistic depreciation and applicable income tax must be reflected.
Project IRR, Equity IRR and NPV for a Dal Mill
IRR (Internal Rate of Return) and NPV (Net Present Value) are time-value-of-money tools widely used by banks and investors to judge dal mill project viability. Unlike single-year ROI, these measures evaluate the entire stream of cash flows across the project’s life.
Project IRR
Project IRR is calculated using unlevered free cash flows – cash generated by the project before interest and principal repayment. The initial outflow includes total capital expenditure and working capital investment. Annual inflows are operating cash flows (EBITDA minus tax, adjusted for working capital changes) over the projection period. Financing cash flows – interest, loan principal and equity infusion – are not deducted when computing project IRR.
Equity IRR
Equity IRR measures the return on the promoter’s own capital. The outflow is the equity infused by the promoter. Inflows are the cash available to the promoter after all loan servicing, interest payments and taxes. Higher leverage may increase equity IRR when project returns exceed the cost of debt, but this also increases financial risk and volatility. A promoter should not over-gear a project simply to show a higher equity IRR.
NPV
NPV discounts future project cash flows at a rate reflecting risk and opportunity cost – typically 13–15% for a dal mill in the MSME category. A positive NPV indicates the project generates value above the required return. The discount rate must be stated explicitly and applied consistently.
Accurate dal mill financial projections, CMA Data and DSCR calculations are the foundation for reliable IRR and NPV computation.
Understanding Dal Mill Payback Period
Simple payback period measures how many years it takes for cumulative net cash accruals (profit after tax plus depreciation) to recover the total project cost.
Simple Payback = Total Project Cost ÷ Annual Net Cash Accruals
When annual cash flows vary – as they typically do during capacity ramp-up – cumulative cash flow should be computed year by year to identify the exact point at which the initial investment is recovered. The payback period for dal mill setups is usually between 2 and 5 years, depending on scale, margins and capacity utilisation trajectory.
Discounted payback uses present values of future cash flows at a chosen discount rate, providing a more financially rigorous recovery estimate.
Limitation: Payback ignores all cash flows earned after the recovery year. A project with a 3-year payback and 15 years of profitable operations is very different from one with a 3-year payback and declining margins thereafter. Payback is a risk screening tool, not a complete profitability measure.
Dal Mill Break-Even Analysis and Margin of Safety
Break-even throughput is a critical metric for a low-margin food processing business like dal milling.
Contribution per quintal = Selling price of output mix minus variable costs (raw material, packing, power, direct labour, etc.)
Break-even quantity = Total fixed costs ÷ Contribution per quintal
Fixed costs include salaries, rent or lease, administrative overheads, insurance, depreciation and interest on term loan (for cash break-even computation).
The break-even point is typically achieved at 35% to 60% capacity utilisation for most dal mill configurations. The margin of safety – the gap between actual (or projected) utilisation and break-even utilisation – indicates how much buffer the project has against downturns. Banks prefer a comfortable margin of safety, as it protects the project’s ability to service debt even when volumes temporarily decline.
Distinguish between operating break-even (covering all operating costs) and cash break-even after debt servicing (covering loan instalments as well). The latter is always higher and more relevant for a leveraged project.
Working Capital, DSCR and Cash Flow Adequacy
Dal mill ROI analysis is incomplete without assessing working capital requirements and debt servicing capacity.
Working Capital Components
- Raw pulse inventory: Often 30–90 days of stock, especially when purchased in bulk during harvest.
- Finished dal stock: Typically 15–30 days.
- Trade receivables: 15–45 days for wholesale customers.
- Less: Trade payables and sanctioned bank limits (CC/OD).
Seasonal stocking of raw materials creates peak working capital demand shortly after harvest. This mismatch between cash outflows (procurement) and inflows (sales realisation) requires careful planning.
DSCR
The Debt Service Coverage Ratio measures whether cash accrual – not accounting profit – is sufficient to meet annual loan principal and interest obligations.
DSCR = Net Cash Accrual (PAT + Depreciation + Interest on TL) ÷ (Interest on TL + Principal Repayment)
Banks and financial institutions typically expect a minimum average DSCR of 1.25–1.50 over the loan period. Detailed DSCR modelling aligned with dal mill financial projections and CMA Data is essential for any bank loan application.
Hypothetical Dal Mill Financial Example (Base Case)
The following is a clearly labelled hypothetical illustration with assumed figures. These are not market benchmarks, assured outcomes or industry averages. GST is excluded.
Key Assumptions
| Parameter | Assumption |
|---|---|
| Plant capacity | 3 TPH (tonnes per hour) |
| Operating hours per day | 8 |
| Operating days per year | 300 |
| Capacity utilisation | Year 1: 70%, Year 2: 80%, Year 3 onwards: 85% |
| Raw pulse type | Tur (Pigeon Pea) |
| Annual raw input (stabilised year) | 6,120 MT (3 × 8 × 300 × 85%) |
Material Balance (per 100 kg raw input)
| Component | % | Remarks |
|---|---|---|
| Finished Tur dal | 62% | Whole + split saleable dal |
| Broken dal | 5% | Lower-grade saleable product |
| Refractions | 4% | Stone, immature grains |
| Husk and chuni | 13% | By-product, sold for cattle feed |
| Process and cleaning losses | 16% | Moisture, dust, fines |
| Total | 100% |
Revenue (Stabilised Year)
| Product | Quantity (MT) | Price (₹/quintal) | Revenue (₹ lakh) |
|---|---|---|---|
| Finished Tur dal | 3,794 | 7,400 | 2,807 |
| Broken dal | 306 | 5,700 | 174 |
| Husk & chuni | 796 | 1,500 | 119 |
| Total revenue | 3,100 |
Cost Structure (Stabilised Year)
| Cost Head | ₹ lakh |
|---|---|
| Raw material (6,120 MT × ₹4,800/quintal) | 2,938 |
| Power and fuel | 38 |
| Labour (permanent + casual) | 30 |
| Packing and packaging materials | 22 |
| Repairs and maintenance | 12 |
| Administrative and selling expenses | 18 |
| Total operating costs | 3,058 |
Project Cost and Funding
| Component | ₹ lakh |
|---|---|
| Land and building | 90 |
| Dal mill machines (dehuskers, splitters, polishers, graders, conveyors) | 160 |
| Electricals and installation | 25 |
| Pre-operative and misc expenses | 15 |
| Contingency | 10 |
| Margin for working capital | 100 |
| Total project cost | 400 |
Funded by: Promoter equity ₹1.20 crore (30%) and term loan ₹2.80 crore (70%) at 10% p.a., repayable over 7 years with 12-month moratorium.
Illustrative Stabilised-Year P&L
| Item | ₹ lakh |
|---|---|
| Total revenue | 3,100 |
| Total operating costs | 3,058 |
| EBITDA | 42 |
| Depreciation (approx.) | 18 |
| Interest on term loan (approx.) | 24 |
| Profit before tax | 0 |
| Tax | 0 |
| Profit after tax | ~0 |
Observation: The stabilised-year numbers demonstrate that this is a margin-sensitive business. At 85% utilisation and assumed prices, EBITDA is only ₹42 lakh on revenue of ₹31 crore – a thin margin. A slight improvement in recovery, a moderate increase in selling price, or a reduction in procurement cost would make this example profitable, while any adverse movement could push it into losses.
If, for instance, the raw material cost reduces by ₹200 per quintal (to ₹4,600) – achievable through disciplined harvest-season procurement – raw material cost falls by approximately ₹122 lakh, and PAT improves to approximately ₹80–90 lakh after tax.
Under that adjusted scenario:
- Approximate ROI: ₹80 lakh ÷ ₹400 lakh = 20%
- Simple payback: ₹400 lakh ÷ (₹80 lakh + ₹18 lakh depreciation) ≈ 4.1 years
This reinforces that dal mill ROI is extremely sensitive to the raw pulse–finished dal price spread and recovery percentage.
Sensitivity Analysis for a Dal Mill Project
Sensitivity analysis helps promoters understand how dal mill ROI, IRR and payback react to changes in key variables. In a business where raw material alone accounts for 80–90% of costs, even small percentage changes create disproportionate effects on the bottom line.
Variables to Test
- Raw pulse purchase price: +5% and +10%
- Finished dal selling price: -5%
- Dal recovery percentage: -1 and -2 percentage points
- Capacity utilisation: -10 percentage points
- Power and labour costs: +10%
- Interest rate on term loan: +1–2%
One-Variable-at-a-Time Impact
One-variable sensitivity reveals which assumption the project is most exposed to. For most dal mill projects, raw material cost and recovery ratio dominate. A 1–2 percentage point drop in dal recovery – from 62% to 60% – reduces finished dal output by approximately 122 MT per year, lowering revenue by roughly ₹90 lakh in the example above. This alone can turn a marginally profitable project into a loss-making one.
Illustrative Scenario Comparison
| Scenario | Raw Material Cost | Selling Price | Recovery | Utilisation | Approx. Annual PAT |
|---|---|---|---|---|---|
| Base Case (adjusted) | ₹4,600/q | ₹7,400/q | 62% | 85% | ~₹80 lakh |
| Upside Case | ₹4,400/q | ₹7,600/q | 64% | 85% | ~₹180 lakh |
| Downside Case | ₹5,000/q | ₹7,200/q | 60% | 75% | Negative |
Figures are illustrative approximations for concept demonstration only.
In a combined downside scenario – where raw pulse prices increase and selling prices decline simultaneously – the compounding impact on cash flow and DSCR can be severe. Promoters should note that raw pulse and finished dal prices often move together, but with timing differences: procurement costs may rise immediately after a poor harvest, while selling prices adjust with a lag.
Understanding raw pulse procurement and seasonal inventory planning helps promoters manage procurement price risk and build realistic assumptions for sensitivity modelling.
Dal Mill IRR, NPV and Long-Term Project Viability
Once multi-year projections are prepared – typically over a 7–10 year horizon for a dal mill plant – project IRR and NPV can be computed from the annual free cash flow schedule. This projection should incorporate capacity utilisation ramp-up, realistic maintenance capex, replacement of critical dal mill machines after 8–10 years if required, and changes in working capital over time.
Project IRR is the discount rate at which the NPV of all project cash flows (initial investment outflows and subsequent operating inflows) equals zero. Equity IRR follows the same logic but uses only the promoter’s cash flows. Terminal value – either a conservative residual value for land, building and machinery or a salvage-based estimate – enters the model in the final year.
High IRR alone does not confirm bankability. Lenders also test DSCR adequacy, security cover and promoter contribution robustness before sanctioning finance. For professional multi-year modelling and IRR/NPV computation, a customised financial projections and financial modelling engagement ensures consistency and defensibility.
Investment Returns Versus Bank Repayment Capacity
A project with an attractive IRR can still face cash shortages if the repayment schedule does not align with the project’s cash flow pattern. This distinction between investment attractiveness (IRR, NPV, ROI) and bank repayment capacity (DSCR, liquidity) is critical.
Consider a dal mill showing positive annual profit but tight cash because of increased raw pulse inventory after harvest season or delayed receivables from wholesale buyers. The P&L shows profit, but the bank account lacks the balance needed for the quarterly term loan instalment. Working capital limits, drawing power and interest servicing on CC/OD facilities play a significant role in maintaining adequate monthly cash balances.
Seasonal procurement patterns in pulse processing mean that cash outflows are concentrated in certain months while cash inflows are spread more evenly. A professional DPR and CMA Data, prepared with bank finance DPR and loan proposal assistance, helps match repayment schedules to actual project cash flows.
Practical Ways to Improve Dal Mill ROI and IRR
Small operational improvements can significantly improve dal mill investment returns over the project life.
- Disciplined raw material procurement: Timely purchases during harvest, quality checks at intake, and negotiated contracts with farmer clusters or FPCs reduce average procurement cost and invisible losses. Quality checks ensure compliance with food safety standards.
- Process optimisation: Proper pulse conditioning, dehusking and splitting settings can improve dal recovery by 2–4 percentage points. Investing in improved machinery can increase yield by 2% to 4%, directly boosting revenue.
- Appropriate automation: Choosing the right level between semi-automatic and fully automatic plant based on production capacity, labour availability and throughput avoids both over-investment and operational inefficiency, improving operational efficiency. Automation can reduce manual labor and minimise manual intervention in repetitive processing steps.
- Inventory and receivable management: Shorter debtor cycles, negotiated credit with suppliers and efficient logistics reduce working capital interest. Implementing quality control at every stage builds customer trust in products and supports maintaining product quality and consistent quality in output.
- Strategic product mix: Value addition through branded packs, graded products and direct retail sales can increase net realisation – but must be weighed against additional selling, marketing and distribution costs.
Common Mistakes in Dal Mill Return Calculations
Many dal mill project reports fail not due to machinery issues but due to unrealistic financial assumptions.
- Assuming 90–100% utilisation from Year 1 without accounting for ramp-up, maintenance downtime or market development time.
- Underestimating working capital and ignoring seasonal stocking requirements when calculating term loan needs and DSCR.
- Using optimistic recovery ratios – projecting 80% dal recovery when the raw material quality and machinery justify only 68–72%.
- Confusing profit with cash: Adding depreciation back for DSCR but mistakenly treating loan principal as an operating expense in ROI, or treating depreciation as a cash outflow.
- Omitting replacement capex and major overhaul costs for dal mill machines in long-term IRR and NPV models.
- Presenting guaranteed returns or “assured” loan sanctions in a project report – financial projections are estimates based on stated assumptions, not guarantees of future performance.
Dal Mill Machine Market, Technology Choice and ROI Impact
The dal mill machine market includes mini dal mills, semi-automatic and fully automatic plants. Dal Mill Machines include automatic, semi-automatic, and manual types – each with different capital cost, labour requirements and production capacity. The Dal Mill Machine Market was valued at $3.24 billion in 2024 and is projected to reach $4.86 billion by 2035, with an expected CAGR of 3.76% over the forecast period from 2025 to 2035.
Chana dal has the highest market value among pulse types, reaching $0.81 billion in 2024. Electric-powered dal mills had a market valuation of $1.62 billion in 2024, and the 100–200 kg/hr capacity segment holds the largest market share globally. The asia pacific region, and India in particular, drives much of this market growth, with the asia pacific market representing the fastest growing segment. Advanced dal mill machines with real time monitoring, better aspiration, colour sorters and polishers can improve yield and recovery, which positively affects dal mill IRR and payback period. Technological advancements continue gaining traction, and widespread adoption of these improvements supports operational efficiency gains.
In the european market and other countries, demand for processed pulses is also growing, driven by changing dietary habits and the health benefits of pulses. Major players and key players in the dal mill machine market provide a range of options at different price points. The growth rate of the overall market reflects both the rising demand in the asia pacific region and the growing market demand in emerging markets.
However, selecting higher-capacity or fully automatic machines requires matching with realistic raw material availability, target market size and promoter capital. Oversizing the plant merely to show higher projected profits is counterproductive if actual volumes do not materialise. Promoters should compare quotations from leading company suppliers while keeping lifetime operating cost and maintenance in focus. A free sample run or trial production on candidate machinery can provide useful data on actual recovery and power consumption.
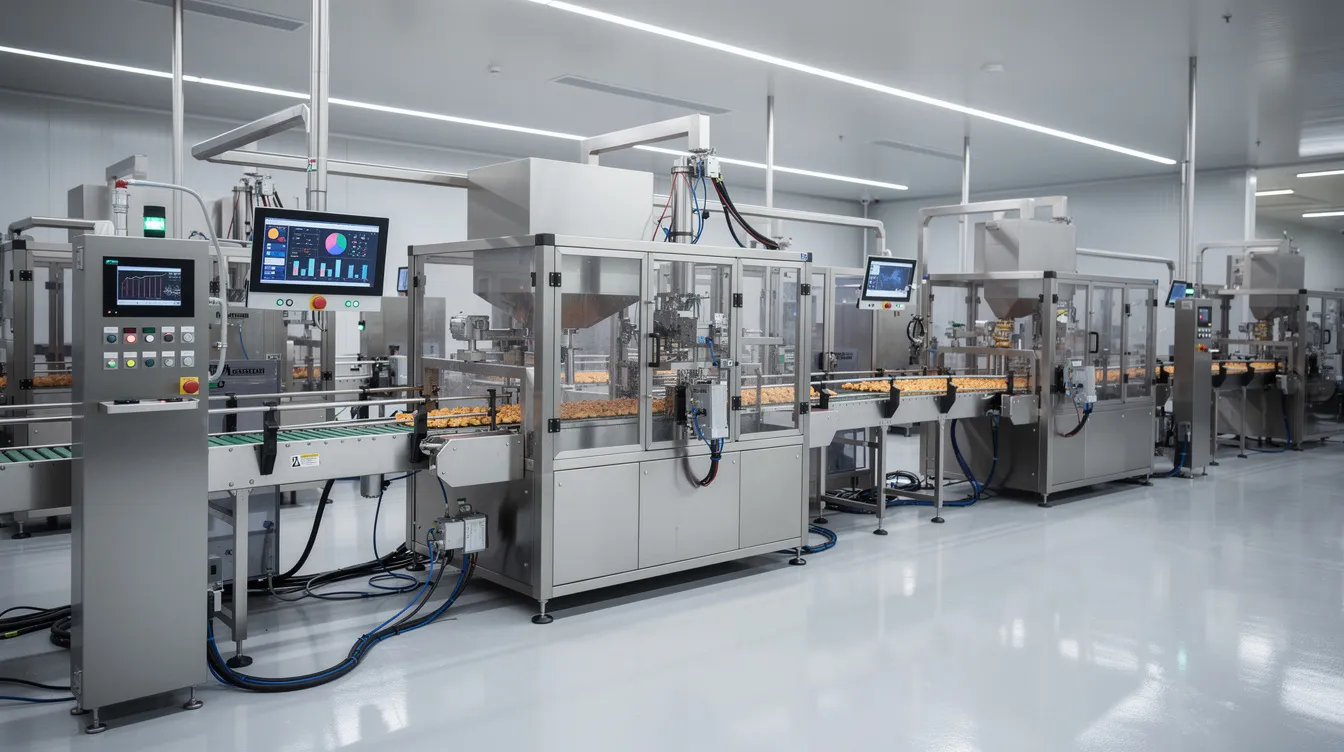
Role of a Structured Dal Mill Project Report in ROI Assessment
A professionally prepared dal mill project report integrates technical data, market research, plant layout, project cost, means of finance and multi-year financial projections into a single coherent document. A comprehensive business plan is essential for funding applications from banks and investors. Mandatory statutory approvals include FSSAI license and GST registration, and regulatory compliance involves obtaining all necessary licenses and certifications. A well-designed layout optimises workflow and ensures safety. Quality raw materials impact the output’s quality and reputation throughout the product lifecycle.
A good project report should cover:
- Detailed manufacturing process description of the key machines including dehusking, splitting, and polishing machines
- Raw material mapping with step by step guide to procurement planning
- Plant layout showing equipment placement, storage and utilities
- Machinery list with specifications and quotations
- Dal mill project cost and means of finance with complete funding structure
- Revenue model, cost projections and financial indicators: ROI, IRR, DSCR, break-even
Project Report Bank prepares customised dal mill DPRs with realistic, project-specific assumptions rather than generic templates – a critical distinction when financial institutions evaluate a funding proposal.
Frequently Asked Questions on Dal Mill ROI and Financial Feasibility
What is a reasonable ROI range for a dal mill project in India?
Small-to-medium scale dal mills generally target an ROI between 25% and 40% on total project cost under stabilised conditions. However, actual ROI depends heavily on raw material procurement prices, dal recovery, selling prices, capacity utilisation and management efficiency. Early-year ROI is usually lower due to capacity ramp-up. Any specific figure must be validated against project-specific assumptions.
How many years of financial projections do banks expect in a dal mill DPR?
Most banks and financial institutions expect 5–7 years of detailed financial projections, covering the term loan repayment period. These projections should include projected P&L, balance sheet, cash flow, working capital, DSCR and key financial ratios. Some schemes may require projections covering up to 10 years.
How does dal recovery percentage affect IRR most directly?
Dal recovery determines how many kilograms of saleable product are produced per quintal of raw input. A 2 percentage point improvement in recovery – from 62% to 64% – increases finished dal output and revenue without any increase in raw material cost. This flows directly to the bottom line and improves both annual profit and the multi-year IRR. Investing in proper pulse conditioning and better machinery is one of the most cost-effective ways to improve returns.
Can a small mini dal mill be financially viable with job work alone?
A job-work model reduces capital risk because the mill charges a processing fee per quintal rather than bearing raw material and selling price risk. For very small units, job work can provide steady cash flows. However, the profit margin per quintal is typically lower than a buy-process-sell model. Financial viability depends on volume throughput, processing fee levels and fixed cost coverage. It can be a viable starting point but may limit long-term growth in a very profitable business model.
What is the difference between profitability and DSCR in a dal mill context?
Profitability measures whether revenue exceeds costs. DSCR measures whether the cash generated (not just accounting profit) is sufficient to cover both interest and principal repayment on term loans. A project can be profitable on paper but still have a weak DSCR if cash is locked in inventory or receivables, or if the repayment schedule is front-loaded. Banks evaluate DSCR separately from profitability.
How should raw pulse price volatility be handled in sensitivity analysis?
Raw pulse prices are inherently volatile due to harvest seasonality, MSP policy, import duties and market supply. Sensitivity analysis should test at least +5% and +10% increases in raw material cost to understand the impact on profit, ROI and DSCR. Since raw material costs constitute about 80% to 90% of operational expenses in dal milling, even moderate price increases have a disproportionate effect. Combined scenarios – where raw costs increase and selling prices decline simultaneously – should also be tested.
Is a dal mill a very profitable business?
A dal mill can be a profitable business, particularly at medium-to-large scale with good procurement discipline, adequate recovery and appropriate automation. Net profit margins for commercial dal mills typically range from 8% to 15% of sales. However, margins are thin relative to revenue, and returns are sensitive to multiple variables. Promoters should assess returns alongside technical feasibility, market access and downside resilience rather than relying on generic profitability claims. Market research helps in selecting the right product mix and pricing strategy.
Final Professional Perspective and Call to Action
Dal mill project viability must be judged by a combination of ROI, project IRR, equity IRR, payback period, break-even throughput, DSCR and sensitivity analysis – not by any single metric. Each tool answers a different question: ROI measures annual returns, IRR captures multi-year cash flow performance, payback indicates capital recovery speed, DSCR confirms repayment capacity, and sensitivity reveals how robust the entire model is under adverse conditions.
Promoters should evaluate technical feasibility, raw material security, market access, funding structure and downside cash flows together before committing capital. The quality of the investment decision depends on the quality of the underlying assumptions.
Project Report Bank provides customised dal mill DPRs, financial projections, CMA Data and funding documentation prepared with project-specific assumptions and professional financial analysis – not generic templates. If you are planning a dal mill project and need a customised ROI, IRR and DSCR analysis, you can reach us through the WhatsApp enquiry option available on our website. All projections are prepared based on stated assumptions and represent estimates of future performance – they are not guaranteed outcomes.
For professional support, explore our financial projections and financial modelling services and bank finance DPR and loan proposal assistance.
CA Manish Gugliya FCA, DISA (ICAI) More than 20 years of professional experience in project reports, financial projections, CMA Data, project finance and business advisory.