When an entrepreneur approaches a bank for a dal mill term loan or cash credit facility, the conversation ultimately comes down to numbers. Can this project generate enough cash to repay debt? Are the assumptions behind the projections reasonable? This article explains, from a practising Chartered Accountant’s perspective, how to prepare realistic dal mill financial projections, CMA Data, working capital assessments and DSCR calculations that banks can take seriously.
Key Takeaways
Preparing a dal mill project report for bank loan is not about filling templates with optimistic figures. It requires a structured financial model built on defensible assumptions.
- Dal mill financial projections must cover 5–7 years of projected P&L, balance sheet, cash flow, term loan repayment and working capital assessment. A detailed project report is mandatory for loan applications, and banks evaluate every assumption behind the numbers.
- Working capital planning is as critical as machinery investment in pulse milling. Seasonal raw pulse procurement, inventory holding and trade receivables create financing gaps that must be addressed through properly assessed cash credit limits.
- DSCR should be at or above 1.50 for comfortable debt servicing. Banks examine both year-wise and average DSCR across the loan tenure, and artificially inflated projections are quickly identified during appraisal.
- This article is written from the professional perspective of CA Manish Gugliya (20+ years of experience in project finance, DPR preparation and CMA Data) and covers commercial dal milling units processing Toor, Chana, Moong, Urad and Masoor in India.
All numerical examples in this article are illustrative calculations – not actual project quotations or guaranteed financial results. Every dal mill project requires customised financial modelling based on its specific capacity, location and market conditions.
Introduction – Why Financial Projections Matter for a Dal Mill Bank Loan
Banks in India – SBI, PNB, BOI, cooperative banks and others – do not sanction dal mill loans based on the promoter’s enthusiasm alone. They evaluate whether the proposed unit can operate profitably, generate adequate cash flow and service both term loan and working capital obligations over the projection period.
Financial projections for a dal mill require estimating operational costs and market demand with reasonable accuracy. A dal mill bank loan proposal must include term loan and cash credit requirements supported by 5–7 years of projected P&L, balance sheet, cash flow statements, DSCR analysis and working capital assessment. A 5-year financial projection is typically required in the DPR, with longer projections for extended repayment tenures.
Dal milling has characteristics that make financial modelling more complex than many manufacturing businesses. Agricultural commodities like pulses are sensitive to seasonal price fluctuations and availability. Raw pulse procurement happens largely during harvest months at mandi-driven prices, recovery ratios vary by pulse type, and by-product income from husk, chuni and broken dal must be separately estimated. Capacity utilisation takes time to stabilise, and even small changes in recovery percentage directly affect gross margins.
These factors make dal mill financial projections the core of any bankable DPR. Without internally consistent, assumption-backed numbers, even technically sound projects face delays or rejection at the appraisal stage.
Key Financial Assumptions for a Bankable Dal Mill Financial Model
Realistic assumptions are the foundation of accurate dal mill financial projections. Over-optimistic numbers do not just mislead lenders – they mislead the promoter into committing capital to a project that may not work as planned.
The following assumptions must be clearly defined in any bankable financial model:
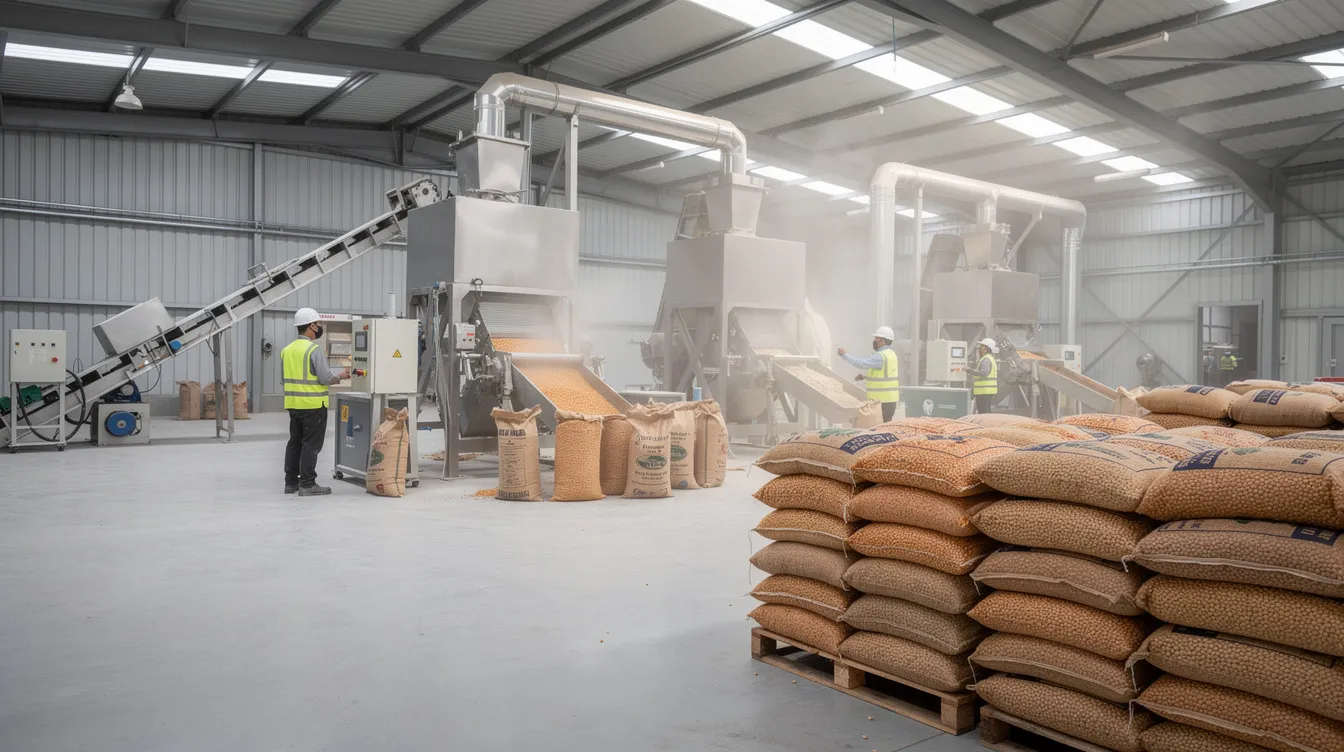
- Installed capacity and utilisation: For a 3 TPD plant operating 300 days per year on a single shift, capacity utilisation should be projected around 40% to 50% in the first year for new mills, increasing to 70–75% by Year 3 and stabilising at 85–90% by Year 5.
- Raw pulse procurement: Pulse-wise mix (Toor, Chana, Moong, Urad, Masoor), average purchase prices anchored to mandi benchmarks, seasonal variation and transport costs. Seasonal volatility affects raw pulse prices based on harvest outcomes and government policies.
- Recovery and losses: Milling recovery rates typically range from 70% to 80% for dal production, depending on pulse type and process efficiency. Broken dal percentage, husk and chuni yield, and processing losses must be separately estimated. Detailed pulse-wise benchmarks are available in our guide on dal mill recovery ratio, dal yield, broken percentage and milling losses.
- Selling prices: Realistic price bands (e.g., ₹80–₹110/kg depending on pulse type and packaging format), supported by market data rather than aspirational targets.
- Operating costs: Power and fuel consumption (refer to our analysis of dal mill power consumption, dryers and utility requirements), manpower, repairs, packing materials, QC, administrative and selling expenses.
- Depreciation and tax: As per Income Tax Act useful lives (SLM or WDV), current corporate tax rates.
- Finance assumptions: Interest rate band (typically 9–12% for MSME term loans), repayment tenure, moratorium period. Actual bank terms vary by lender and risk profile.
All assumptions must remain consistent across P&L, cash flow and balance sheet projections. Discrepancies between statements are one of the most common reasons for CMA Data queries from banks.
Dal Mill Project Cost and Means of Finance
Project cost covers the total capital required to make the dal mill operational. Means of finance describes where that capital comes from. Dal mill project costs range from ₹15 lakh to ₹1 crore depending on capacity, automation level and location.
Major project cost components include:
- Land and site development (see dal mill land, building and plant layout requirements)
- Building and civil works (factory shed, godown, office)
- Plant and machinery – cleaning, dehusking, splitting, grading, polishing, colour sorter and packaging machinery
- Electricals, utilities, pre-operative and preliminary expenses
- Contingency (5–10%)
- Margin for working capital (initial stocks and receivables)
Working capital margin is part of total project cost but revolving cash credit is not treated as permanent long-term finance.
Illustrative Project Cost & Means of Finance (3 TPD Dal Mill)
| Component | ₹ Lakh |
|---|---|
| Land & Site Development | 8.00 |
| Building & Civil Works | 14.00 |
| Plant & Machinery | 32.00 |
| Electricals & Utilities | 4.50 |
| Pre-operative & Preliminary Expenses | 3.50 |
| Contingency | 5.00 |
| Working Capital Margin | 18.00 |
| Total Project Cost | 85.00 |
| Means of Finance | ₹ Lakh |
|---|---|
| Promoter Contribution (30%) | 25.50 |
| Term Loan from Bank (70%) | 59.50 |
| Total | 85.00 |
Illustrative calculations – not actual project quotations.
For detailed cost benchmarks across capacities, refer to our article on dal mill project cost and means of finance.
Dal Mill Sales and Revenue Projections
Dal mill sales projections are quantity-driven. Revenue is not an arbitrary annual figure – it flows from input tonnage, recovery percentage and selling prices for each product line. Primary revenue comes from sales of finished split pulses to wholesalers and retailers.
Worked Example – Year 2 (3 TPD, 55% Utilisation, 300 Days)
Raw pulse input = 3 TPD × 55% × 300 = 495 tonnes/year
| Product | Recovery % | Quantity (MT) | Rate ₹/kg | Revenue ₹ Lakh |
|---|---|---|---|---|
| Finished Dal | 74% | 366 | 95 | 347.70 |
| Broken Dal | 5% | 25 | 55 | 13.75 |
| Husk & Chuni | 15% | 74 | 12 | 8.88 |
| Losses | 6% | 30 | – | – |
| Total | 100% | 495 | 370.33 |
Revenue from by-products – husk, chuni, broken dal and additional streams – is modest per kg but adds up meaningfully at scale. Dal mill profitability is directly influenced by raw pulse purchase prices and recovery rates. A 2% drop in recovery or ₹3/kg reduction in selling price can reduce gross profit by several lakh annually even for a small unit.
Sales channels also matter. Bulk B2B supply to wholesalers offers faster payment but lower margins, while branded retail packaging commands a premium but involves longer receivable periods and higher packaging costs. Revenue is fundamentally based on selling price minus raw material costs and processing expenses.
Projected Profit and Loss Statement for Dal Mill (5–7 Years)
Banks insist on dal mill profit and loss projections for at least 5 years to evaluate how profitability develops as capacity utilisation improves and loans are serviced. Dal mill operating expenses include raw material costs, labor, utilities and packaging. Raw material costs often constitute 80% to 85% of total operational expenses in milling.
Illustrative 5-Year P&L Summary (3 TPD Dal Mill)
| Particulars | Year 1 | Year 3 | Year 5 |
|---|---|---|---|
| Gross Sales (₹ Lakh) | 280 | 445 | 530 |
| Raw Material Cost | 224 | 347 | 410 |
| Other Operating Expenses | 28 | 38 | 42 |
| EBITDA | 28 | 60 | 78 |
| Depreciation | 8 | 8 | 7 |
| Interest (TL + CC) | 10 | 8 | 5 |
| PBT | 10 | 44 | 66 |
| Tax | 3 | 11 | 17 |
| PAT | 7 | 33 | 49 |
Illustrative calculations – not actual project quotations.
The profit margin for dal milling operations typically ranges from 6% to 12%, and net profit after interest is generally 8–12% of sales in well-managed units. EBITDA margins improve significantly from Year 1 to Year 5 as fixed cost absorption improves with higher utilisation.
P&L alone is insufficient. It must reconcile with cash flow projections and balance sheet projections used in CMA Data.
Dal Mill CMA Data Preparation for Bank Loans
CMA Data (Credit Monitoring Arrangement) is a standardised, multi-year financial projection format used by Indian banks for working capital and term loan appraisal. CMA data must include operating statements and cash flow statements along with projected balance sheets, MPBF calculations and ratio analyses.
The main CMA schedules for a dal mill include:
- Projected operating statement (P&L)
- Projected balance sheet
- Statement of current assets and current liabilities
- MPBF (Maximum Permissible Bank Finance) computation
- Fund flow statement
- Key financial ratios
Dal mill CMA Data must capture 5–7 years of financial projections with internally consistent assumptions. Sales volumes must match production capacity and recovery ratios. Stock levels must reflect inventory holding assumptions. Term loan balances must follow the repayment schedule. Equity must grow by retained profits each year.
CMA Data is an analytical projection document, not a guarantee or certification of business performance. Banks perform their own appraisal and may modify assumptions during credit assessment.
For professional preparation of bank-compliant CMA Data, Project Report Bank offers CMA Data preparation services for bank loans customised to each project’s specifics.
Dal Mill Working Capital Requirements and Assessment
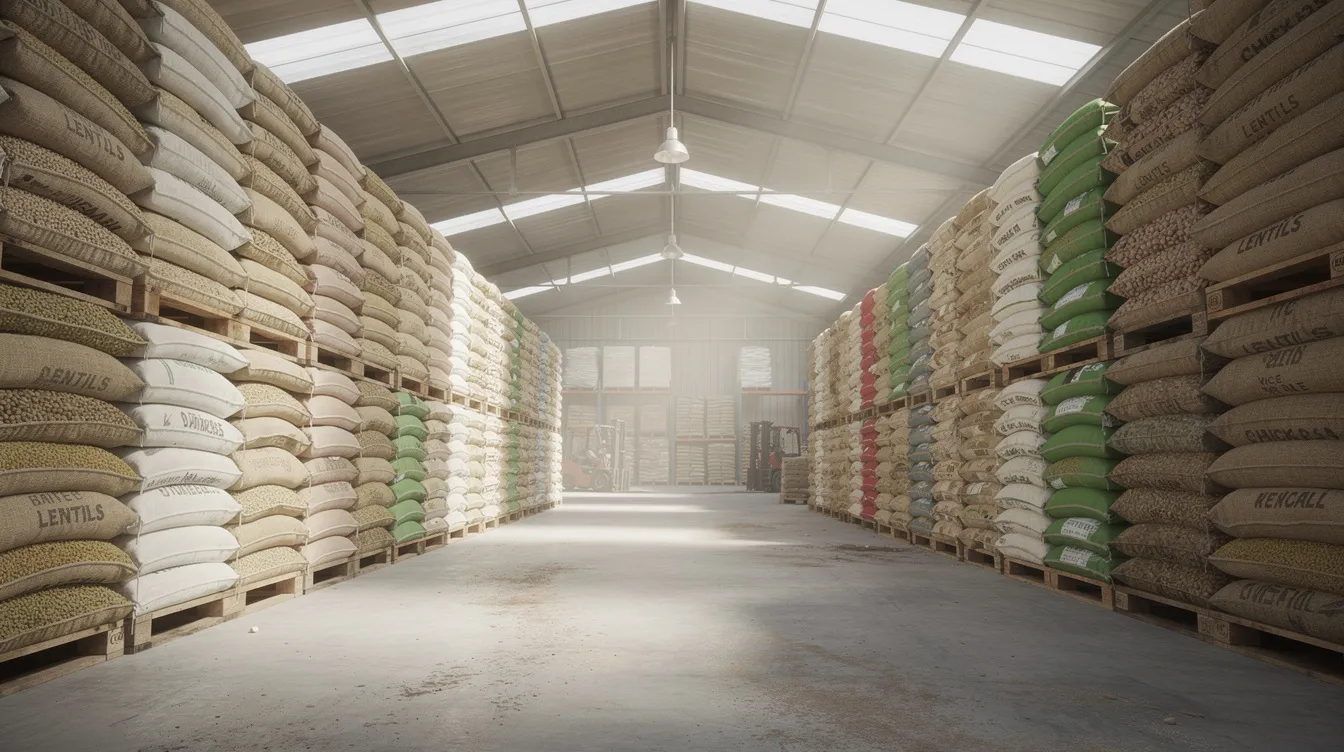
For dal mills, working capital financing is essential due to rapid inventory turnover in pulse milling. Raw pulse procurement is seasonal – buying happens at scale during harvest months when prices are lower – but production and sales continue throughout the year. This creates substantial inventory holding requirements.
Key working capital components include:
- Raw pulse inventory (often 1–3 months of consumption)
- Work-in-progress
- Finished dal stock (15–30 days)
- Packing material
- Trade receivables (15–45 days depending on channel)
- Less: trade creditors and supplier advances
Banks finance working capital through cash credit limits. Drawing power is calculated based on eligible value of stock and receivables after applying margin norms (typically 25% for stocks) and ageing norms for receivables.
Illustrative Working Capital Assessment (3 TPD, Year 3)
| Component | Amount ₹ Lakh |
|---|---|
| Raw Pulse Inventory (45 days) | 43.00 |
| Finished Goods (20 days) | 25.00 |
| Packing Material | 2.00 |
| Receivables (30 days) | 37.00 |
| Cash/Bank Balance | 3.00 |
| Total Current Assets | 110.00 |
| Less: Creditors (15 days) | 17.00 |
| Other Current Liabilities | 5.00 |
| Working Capital Gap | 88.00 |
| Promoter Margin (25%) | 22.00 |
| Bank CC Limit Required | 66.00 |
Illustrative calculations – not actual project quotations.
Understanding raw pulse procurement, storage and seasonal inventory planning is critical because seasonal stocking can push working capital requirements much higher than average monthly figures suggest. A dal mill showing healthy profits on paper can face severe liquidity stress if its seasonal raw pulse inventory is under-financed.
Working capital assessment must align with production assumptions, sales volumes and credit terms used throughout the financial projections and CMA Data.
Dal Mill Cash Flow Projections and Term Loan Repayment
Accounting profit and cash flow are not the same thing. A dal mill may show net profit of ₹30 lakh on its P&L but have negative cash flow if ₹50 lakh is locked in seasonal inventory build-up. Banks are concerned with whether actual cash will be available to service term loan instalments and interest.
Dal mill cash flow projections cover three components:
- Operating cash flow: PAT + depreciation – increase in working capital
- Investing cash flow: Capital expenditure on fixed assets
- Financing cash flow: Term loan disbursement, promoter equity, loan repayments
The dal mill term loan repayment schedule is typically structured over 5–7 years, sometimes with a moratorium of 6–12 months. Loan repayment period typically spans 5-7 years. Instalments may be quarterly or half-yearly, structured as equal principal or equated amounts.
Illustrative Year-Wise Cash Flow (3 TPD Dal Mill)
| Particulars | Y1 | Y2 | Y3 | Y4 | Y5 |
|---|---|---|---|---|---|
| PAT + Depreciation (₹ L) | 15 | 30 | 41 | 48 | 56 |
| Working Capital Change | -18 | -8 | -5 | -2 | 0 |
| Operating Cash Flow | -3 | 22 | 36 | 46 | 56 |
| Loan Repayment (P+I) | 15 | 18 | 18 | 17 | 15 |
| Net Surplus / (Deficit) | -18 | 4 | 18 | 29 | 41 |
Illustrative calculations – not actual project quotations.
Year 1 typically shows a deficit because of initial working capital build-up. From Year 2 onward, positive operating cash flow should comfortably exceed debt obligations. For professional-level cash flow modelling, our financial projections and financial modelling services are available for dal mill projects across India.
Dal Mill DSCR Calculation and Loan Repayment Capacity
The Debt Service Coverage Ratio measures whether a dal mill’s cash earnings can cover its term loan obligations. DSCR should be at or above 1.50 for comfortable debt servicing, and most banks use this as a minimum threshold for loan eligibility assessment.
DSCR Formula:
DSCR = (PAT + Depreciation + Term Loan Interest) ÷ (Term Loan Principal Repayment + Term Loan Interest)
Each component in plain language: the numerator represents cash available from operations (profit, plus non-cash depreciation, plus interest which is being paid anyway). The denominator represents total debt service – principal plus interest on the term loan.
Worked Example (Year 3): PAT = ₹33 lakh, Depreciation = ₹8 lakh, TL Interest = ₹6 lakh → Numerator = ₹47 lakh Principal Repayment = ₹12 lakh, TL Interest = ₹6 lakh → Denominator = ₹18 lakh DSCR = 47 ÷ 18 = 2.61
Illustrative 5-Year DSCR Table
| Year | PAT ₹L | Dep ₹L | TL Int ₹L | Numerator ₹L | Principal ₹L | Denom ₹L | DSCR |
|---|---|---|---|---|---|---|---|
| 1 | 7 | 8 | 8 | 23 | 8 | 16 | 1.44 |
| 2 | 20 | 8 | 7 | 35 | 10 | 17 | 2.06 |
| 3 | 33 | 8 | 6 | 47 | 12 | 18 | 2.61 |
| 4 | 42 | 7 | 4 | 53 | 14 | 18 | 2.94 |
| 5 | 49 | 7 | 2 | 58 | 15 | 17 | 3.41 |
| Average DSCR | 2.49 |
Illustrative calculations – not actual project quotations.
Year 1 DSCR may be below 1.50 during the ramp-up period, particularly if a moratorium on principal applies. Banks examine both the minimum year-wise DSCR and the average DSCR over the loan tenure. Manipulating DSCR through unrealistic sales assumptions, understated expenses or artificially extended repayment periods is counterproductive – experienced credit officers identify such adjustments quickly.
Projected Balance Sheet and Key Financial Ratios for Dal Mills
Projected balance sheets for 5–7 years show how the dal mill’s financial position develops – fixed assets reducing by depreciation, net worth growing through retained profits, term loan declining through repayments and current assets reflecting operational scale.
Key ratios bankers evaluate:
| Ratio | Indicative Range | Significance |
|---|---|---|
| Current Ratio | 1.33–2.00 | Liquidity adequacy |
| Debt-Equity Ratio | Below 3:1 | Leverage comfort |
| Interest Coverage | Above 2.00 | Interest-paying ability |
| Net Profit Margin | 6–12% | Operational efficiency |
| ROCE | 15–30% | Capital productivity |
The optimal current ratio for dal mills is ideally maintained around 1.33 to 2. These ratios must be interpreted together, not in isolation. High profit with a poor current ratio may still concern lenders due to liquidity risk. Financial metrics such as break-even point and return on investment are crucial for dal mills, and banks assess them alongside DSCR and cash flow patterns.
Dal Mill Break-Even Analysis and Sensitivity Testing
Break-even analysis calculates the volume required to cover all fixed and variable costs. For a dal mill, it identifies the minimum production level at which the unit neither makes profit nor incurs loss.
Illustrative Break-Even Calculation: Fixed costs (depreciation, interest, salaries, rent) = ₹22 lakh/year Variable cost per kg of dal (raw pulse cost adjusted for recovery, packaging, power) = ₹72/kg Average selling price = ₹95/kg Contribution per kg = ₹23/kg Break-even quantity = 22,00,000 ÷ 23 = 95,652 kg ≈ 96 tonnes/year
For a 3 TPD plant operating 300 days, this represents roughly 35–40% capacity utilisation. The break-even point is typically achieved within 12–18 months of operations for properly planned units.
Sensitivity Comparison
| Scenario | Change | Impact on EBITDA | DSCR Direction |
|---|---|---|---|
| Base Case | – | ₹60 lakh | 2.61 |
| Raw Pulse Price +5% | +₹17L cost | ₹43 lakh | Lower |
| Recovery –2% | –₹9L revenue | ₹51 lakh | Lower |
| Capacity –10% | –₹45L sales | ₹36 lakh | Significantly Lower |
Dal mill financial feasibility should never be judged on a single optimistic scenario. Lenders appreciate DPRs that present downside risks transparently along with risk-mitigation measures.
Common Financial Projection Mistakes in Dal Mill DPRs
Many dal mill project reports face delays because of avoidable errors:
- Unrealistic recovery rates – assuming 80%+ for Toor when benchmarks indicate 65–75%. Validate against industry data.
- High Year-1 utilisation – projecting 80–90% capacity utilisation from Day 1 instead of a realistic 40–50% ramp-up.
- Understated raw material costs – ignoring transport, moisture loss, cleaning costs and seasonal price spikes.
- Inadequate working capital – omitting seasonal inventory build-up and receivable delays.
- Incorrect loan schedules – repayment amounts that do not match term loan balance or interest calculations.
- Inconsistent statements – P&L depreciation not matching balance sheet asset reduction, or stock figures differing between CMA schedules.
- Overstated selling prices – using retail prices for bulk-sale assumptions without adjusting for trade margins and GST.
Each error weakens credibility. Getting the financial model reviewed by an experienced Chartered Accountant before submission is a practical corrective step.
Documents and Information Required for Dal Mill CMA Data and Financial Projections
Strong dal mill financial projections depend on accurate ground-level data:
- Technical: Machinery quotations with machinery details and machinery cost, proposed plant capacity, process flow, land and building layout, power requirement
- Promoter: KYC, past financial statements (if existing unit), GST registration, FSSAI license, bank statements, eligibility documents
- Market inputs: Target sales channels, expected selling prices, credit period to customers, raw pulse sourcing regions and seasonal patterns
- Finance: Proposed term loan amount, promoter contribution, any subsidy involvement
For scheme-linked projects, a detailed project report is mandatory for PMFME subsidy. The PMFME scheme offers a 35% capital subsidy on eligible project costs, capped at ₹10 lakh. Exact scheme details and government schemes eligibility should be verified from official sources before preparing the business plan.
How Banks Evaluate Dal Mill Financial Projections and Loan Proposals
Banks assess whether the dal mill project is technically sound, backed by capable promoters and supported by defensible financial projections. Typical appraisal checks include:
- Consistency between installed production capacity and projected sales volumes
- Reasonableness of raw material cost, recovery and selling price assumptions
- Sufficiency of working capital and realistic DSCR trends across 5–7 years
- Comparison of dal mill financial projections with industry benchmarks and published data
Collateral is required for loans above ₹10 lakh. Primary security typically includes plant and machinery, stocks and receivables. Additional collateral may include land, building or third-party guarantees depending on bank policy and exposure levels.
Final sanction always depends on the individual bank’s credit policy, risk appetite and regulatory compliance – not only on the quality of projections.
Professional Dal Mill Financial Modelling, CMA Data and DPR Assistance
CA Manish Gugliya is a practising Chartered Accountant with over 20 years of experience in preparing dal mill project reports, CMA Data and financial models for MSMEs and food processing units across India.
Project Report Bank supports dal mill promoters with:
- Customised dal mill project report for bank loan (term loan + cash credit)
- 5–7 year financial projections with integrated P&L, cash flow, balance sheet
- Dal mill CMA Data preparation aligned with bank appraisal requirements
- DSCR analysis, working capital assessment and sensitivity modelling
Bank Finance DPR and Loan Proposal Assistance starts from ₹25,000, subject to project scope. This is a professional advisory engagement – not an off-the-shelf report or a PDF download.
To discuss your dal mill capacity, location and bank loan requirements, message via WhatsApp from the website contact page for a customised quote.
Frequently Asked Questions
How many years of dal mill financial projections do banks usually ask for?
Most banks require a minimum of 5 years of projected financial statements. When the term loan repayment period exceeds 5 years, 7-year projections are preferred. The projection period should align with the loan tenure so that DSCR and cash flow can be evaluated across the entire repayment schedule.
Can a dal mill show good profit but still face cash flow problems?
Yes. This is common in pulse milling because of heavy seasonal stocking. If a dal mill purchases 3–4 months of raw pulse inventory during harvest, the cash outflow is front-loaded while sales revenue comes in gradually. Delayed debtor recovery, high interest on working capital and lumpy loan repayments can all create cash shortages even when the P&L shows satisfactory profit. This is precisely why cash flow projections and properly assessed cash credit limits are essential.
What is the difference between a dal mill project report and CMA Data?
A dal mill project report (DPR) covers the complete project – technical process, market potential, demand analysis, machinery details, financial overview, profitability and loan repayment analysis in a narrative format with supporting annexures. CMA Data is a structured set of financial statements (operating statement, balance sheet, MPBF, fund flow, ratios) in the format prescribed by banks for credit appraisal. Both documents should use the same underlying assumptions and must be consistent with each other.
How can I improve the credibility of my dal mill financial projections before submitting to the bank?
Use realistic dal recovery percentages validated against industry benchmarks rather than aspirational figures. Support selling price assumptions with mandi data or buyer enquiries. Ensure internal consistency – depreciation in the P&L must match the balance sheet, stock figures must reflect actual inventory holding plans, and the term loan schedule must reconcile with interest and cash flow statements. Having the financial model reviewed by a Chartered Accountant experienced in food processing project finance significantly improves credibility. Savings on professional fees at this stage can prove costly if the loan proposal is rejected or delayed.
Is a dal mill a good business opportunity in a semi urban area?
Pulses are a primary source of protein in the Indian diet and demand remains strong across rural, semi urban area markets and urban centres. A dal mill located near pulse-growing regions benefits from lower raw material transport costs and proximity to green gram, chana, urad and moong procurement mandis. Market potential depends on local competition, distribution reach and whether the unit focuses on bulk supply, retail packaging or both. Financial feasibility should be assessed project-specifically – a well-located, efficiently managed unit can achieve sustainable profitability, but location alone does not guarantee success. Entrepreneurs should evaluate the full financial overview including production capacity, working capital and loan repayment before committing capital. Training in pulse milling operations and quality grading also helps new entrants manage the process more efficiently, whether it is a single operation unit or a multi-line plant. The same analytical rigour applies whether the promoter is setting up a flour mill, a rice mill or a dal mill – the report must present a clear plan with realistic assumptions.
Conclusion – Building a Bankable Dal Mill with Strong Financials
Accurate dal mill financial projections, robust CMA Data, realistic working capital planning and sustainable DSCR together form the foundation of a credible bank loan proposal. Without these, even a technically well-designed dal mill project risks delays, under-financing or outright rejection at the appraisal stage.
Dal milling remains a promising food processing opportunity in India, but long-term viability depends on disciplined procurement, efficient operations, careful cash flow monitoring and conservative borrowing. The numbers in the DPR should tell a logical business story – one that a banker can examine, question and ultimately support.
If you are planning a dal mill project and need a customised project report, CMA Data or financial model prepared for your specific capacity, location and bank’s requirements, reach out to CA Manish Gugliya and the Project Report Bank team. The preferred way to start is via WhatsApp from the website contact page – share your basic project details and we will provide a professional quote.