Author: CA Manish Gugliya
Key Takeaways
Understanding dal mill production cost per kg is the starting point for evaluating whether a pulse processing unit is commercially viable. Profitability depends on the interplay between raw material cost, milling recovery, processing expenses and by-product realisations-not merely on turnover or installed capacity.
- Production cost per kg of finished dal must be split into raw pulse purchase cost, processing cost per kg and net production cost after by-product credit, each calculated on a clearly defined denominator.
- A transparent worked example using 1,000 kg of raw Toor demonstrates that gross and net production cost per kg, revenue lines and realistic dal mill profit margin in India can be computed step by step.
- Variable costs (raw pulses, power, labour) and fixed costs (depreciation, salaries, insurance) must be separated to understand break-even and the effect of capacity utilisation on per-kg economics.
- By-product revenues from broken dal, husk and chuni materially reduce net cost; ignoring them overstates the true production cost per kg.
- A customised DPR, CMA data and financial projections from Project Report Bank help entrepreneurs plan dal mill projects and bank loan proposals with defensible assumptions rather than generic templates.
Introduction: What Determines Dal Mill Profitability?
Dal milling is the third largest food processing industry in India. Millions of people eat dal as part of their daily Indian meals, and this daily demand underpins the commercial logic of pulse milling as a stable business. Operating a dal mill involves breaking down raw whole grains into split de-husked pulse, and despite the apparent simplicity, the economics can vary dramatically from one unit to another.
Dal mill profitability is driven by six interconnected factors: raw pulse purchase price, dal recovery percentage, finished dal selling price, by-product realisation, processing expenses and capacity utilisation over the year. A small dal mill processing about 300 kg of pulses per hour and a large commercial operation running at 2 TPH can both be viable or unviable depending on how these variables combine. Mini dal mills have increased across India due to rising demand and growing cultivation, but high demand alone does not guarantee a profitable business.
Two dal mill businesses with identical annual turnover can report completely different profit margins. One may procure raw materials at harvest directly from small farmers, achieve strong recovery, and sell good quality dal in branded retail packs. The other may buy at peak season rates, suffer high breakage, and sell only in local markets at thin spreads. The difference is not capacity-it is operational planning, procurement discipline and financial management.
Before estimating dal mill profit margin in India, the first step is understanding what “cost per kg” actually means. The next section clarifies the terminology that many project reports get wrong.
Understanding Production Cost vs Processing Cost per Kg
A “₹ per kg” figure is meaningless unless we specify its denominator. Many dal mill DPRs and business plan documents confuse cost per kg of raw input with cost per kg of finished output, leading to flawed conclusions. Here are the correct definitions:
- Raw pulse purchase cost per kg of input – the landed cost of whole Toor, Chana or Moong at the mill gate, including freight and mandi fees.
- Conversion or processing cost per kg of raw pulses processed – power, labour, consumables and allocated overheads divided by the total raw input quantity.
- Processing cost per kg of finished dal – the same processing expenses divided only by the main dal output quantity.
- Total production cost per kg of finished dal – raw material plus all manufacturing expenses divided by the main saleable dal quantity.
- Net production cost per kg of finished dal – total production cost minus revenue from by-products (husk, chuni, brokens), divided by main dal quantity.
One kg of raw pulse typically yields approximately 65% to 75% of premium grade head dal, with milling recovery rates often varying between 75% to 80% of finished dal depending on the pulse type, conditioning and machinery. Raw material cost typically constitutes the largest component of production costs, with raw grain accounting for 75% to 85% of the total production input value of finished dal.
Costs per kg of raw input cannot be directly compared with costs per kg of finished dal. Similarly, job-work milling charges-where the mill processes pulses supplied by others-are not comparable with integrated manufacturing profit margins.
A simple illustration: if 1,000 kg raw Toor yields 750 kg finished dal, a ₹2/kg processing cost on raw input equals ₹2,000 total, which works out to approximately ₹2.67/kg on finished dal. The rest of this article uses consistent denominators so readers can correctly analyse dal mill cost and profit.
Dal Mill Production Cost Components (Variable, Fixed & Finance)
A proper dal mill production cost per kg requires separating expenses into variable, fixed and finance costs, and distinguishing manufacturing cost from broader business overheads. The total cost breakdown includes raw material, operational costs and recovery losses.
| Cost Head | Nature | In Manufacturing Cost? |
|---|---|---|
| Raw pulses (purchase cost) | Variable | Yes – largest component |
| Inward freight and local cartage | Variable | Yes |
| Unloading, handling, mandi fees | Variable | Yes |
| Cleaning and grading | Variable | Yes |
| Conditioning and drying | Variable | Yes |
| Power and electricity | Variable | Yes |
| Fuel for dryers / boilers | Variable | Yes |
| Direct labour (operators, helpers) | Variable | Yes |
| Supervisor wages | Semi-fixed | Yes – allocated per kg |
| Repairs, maintenance, spares | Semi-variable | Yes |
| Consumables (rubber rolls, emery) | Variable | Yes |
| Packaging materials | Variable | Yes |
| Quality control and lab testing | Semi-fixed | Yes |
| Godown rent / depreciation on building | Fixed | Yes – allocated per kg |
| Factory insurance | Fixed | Yes – allocated |
| Factory administration | Fixed | Yes – allocated |
| Depreciation on machinery | Fixed | Below EBITDA typically |
| Interest on term loan | Finance | Below EBITDA |
| Interest on working capital | Finance | Below EBITDA |
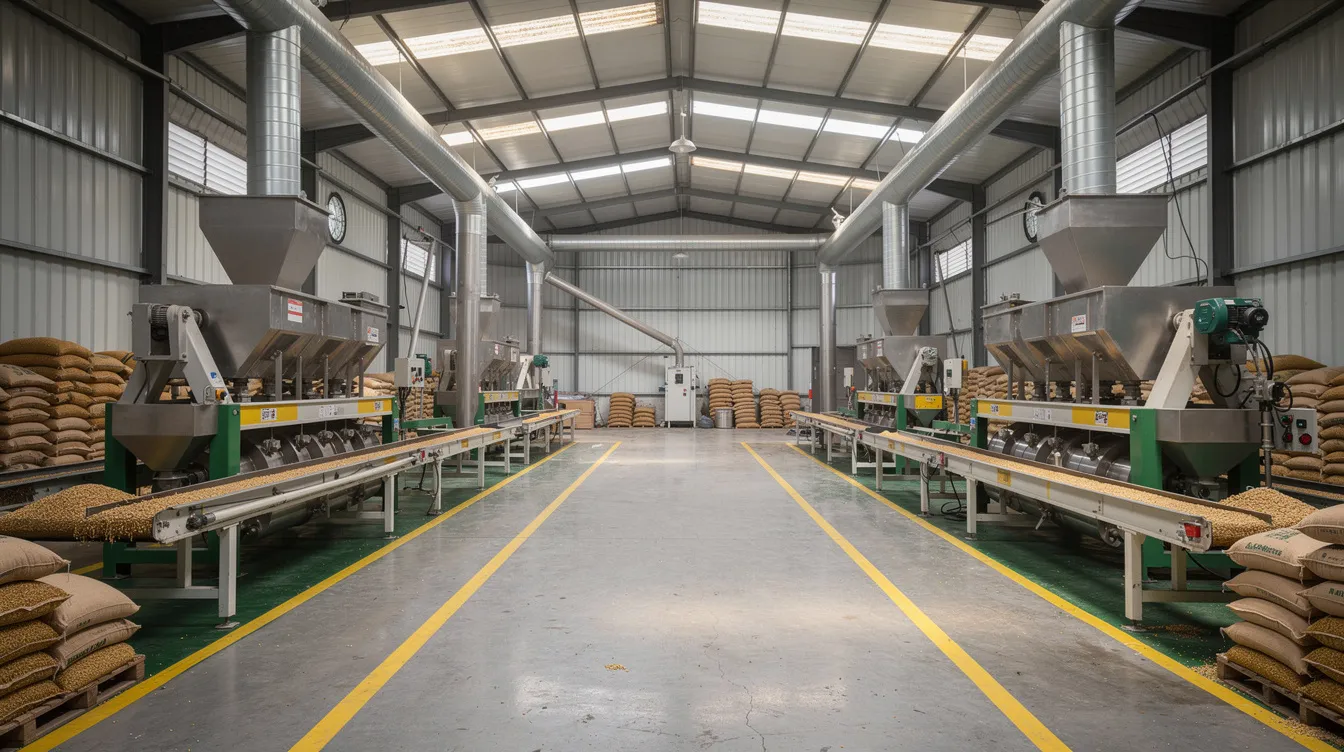
Key machines in a dal mill plant include graders, bucket elevators and packaging units, and dal milling requires notable electricity consumption for processing machinery. Raw pulses generally cost between ₹65 to ₹95 per kilogram, with average raw grain input cost ranging from ₹70 to ₹90 per kilogram depending on pulse type, season and region. Average production costs vary significantly based on pulse types and market conditions.
On the conversion side, pure operational and conversion cost generally ranges between ₹0.80 to ₹2.00 per kilogram of raw input. Excluding raw pulses, operational conversion cost ranges from ₹2.50 to ₹6.00 per kilogram of finished dal for small scale units and medium plants. Electricity costs for dal milling can vary based on local utility rates, averaging around ₹0.60 to ₹1.50 per kilogram, while electricity and utilities costs overall range from ₹0.20 to ₹0.40 per kilogram of raw input. Labour costs for processing dal in small setups average ₹0.30 to ₹0.50 per kilogram, and packaging and logistics add approximately ₹0.25 to ₹0.50 per kilogram.
The average total production cost for operating a dal mill ranges between ₹70 and ₹115 per kilogram of finished dal. The effective raw material cost can reach ₹78 to ₹102 per kilogram of finished dal after accounting for yield loss.
Variable costs change with tonnes processed and are the basis for contribution and break-even analysis. Fixed costs must be spread over actual throughput; at low capacity utilisation, per-kg fixed cost rises sharply. Interest and income-tax are normally shown below EBITDA and are not part of pure manufacturing cost per kg. Avoid double-counting-do not add full-year interest into per-kg processing cost and again deduct it in profit and loss.
Worked Example: Calculating Dal Mill Production Cost per Kg (Toor Dal)
All figures below are illustrative assumptions-not current market quotations. Actual numbers vary widely by state, season, scale and quality.
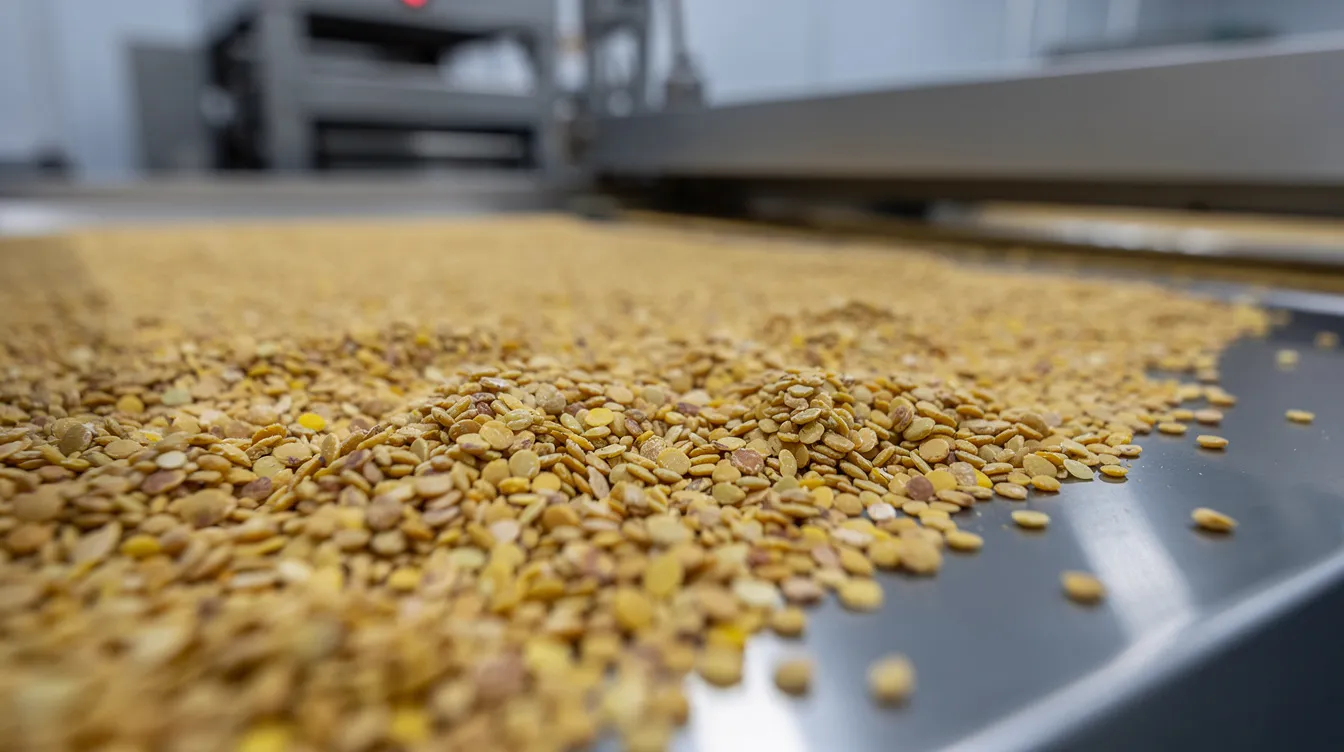
Toor dal mill machinery includes a precleaner and de-huskers as core processing equipment. For a small-scale dal mill, total fixed capital investment for a toor dal mill is approximately Rs.8,25,000. A mini dal mill can process about 300 kg of pulses per hour. The cost of toor dal as raw input is approximately Rs.25,000 per tonne at certain market conditions. Small-scale dal mills can process about 300 kg per hour.
Material Balance for 1,000 kg Raw Toor (at 12% moisture):
| Output | Quantity (kg) | % of Input |
|---|---|---|
| Main Toor dal (split, polished) | 700 | 70% |
| Broken dal | 30 | 3% |
| Husk and chuni | 230 | 23% |
| Process loss and fine dust | 40 | 4% |
| Total | 1,000 | 100% |
Input Cost Table:
| Item | Quantity | Rate | Amount (₹) |
|---|---|---|---|
| Raw Toor (whole) | 1,000 kg | ₹85.00/kg | 85,000 |
| Inward freight & local cartage | – | – | 1,200 |
| Unloading & handling | – | – | 300 |
| Total landed cost | 86,500 | ||
| Landed rate per kg raw | ₹86.50/kg |
Processing Cost Table (for 1,000 kg raw input):
| Expense | Amount (₹) |
|---|---|
| Power and electricity (cleaning, dehusking, splitting, grading, polishing) | 900 |
| Fuel for dryers and air compressors | 350 |
| Direct and indirect labour | 450 |
| Repairs, maintenance, consumables | 200 |
| Packaging materials (bags, labels, stitching) | 350 |
| Factory overheads (QC, insurance, local charges) | 250 |
| Total processing cost | 2,500 |
| Per kg raw Toor processed | ₹2.50/kg |
| Per kg finished dal (700 kg) | ₹3.57/kg |
A field study of tur dal processing units in Gujarat’s Bharuch district found processing costs of approximately ₹291.56 per quintal of raw input, which translates to roughly ₹2.92/kg of raw pulses-consistent with the illustrative range above after adjusting for scale and inflation.
Selling Price Table:
| Product | Quantity (kg) | Rate (₹/kg) | Revenue (₹) |
|---|---|---|---|
| Main Toor dal | 700 | 120 | 84,000 |
| Broken dal | 30 | 60 | 1,800 |
| Husk and chuni | 230 | 14 | 3,220 |
| Total revenue | 89,020 |
Key Calculations:
Gross production cost per kg of main dal = (Total manufacturing cost before by-product credit) ÷ Main dal quantity = (₹86,500 + ₹2,500) ÷ 700 = ₹89,000 ÷ 700 = ₹127.14/kg
Net production cost per kg of main dal = (Total manufacturing cost − By-product revenue) ÷ Main dal quantity = (₹89,000 − ₹1,800 − ₹3,220) ÷ 700 = ₹83,980 ÷ 700 = ₹119.97/kg
“Total manufacturing cost” here includes raw material, inward freight, variable processing costs and allocated fixed factory costs but excludes interest and income tax.
The dal mill processing cost per kg of finished Toor dal in this illustration is ₹3.57. The contribution per kg (selling price minus variable cost) supports a modest per-kg profit. This example shows an overall margin of approximately ₹0.03/kg on the main dal alone-but when by-product revenue is attributed correctly across the business, the unit generates a total profit of approximately ₹20 on 1,000 kg raw input (₹89,020 revenue minus ₹89,000 manufacturing cost). Real-world results improve with better procurement, higher recovery and branded packaging.
Revenue Sources in a Dal Mill Business
Dal mill revenue and profitability come from multiple streams, not only the main dal output. Ignoring by-products underestimates true contribution. Dal mills often recover secondary revenues from by-products like husk and broken dal.
- Main dal – polished or unpolished, single or double-polished; the primary revenue driver. Better colour sorting and grading help command higher prices.
- Broken dal – sold to snack manufacturers, hotels or feed users at a discount, typically ₹50–70/kg for Toor brokens.
- Husk and chuni – sold as cattle feed ingredients or fuel; learn more about maximising this at Dal Mill By-Products – Husk, Chuni, Broken Dal & Additional Revenue.
- Job-work income – per-kg processing charges where the mill does not own the pulses.
- Branded retail packaging – higher per-kg realisation but with higher unit costs; see Branded Dal Packaging Plant – Bulk Supply vs Retail Packaging for a comparison.
Annual revenue for a 500MT toor dal mill can reach Rs.12,50,000 depending on capacity utilisation and product mix. Realistic financial projections must include the expected sales mix across bulk, retail, by-products and job-work to arrive at accurate dal mill cost and profit analysis. A dal mill helps generate production output diversity that stabilises revenue across market cycles.
From Revenue to Profit: Gross Profit, EBITDA and Net Profit
Dal mill owners often quote “profit margin” without clarifying whether it refers to gross margin, EBITDA or net profit after interest and tax. Here are the standard definitions:
- Gross profit = Total revenue − Cost of goods sold (raw pulses, processing, packaging; excludes admin overhead, depreciation and finance cost)
- EBITDA = Gross profit − Operating overheads (office salaries, marketing, non-production repairs)
- Profit before tax (PBT) = EBITDA − Depreciation − Interest
- Net profit after tax (PAT) = PBT − Income tax
Reconciliation using the Toor dal example:
| Line Item | Amount (₹) |
|---|---|
| Revenue (dal + brokens + husk/chuni) | 89,020 |
| Less: Raw material (landed) | 86,500 |
| Less: Variable processing cost | 2,500 |
| Gross Profit | 20 |
| Less: Administrative overheads (illustrative) | – |
| EBITDA | ~20 |
| Less: Depreciation and Interest | Shown separately |
| Net Profit | Per project specifics |
Profit margins for dal millers typically range from ₹2 to ₹4 per kilogram of finished dal in practice, with typical profit standing at about 4 rupees per kg initially for well-run units. Net profit margins for mini dal mills range from 6% to 18% depending on procurement strategy, scale, product mix and finance cost. Some project analyses suggest profit can exceed 40% for a toor dal mill project under favourable assumptions, but such figures should be examined carefully for the underlying procurement price and recovery assumptions.
Margin vs Markup: If profit is ₹4/kg and selling price is ₹120/kg:
- Profit margin = 4 ÷ 120 × 100 = 3.33%
- Markup = 4 ÷ 116 × 100 = 3.45%
When quoting dal mill profit margin in India, always specify whether it is before or after interest and income-tax. In cost-sheet format, by-product credit may be shown as a reduction from cost, but in the profit and loss account, by-product proceeds are part of revenue and must not be netted off again.
Pulse-wise Differences in Dal Mill Profitability
Toor, Chana, Moong, Urad and Masoor each present different procurement prices, conditioning needs and recovery behaviours. Dal mill production cost per kg and margins vary accordingly.
| Pulse | Typical Recovery Range | Dehusking Difficulty | Extra Conditioning | Processing Cost | Market End-use |
|---|---|---|---|---|---|
| Toor | Medium to high | Medium | Oiling, tempering | Medium | Household, retail |
| Chana | High (78–82%) | Easier | Minimal | Lower | Household, besan, HORECA |
| Moong | Medium | Medium-difficult | Water tempering | Medium-high | Household, sprouts |
| Urad | Medium | Difficult | Extended resting | Higher | Household, papad, idli batter |
| Masoor | Medium-high | Easier | Minimal | Lower | Household, institutional |
Toor dal often has strong retail demand and can support branding and packaging, but procurement volatility can be significant. Chana dal links to a broader value chain; integration into a besan plant can improve overall utilisation and margins. Moong and Urad may require more careful conditioning and carry higher breakage risk, producing a lesser yield compared to Chana. A Toor Dal Mill Project Report or Chana Dal Manufacturing Plant Project Report can provide pulse-specific assumptions for financial projections.
No single recovery percentage or profit margin should be treated as universal. Every project needs its own feasibility and sensitivity analysis.
Own Procurement vs Job-Work Dal Milling
| Factor | Own Procurement & Milling | Job-Work Milling |
|---|---|---|
| Raw material ownership | Mill bears cost and risk | Customer supplies pulses |
| Revenue basis | Sale of dal and by-products | Per kg milling charges |
| Working capital requirement | High (raw pulse inventory) | Much lower |
| Commodity price exposure | Full exposure | Minimal |
| Recovery responsibility | Mill’s responsibility | Often shared/customer’s |
| Profit drivers | Spread between raw and finished prices | Processing charge vs cost control |
| Suitability | Medium to large dal mill plant | Mini dal mill, rural areas |
A job-work mill charging ₹4/kg on raw input with variable costs of ₹2.50/kg and allocated fixed costs of ₹0.80/kg retains about ₹0.70/kg as margin. This is not equivalent to integrated manufacturing profit, where the spread between raw and finished prices can be ₹2–4/kg on main dal.
Integrated procurement can provide higher absolute monthly profit but involves greater volatility and requires more sophisticated raw material sourcing and working capital management. Small mill owners operating in rural areas with strong job-work demand and low fixed costs can build a stable business on processing alone. Promoters should evaluate both models in their business plan and solid project report, as banks assess risk differently depending on the chosen model.
Capacity Utilisation, Fixed Cost per Kg and Break-even
Per-kg dal mill production cost is highly sensitive to annual throughput because fixed costs-salaries, depreciation, minimum power demand charges-are spread over processed quantity. Fixed costs become more economical as production volume increases in any dal mill operation.
Illustrative fixed cost per kg at different utilisation levels (annual fixed costs assumed ₹6,00,000):
| Capacity Utilisation | Finished Dal Output (tonnes/year) | Fixed Cost per kg (₹) |
|---|---|---|
| 40% | 420 | 1.43 |
| 60% | 630 | 0.95 |
| 80% | 840 | 0.71 |
Break-even formula: Break-even volume (kg of main dal per year) = Fixed costs per year ÷ Contribution per kg of main dal
If fixed costs are ₹6,00,000/year and contribution per kg of main dal is ₹5.00, break-even = 1,20,000 kg of finished dal per year.
The “unit” in break-even must be declared explicitly. If by-product revenue is treated as reducing variable cost, the same logic should carry into break-even calculations. A mini dal mill typically costs less than fully automated mills, and initial investment for a toor dal mill is approximately Rs.8,25,000, but dal mill plant owners should not assume 80–90% utilisation in year one. Realistic ramp-up from 35–40% to 70–80% over two to three years is more defensible in financial projections and CMA data.
Sensitivity Analysis: Impact of Key Variables on Dal Mill Profit
Dal mill cost and profit analysis is incomplete without checking how sensitive profitability is to small changes in prices, recoveries and volumes. Profitability depends on raw material supply and market prices, and even minor shifts can materially affect outcomes.
Sensitivity Table (base: 1,000 kg raw Toor, earlier assumptions):
| Scenario | Change | Impact on Profit per 1,000 kg Raw |
|---|---|---|
| Base case | – | ₹20 profit |
| Raw price +₹5/kg | +₹5,000 cost | ₹5,000 loss |
| Dal selling price −₹5/kg | −₹3,500 revenue | ₹3,480 loss |
| Recovery drops 70%→69% | 10 kg less main dal, 10 kg more husk | ~₹1,060 less revenue |
| Power cost +20% | +₹180 processing cost | ₹180 less profit |
| Utilisation down (higher fixed cost/kg) | +₹0.25/kg fixed cost allocation | ~₹175 less profit |
When recovery changes, mass balance must remain at 1,000 kg. A “1 percentage point” reduction (70% to 69%) differs from a “1% relative reduction” (70% to 69.3%). This article uses absolute percentage points.
Raw material price has the strongest impact on per-kg net production cost and overall dal mill revenue and profitability-far exceeding the effect of power cost or packaging cost changes.
Working Capital, Interest Cost and Cash Flow in Dal Milling
Even a technically profitable dal mill can face cash flow stress if working capital, inventory and repayment schedules are not planned properly. A dal mill requires a detailed business plan covering these dimensions. Total working capital requirement for a toor dal mill is approximately Rs.15,50,000.
Seasonality of raw pulse procurement is critical. Farmers grow pulses with harvest concentrated in specific months; mills benefit from building stock after harvest when prices are lower. This creates a need for seasonal inventory planning. The typical working capital cycle covers raw material days (30–90 days of stock), processing time (1–3 days), finished goods holding (7–15 days) and debtor collection (15–45 days). Supplier credit from traders reduces immediate cash outflow, while bank-funded cash credit or overdraft limits provide working capital support.
Interest costs arise from term loans for dal mill plant and machinery, and working capital limits used for inventory and receivables. These appear below EBITDA, affecting net profit but not operating margin.
DSCR for dal mill projects: DSCR = Cash accruals available for debt servicing ÷ Total debt servicing obligation (principal + interest)
Banks assess DSCR separately from simple profit margin when appraising a bank loan proposal. Principal repayment is not an expense in the P&L but a cash outflow, and promoters must ensure cash flow sufficiency-not only book profits-when planning expansions or a mini dal mill upgrade. NABARD offer loans and other institutional finance options, but the project report must demonstrate adequate repayment capacity.
Practical Ways to Improve Dal Mill Profitability
While raw pulse prices are largely market-driven, mill owners can actively improve yields, costs and realisations through systematic management and efficient operations.
- Procurement discipline – grading and moisture checks at purchase to avoid overpaying for water and impurities; buy directly from farmers where possible to reduce intermediary cost. Own crops or direct sourcing from growers who grow dal can reduce landed cost.
- Batch-wise yield tracking – identify which pulse lots, suppliers or process conditions give poor or excellent results.
- Moisture control – proper conditioning, dehusking and splitting balances dal recovery against fuel and drying costs.
- Preventive maintenance – reduce downtime and breakage losses; right machinery selection matters. Fully automatic vs semi-automatic mills have different maintenance profiles.
- Energy management – load scheduling, appropriate motor sizing and monitoring power consumption can reduce one of the top three variable costs. In the Indore dal mill cluster, electricity rates average ₹7.50/kWh and account for 6–8% of final product cost.
- Product mix optimisation – deciding how much to sell directly in bulk versus retail packs, and whether to invest in branded dal packaging, improves sales potential and margins.
- By-product utilisation – develop regular buyers for husk and chuni; even small improvements in by-product quality and realisation help the profit forecast.
- Food safety training and compliance – obtaining FSSAI registration and meeting quality standards opens access to institutional and branded channels that command higher prices.
Periodically review cost sheets and segment-wise margins rather than relying on rough thumb rules for dal mill profit margin in India.
Common Calculation & Planning Mistakes in Dal Mill Costing
Many dal mill DPRs and applications for bank loans are weakened by avoidable mistakes in cost per kg and margin calculations.
- Mixing denominators – comparing cost per kg of raw pulses with price per kg of finished dal without adjusting for recovery is the most common error.
- Ignoring processing loss – not accounting for moisture variation and fine dust losses when preparing material balance.
- Double-counting by-products – showing by-product value as negative cost in the cost sheet and again as separate revenue in financial projections.
- Treating loan principal as an expense – while also charging full depreciation; this understates profitability in projections.
- Omitting interest or depreciation – without disclosure; a financial overview that excludes these without stating so misleads readers and bankers.
- Assuming full capacity from year one – without considering ramp-up, market development and the business journey required to establish distribution.
- Using outdated prices – current wholesale Toor raw prices average approximately ₹87.2/kg across major mandis; using prices from two years ago distorts the entire analysis. Mandi tax differences across states also affect cost-for example, MP millers report approximately ₹1/kg higher cost than in adjacent states due to higher mandi fees.
- Ignoring required licences – licenses required include trade license, FSSAI registration and pollution control board clearance; omitting compliance costs underestimates the manufacturing setup expense.
Generic industry averages for recovery or profit margin must be handled cautiously. Project-specific trials, pilot runs or reference from similar dal mill units are better guides for assumptions than a finline project report or a document outlines template copied without customisation.
Professional DPR, CMA Data & Project Finance Support for Dal Mills
Project Report Bank is led by CA Manish Gugliya, a practising Chartered Accountant with over 20 years of experience in project reports, CMA data and project finance advisory for manufacturing and agro-processing units including pulse processing facilities across India.
A customised Detailed Project Report for a dal mill or mini dal mill covers:
- Detailed project cost including dal mill plant and machinery, civil work, utilities and production capacity planning
- Means of finance, promoter contribution and fixed capital structure
- Dal mill production cost per kg with pulse-wise yield assumptions and sensitivity analysis
- Realistic capacity utilisation ramp-up and working capital assessment
- Production output projections linked to operational assumptions, not arbitrary annual figures
For bank finance, Project Report Bank provides CMA data preparation for bank loans including term loan and working capital projections, DSCR, break-even, cash flow and profitability analysis under different raw material and selling price scenarios. A professional report and structured bank loan proposal assistance is provided without promising or guaranteeing sanction-Union Bank, SBI and other institutions accept reports that demonstrate defensible financial logic, not inflated projections.
Government support through subsidies of 25% to 33% is available for dal mill projects under schemes such as PM FME, and these can cover a significant portion of machinery cost, reducing small investment burden for new entrepreneurs. Government schemes can also assist with basic training and food safety training requirements.
Entrepreneurs seeking financial projections and financial modelling for dal mill expansion, diversification into besan or additional pulses, or investor-ready DPRs can reach out for a WhatsApp-first enquiry. All analysis is customised to the specific project; responsible advisory does not provide “certified” projections but professionally prepared estimates grounded in current market data and realistic assumptions.
Conclusion: Using Dal Mill Production Cost per Kg for Better Decisions
Understanding dal mill production cost per kg, dal mill processing cost per kg and realistic recovery levels helps promoters judge whether their planned dal mill unit is commercially viable. The distinction between gross production cost and net production cost after by-product credit is essential-the former overstates per-kg burden while the latter reflects the true economics of pulse produced and sold.
Dal mill profit margin in India depends on disciplined procurement, controlled processing cost, product quality and efficient working capital management-not only on plant size or production capacity. Tiny scale units and large commercial operations alike need a proper plan grounded in their specific cost structure.
The worked example and sensitivity cases in this article serve educational purposes and should not be applied blindly. Each project-whether a small scale rural operation or a dal mill thinking of scaling to other countries-should be evaluated through its own DPR and financial model. For understanding capital investment structure, refer to Dal Mill Project Cost & Means of Finance. For deeper financing insights, see Dal Mill Financial Projections, CMA Data, Working Capital & DSCR.
Seek professional advice before committing capital. A solid project report built on defensible assumptions serves the mill business far better than optimistic projections that collapse under scrutiny.
Author: CA Manish Gugliya
Frequently Asked Questions on Dal Mill Cost per Kg & Profitability
The following FAQs address common practical questions for quick reference by entrepreneurs and existing dal mill owners, especially those operating or planning a mini dal mill.
What is a realistic dal mill production cost per kg for a small unit in India?
There is no single standard figure. It depends on pulse type, raw material cost, plant capacity, recovery, power tariff and skilled labor rates in the specific state. To compute your own production cost per kg: calculate landed raw pulse cost per kg, add variable processing cost per kg of input (operational conversion cost typically falls between ₹1.00 to ₹2.00 per kilogram), allocate fixed factory cost over expected throughput, and then deduct by-product revenue to obtain net production cost per kg of dal. Small mill owners should maintain a simple spreadsheet to track these figures month by month rather than relying on dal mill dream figures heard from others. For context, a rising population ensures growing demand, and daily expenses on pulse consumption remain consistent across seasons.
How much dal mill profit margin can I expect on an integrated unit?
A typical mini dal mill has a profit margin of 6–18%, though this band is wide because it depends on product mix, business model, branding, scale and finance cost. Profit margins for dal millers typically range from ₹2 to ₹4 per kilogram of finished dal. Caution against believing claims like “always 20%”-test multiple scenarios through sensitivity analysis before finalising a project. Banks and investors look for reasonable but sustainable margins supported by defensible assumptions in the DPR, not very high projected returns. Separate areas of revenue (main dal vs by-products) must each be evaluated for their contribution.
How should I price job-work milling charges per kg?
Job-work charges must at least cover variable costs (power, labour, consumables) per kg of raw pulses processed, a share of fixed costs, plus a reasonable margin for risk and capital employed. Start with an internal calculation of per-kg variable and fixed cost using your basic dal mill machines and power requirement data, then add a targeted margin. Local market competition and service quality-cleanliness, timely delivery, yield performance-ultimately influence achievable job-work rates. A mill with inferior quality product or poor recovery will struggle to retain job-work customers regardless of pricing.
How do by-products like husk and chuni affect my cost and profit?
By-products reduce effective net production cost per kg of dal by providing additional revenue, especially where there is steady demand from cattle feed or biomass users. In cost-sheet format, by-product value can be shown as a credit against manufacturing cost, but in profit and loss accounts it should appear as separate revenue to avoid double counting. Arrange regular buyers and track by-product prices so that your financial projections use realistic realisation assumptions. Water cost for conditioning and the volume of milled dal produced both influence by-product quantity and quality.
What minimum capacity makes sense for a new dal mill project?
Minimum viable capacity depends on target market, available raw material and whether the plant focuses on local job-work, own brand retail packs or bulk B2B supply. Very small mini dal mills-for example processing about 300 kg per hour-can be viable in areas with strong local job-work demand and low fixed costs. Larger 1–2 TPH plants need wider market reach and more professional management. Capacity choice should be finalised only after a structured business plan and DPR estimate fixed assets, working capital, break-even and achievable utilisation. A small investment can work well if fixed capital is proportionate to realistic production output. Subsidies of 25% to 33% are available for dal mill projects to reduce the initial burden.