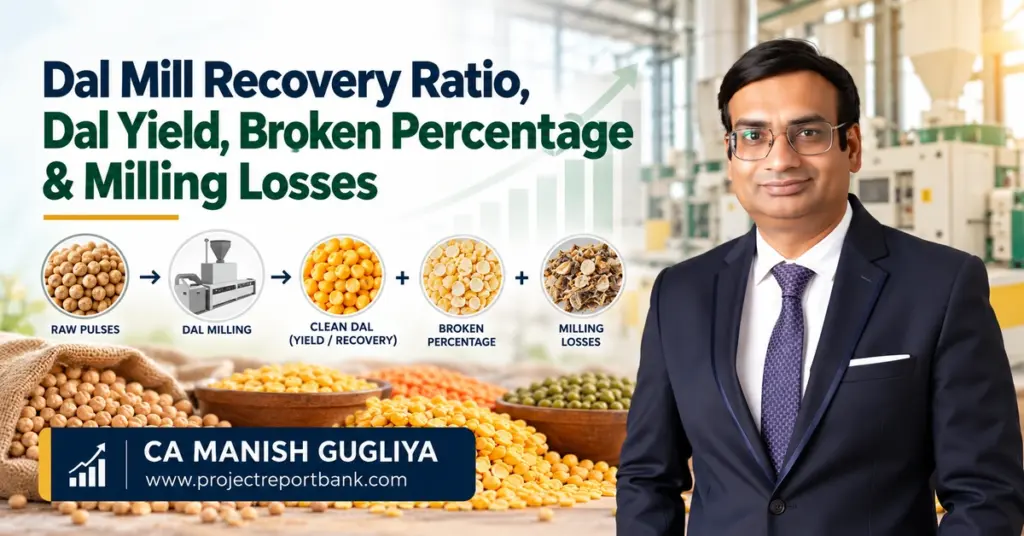
Every dal mill project ultimately comes down to a single technical question: from a given quantity of raw pulses, how much saleable dal will the plant actually produce? The dal mill recovery percentage determines daily output, revenue potential and the financial viability of the entire venture. This article explains what recovery ratio means in practice, provides pulse-wise yield comparisons, works through a detailed mass-balance example, and discusses how these assumptions should be handled in DPRs, CMA Data and project finance analysis.
Key Takeaways
The dal mill recovery percentage is the single most important technical parameter determining how many kilograms of saleable dal a plant produces from every 100 kg of raw pulses. It directly affects turnover, operating margins, working capital cycles and a project’s ability to service debt. Even a small change in recovery can significantly alter cash flow projections.
- Recovery must always be calculated on a consistent input basis. Whether you use raw pulse weight (as purchased) or cleaned pulse weight (entering milling) changes the percentage substantially. Broken dal and by-products such as husk and powder still generate revenue and must be accounted for separately. True process losses – dust, spillage, unaccounted weight – should ideally remain within 1–3% of input under disciplined operations.
- Indicative recovery ranges under good commercial conditions vary by pulse: pigeon pea (toor) typically yields 63–75% finished dal depending on pretreatment, moong around 65–75%, chana around 78–82%, masoor in the mid-70s, and urad somewhat lower due to grain softness. Actual yields depend heavily on grain quality, moisture, variety and technology.
- For a 10 TPD plant operating 300 days per year, a mere 2 percentage point improvement in finished dal recovery adds approximately 60 tonnes of premium dal annually. At ₹100/kg, that translates to roughly ₹60 lakh in additional revenue before accounting for incremental costs.
- The sections below break down definitions, formulas, pulse-wise yields, broken percentages, milling losses, profitability impact, and how these assumptions should be structured in Detailed Project Reports and CMA Data.
Why Dal Mill Recovery Percentage Matters
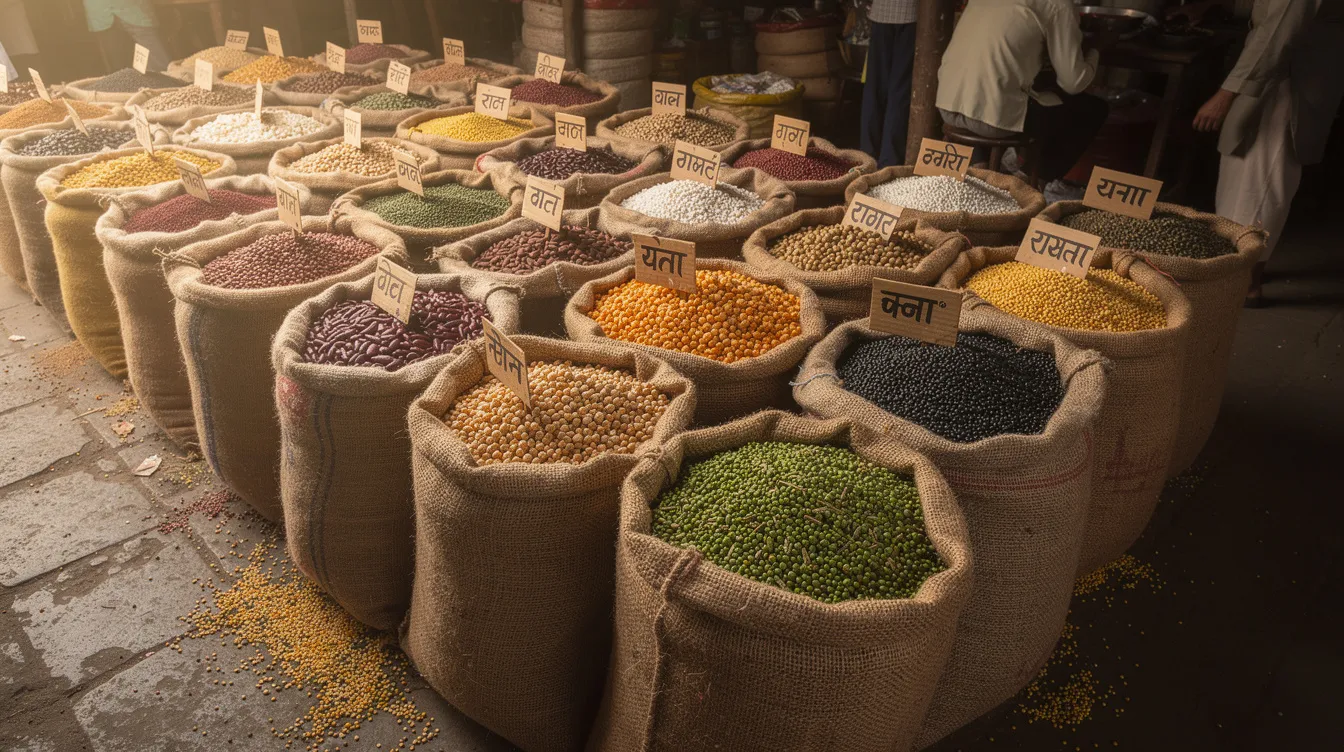
One of the first questions entrepreneurs ask when planning a dal mill is straightforward: “From 100 kg of raw pigeon pea or chana, how much finished dal will I get?” The answer to this question shapes every financial decision that follows – from raw material procurement budgets to projected sales, contribution margins and loan repayment capacity.
The dal mill recovery percentage represents the relationship between the weight of raw pulses entering the plant and the weight of saleable output – whole dal, split dal, broken dal, husk and powder. It is not merely a technical metric observed on the factory floor. It is the foundation on which production schedules, inventory levels and cash flow projections are built.
Small differences in recovery have a disproportionate financial effect at scale. Consider a plant processing 8–10 tonnes per day for 250–300 working days annually. A difference of just 3 percentage points – say 73% versus 70% – means roughly 70–90 additional tonnes of premium dal per year. This is why recovery assumptions must be carefully assessed while preparing bankable DPRs and CMA Data.
Physical milling efficiency is only one side of the equation. Actual commercial profitability also depends on selling prices for finished dal versus broken dal, by-product realisation, operating costs, power consumption and the finance structure of the project. Variability in the initial quality of raw pulses affects the milling recovery percentage, and this variability must be factored into financial projections rather than ignored.
Research work by institutions studying mini dal mill performance and pre-milling treatments on pigeon pea has consistently demonstrated that moisture content, feed rate and pretreatment methods significantly influence dal yield. These are not theoretical observations – they translate directly into revenue differences for operating plants.
What Is Dal Mill Recovery Ratio?
Dal mill recovery ratio is the proportion of raw pulse input that is converted into usable, saleable products – primarily whole and split dal – expressed as a percentage of the chosen input basis.
The output from any pulse processing plant consists of several distinct streams:
- Whole dal recovery – intact dehusked grains retaining their full cotyledon shape.
- Split dal recovery – cotyledons cleanly split into halves, which is the most common finished product form.
- Broken dal – smaller fragments still suitable for human consumption but sold at a discount.
- Husk and powder – removed seed coat and fine material, typically sold as cattle feed or fuel.
- Unsaleable process losses – dust, spillage, measurement discrepancies and handling waste.
The standard formula is:
Dal Recovery (%) = (Weight of Recovered Dal ÷ Input Weight Basis) × 100
“Recovered Dal” may mean only whole and split dal, or it may include broken dal. Entrepreneurs must define this clearly when comparing figures across suppliers, machinery brochures or technical literature.
The choice of input basis matters significantly:
- Option 1: Raw pulse as purchased, including field impurities and stones.
- Option 2: Cleaned and graded pulse entering the dehusking stage.
Consider a simple example. A plant receives 1,000 kg of raw toor dal. After cleaning, 950 kg of graded pulses enter milling, producing 690 kg of whole and split dal. On a raw input basis, recovery is 69%. On a cleaned input basis, recovery is 72.6%. The same plant, the same output – but two different recovery percentages depending on the denominator. Mixing these bases leads to confusion and unreliable comparisons.
The theoretical maximum recovery for pulses is about 87% to 89%, constrained by the physical removal of seed coat, germ and unavoidable process inefficiencies. In practice, dal recovery in traditional mills typically ranges from 65 to 73 percent, well below this theoretical ceiling. Abrasive roller mills are common for commercial dal milling and represent the technology basis for most published recovery figures.
Dal Yield Percentage in India – Pulse-Wise Comparison
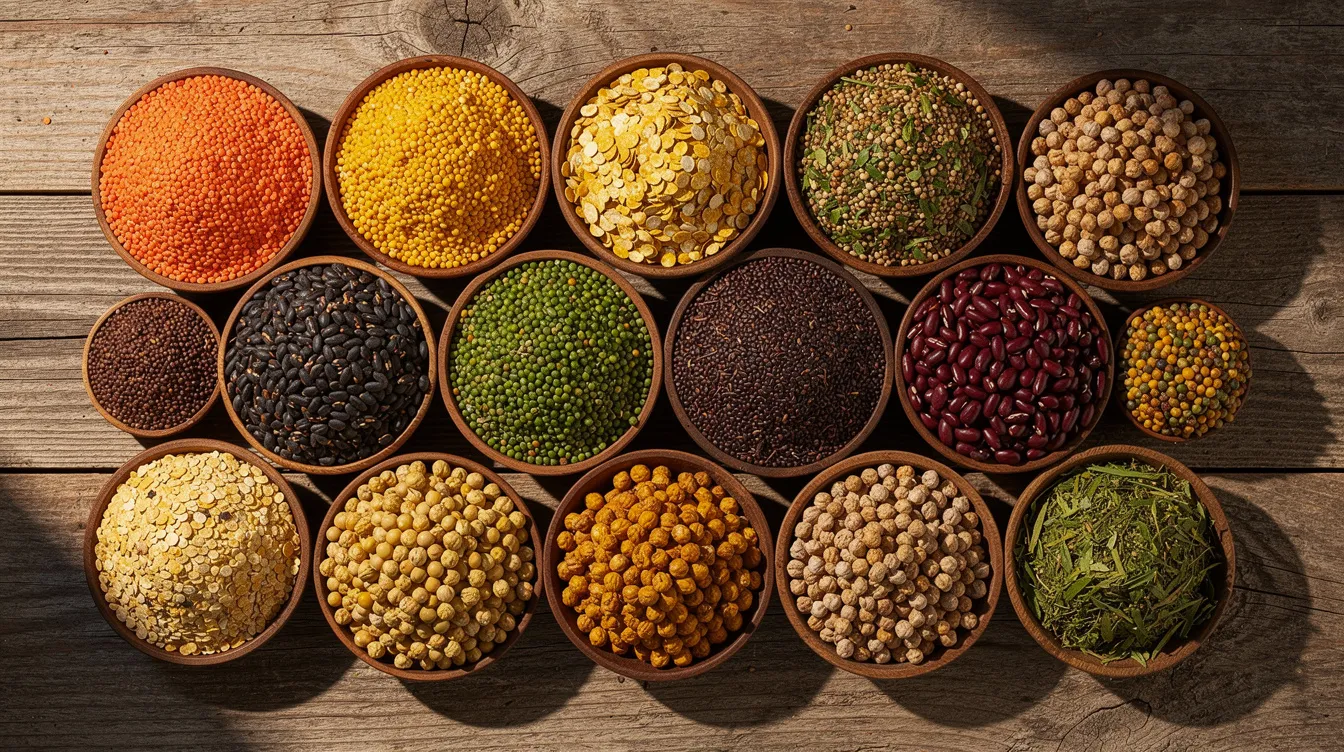
Different pulses behave differently during milling. Husk adhesion, grain hardness, size, shape and moisture response vary across toor, moong, urad, chana and masoor. Therefore, dal yield percentages are not identical across pulse types.
The ranges below are indicative, compiled from Indian agricultural engineering research, ICAR institutes, state agricultural universities and practical field observations. They may vary with grain variety, pre-milling treatment and machine type. Different pulse varieties have distinct recovery rates influenced by their physical properties, and pulses with a tightly bound husk yield lower recovery rates compared to those with loosely attached seed coats.
| Pulse | Whole + Split Dal Recovery (Cleaned Basis) | Broken Dal % | Husk & Powder/By-Products % | Processing Loss % |
|---|---|---|---|---|
| Toor / Arhar (Pigeon Pea) | 63–75% | 2–5% | 12–15% | 5–8% |
| Moong (Green Gram) | 65–75% | 7–10% | 12–15% | 5–10% |
| Urad (Black Gram) | 62–72% | 5–10% | 12–15% | 5–8% |
| Chana (Chickpea) | 78–82% | 2–6% | ~10% | 4–7% |
| Masoor (Lentils) | 72–78% | 3–6% | 10–12% | 4–6% |
For pigeon pea, conventional milling methods yield 63.19 to 66.27 percent recovery under standard conditions. Pre-milling treatments such as soyoil-water treatment yield 67.61 to 70.39 percent recovery, while more advanced conditioning protocols can improve dal recovery to 71.39 to 73.85 percent in experimental settings. A CFTRI study on UPAS 120 pigeonpea reported 71.04% dal recovery for untreated grain and 75.21% with water treatment, demonstrating how proper conditioning can improve recovery rates significantly. For detailed financial planning of pigeon pea processing, refer to the toor dal mill project report and DPR.
For moong and urad, these softer pulses are prone to breakage if over-dried or mishandled. A study on mungbean genotypes reported whole dal percentages ranging from 64.29% to 76.92% and broken dal from 7.65% to 11.91%, with processing losses between 4.96% and 14.15% depending on genotype. Entrepreneurs planning moong dal projects can review the moong dal processing plant project report for detailed assumptions.
Chana dal milling can achieve relatively good recoveries with proper conditioning because chickpeas have lower husk adhesion. The chana dal manufacturing plant project report provides detailed production and financial analysis. Masoor has a relatively thin husk and may dehusk more easily, often resulting in good dal recovery but is sensitive to over-polishing, which can reduce the share of premium product and affect shelf life.
Key points to remember:
- Laboratory-scale yield results often exceed commercial plant performance by 5–10 percentage points.
- Trial runs with local grain varieties are essential before finalising recovery assumptions in a DPR.
- For plants processing multiple pulse types, an integrated multi-pulse processing plant report may be more appropriate than pulse-specific planning.
Dal Mill Recovery Calculation – Practical 1,000 kg Example
Entrepreneurs and bankers often understand dal mill recovery percentage best through a concrete mass-balance example. The following numbers are illustrative assumptions, not guaranteed industry standards.
Scenario: 1,000 kg of raw toor (pigeon pea), purchased at approximately 12–13% moisture, processed through a small to medium dal mill with basic conditioning.
| Stream | Quantity (kg) | % of Raw Input |
|---|---|---|
| Raw pulses received | 1,000 | 100.0% |
| Cleaning rejects (stones, dust, chaff, foreign matter) | 50 | 5.0% |
| Cleaned pulses entering milling | 950 | 95.0% |
| Finished whole + split dal | 660 | 66.0% |
| Broken dal | 50 | 5.0% |
| Husk & powder (by-products) | 170 | 17.0% |
| Moisture adjustment & unaccounted process loss | 70 | 7.0% |
| Total | 1,000 | 100.0% |
From these figures:
- Finished dal recovery on raw input basis: 660 ÷ 1,000 = 66.0%
- Finished dal recovery on cleaned pulse basis: 660 ÷ 950 = 69.5%
- Total commercial output (dal + broken + by-products): (660 + 50 + 170) ÷ 1,000 = 88.0%
- Overall process loss: 70 ÷ 1,000 = 7.0%
From a project finance perspective, both dal-only recovery and total commercial recovery matter. Dal-only recovery drives the main revenue stream. By-product recovery provides additional income that can improve contribution margins, especially when dal market prices are under pressure. For understanding the complete process flow, refer to the dal milling process and flow chart.
Broken Dal Percentage – Causes and Financial Impact
Broken dal refers to fragments smaller than standard whole or split size but still suitable for human consumption. It is consumed by institutional buyers, snack companies and value addition processors, typically at a discounted price compared to premium finished dal.
The key technical causes of higher broken dal percentage include:
- A higher moisture content in grain can affect dehusking efficiency, leading to incomplete husk removal and subsequent re-milling that causes breakage.
- Excessive pressure or speed settings on emery or abrasive rollers.
- Multi-pass milling can increase powder loss during dal processing and also raises breakage.
- Over-polishing and excessive residence time inside machines.
- Inadequate grading and separation, causing repeated handling of already-processed grain.
Broken percentage is also influenced by pulse type. Softer grains such as moong and urad can shatter more easily, while harder grains like chickpeas may better tolerate certain roller pressures. The protein content and structural integrity of the cotyledon influence how well grain withstands mechanical stress.
Financial illustration: Assume finished premium dal sells at ₹100/kg, broken dal at ₹80/kg, and by-products at ₹10/kg. For a 10 TPD plant (cleaned basis):
| Scenario | Finished Dal | Broken Dal | Weighted Avg Price (Dal + Broken) |
|---|---|---|---|
| 5% broken | 6,650 kg/day | 475 kg/day | ₹98.7/kg |
| 10% broken | 6,175 kg/day | 950 kg/day | ₹97.3/kg |
The ₹1.4/kg difference in weighted average price, applied over 300 working days, translates to roughly ₹30 lakh less annual revenue. While broken dal is not a total loss, excessive breakage reduces the share of premium product and indicates suboptimal process control. For detailed machinery considerations, review the dal mill machinery, equipment and cost guide.
Dal Milling Losses – Types and Reasons
Milling losses do not mean everything is wasted. They include both recoverable low-value materials and genuinely unrecoverable losses, and must be separated carefully. Losses during dal milling typically convert into by-products like husk, powder and broken grains, many of which have some market value.
Main categories of dal mill losses:
- Cleaning losses: Stones, dust, chaff, shrivelled grains and undersized material – typically 2–5% of raw input.
- Dehusking and polishing losses: Fine powder, micro-fragments and over-abraded cotyledon surfaces.
- Handling and transfer losses: Spillage at conveyors, bagging points and storage areas.
- Moisture-related weight differences: Weight lost during drying or gained during tempering.
- Unaccounted process losses: Measurement inaccuracies and sampling losses.
Saleable by-products include husk (used for cattle feed or fuel, typically ₹8–12/kg) and coarse powder (used for animal feed). Unsaleable waste – fine dust, spillage – should ideally remain below 1–3% of input in a well-managed plant.
Common reasons for excessive losses include poorly designed aspiration and dust collection systems, leaky conveyors, overly aggressive polishing settings, and inadequate maintenance leading to misaligned rollers and worn-out sieves.
Actionable steps to reduce avoidable losses:
- Routine preventive maintenance and leakage checks on all equipment.
- Systematic moisture and weight recording at each process stage.
- Periodic mass-balance audits comparing input versus output across a full production shift.
Fully Automatic vs Semi-Automatic Dal Mill – Recovery Efficiency
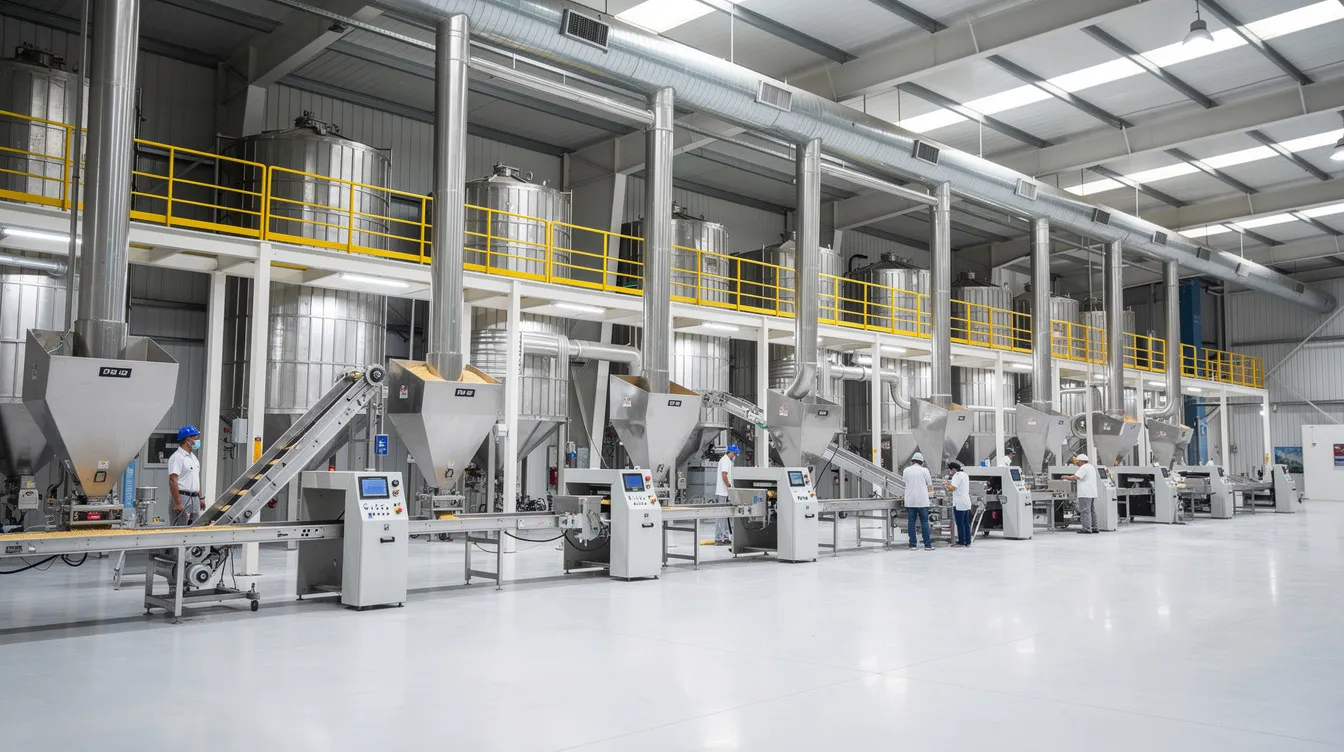
Semi-automatic dal mills involve more manual handling between stages with individual stand-alone machines, while fully automatic dal mills use integrated, continuous lines with automated feeding, grading, dehusking, separation and packaging.
Recovery consistency: Automatic plants often achieve more stable recovery because of uniform feed rate and controlled settings. The use of modern milling technology can lead to higher recovery rates than traditional mills. According to MNB Research analysis, average Indian dal mills recover 71–73% while best-in-class plants with modern equipment and AI-based process control reach 79–82%. Semi-automatic plants show greater variation depending on operator skill. Mini dal mills can achieve a maximum efficiency of 76.86 kg/h, which sets a practical throughput benchmark for smaller operations.
Labour and process control: Automatic systems rely on sensors and PLC logic but still need trained supervisors. Operator skill and machine calibration are crucial for maximising recovery efficiencies regardless of automation level. Dal recovery increases with higher feed rates in milling, but only when the feed rate is matched to machine capacity.
Investment trade-off: A 1.5–2% improvement in saleable dal recovery at a 10–20 TPD scale generates incremental annual revenue of ₹45–120 lakh, which can often service the additional term loan EMI required for automatic machinery. However, technology selection should be based on a combined assessment of expected recovery, throughput, local labour availability, power tariffs and long-term maintenance support. For a detailed machinery-level comparison, refer to the fully automatic vs semi-automatic dal mill article.
How Dal Recovery Affects Dal Mill Profitability
In financial modelling for a dal mill, the two most sensitive technical assumptions are the dal mill recovery percentage and average selling prices for dal and by-products.
Hypothetical 10 TPD plant: 10 tonnes per day of raw pulses, 300 working days, raw pulse purchase at ₹70/kg, finished dal selling at ₹100/kg, broken dal at ₹80/kg, by-products at ₹10/kg. These are illustrative numbers, not market forecasts.
| Parameter | Conservative (65%) | Base Case (70%) | Improved (75%) |
|---|---|---|---|
| Finished dal (tonnes/day) | 6.50 | 7.00 | 7.50 |
| Broken dal (tonnes/day) | 0.50 | 0.40 | 0.30 |
| By-products (tonnes/day) | 1.50 | 1.40 | 1.30 |
| Daily dal + broken revenue | ₹6,90,000 | ₹7,32,000 | ₹7,74,000 |
| Annual revenue (300 days) | ₹20.70 Cr | ₹21.96 Cr | ₹23.22 Cr |
| Annual raw material cost | ₹21.00 Cr | ₹21.00 Cr | ₹21.00 Cr |
A 5 percentage point swing in dal recovery changes annual revenue by approximately ₹2.5 crore. After adding by-product income and deducting operating costs, the effect on EBITDA and DSCR is substantial.
During term loan appraisal, banks often stress-test projections with slightly lower recovery assumptions. Using inflated recovery percentages in DPRs can backfire when lenders apply their own conservative adjustments. For systematic dal mill capacity planning, production assumptions must be defensible.
Dal Mill Recovery Ratio in DPR and CMA Data
Recovery assumptions flow into every section of a Detailed Project Report, bank loan proposal and CMA Data. They influence:
- Production capacity utilisation schedules and annual output estimates.
- Raw material procurement budgets and seasonal stocking strategy.
- Finished goods inventory levels and warehouse space requirements.
- Sales projections for both dal and by-products.
Key financial metrics affected by recovery percentage include gross profit margin, cash flow available for debt servicing, DSCR, break-even volume and payback period.
Lenders and appraisal agencies typically compare proposed yields with benchmarks from other projects, technical literature and manufacturer guarantees. They check consistency between capacity, recovery, power consumption and labour deployment, and seek clarifications where assumed yields appear significantly higher than realistic ranges.
Promoters should document the basis and source of recovery assumptions – whether from ICAR publications, supplier test reports or trial production data – and show separate treatment of whole dal, split dal, broken dal and by-product realisation. At Project Report Bank, under the guidance of CA Manish Gugliya, custom DPRs and CMA Data are prepared with recovery ratios, wastage allowance and sensitivity scenarios aligned with the specific milling process, machinery choice and raw material conditions of the proposed unit. For bank finance DPR and loan proposal assistance, realistic recovery assumptions are non-negotiable.
How to Improve Dal Recovery Percentage
There is no single magic setting for high recovery. Performance depends on a chain of decisions from raw pulse purchase to final packing.
Raw material selection: Choose well-matured, uniform-size pulses with low field damage. Grading at the procurement stage helps control breakage downstream. The effect of grain quality on milling outcomes cannot be overstated – farmers supplying clean, well-dried grain contribute directly to better yields.
Pre-milling treatments: Controlled soaking, tempering and oil-water application improve husk loosening. Pre-milling treatments can improve dal recovery to 71.39 percent or higher depending on the protocol and pulse type, as demonstrated in agricultural engineering research on pigeon pea.
Process conditioning: Target grain moisture in the range of 10–12% for most pulses, with exact figures fine-tuned per grain and equipment. Allow sufficient resting time after conditioning for uniform moisture distribution.
Machine operation: Optimise roller clearance, speed and feed rate based on pulse type. Abrasive roller mills are common in commercial dal milling and require regular calibration to maintain efficiency.
Operator checklist for daily recovery monitoring:
- Record input weight, output weights (whole/split, broken, husk, waste) per shift.
- Note moisture content at key process points.
- Track broken percentage and loss percentage daily; compare with historical trends.
- Flag and investigate any unexplained drop in recovery beyond a set threshold.
Systematic data recording not only helps improve recovery but also builds a credible performance history useful during loan enhancement, expansion or investor discussions.
Common Mistakes in Dal Yield and Recovery Estimation
Many first-time dal mill promoters rely on rough verbal assurances from machinery suppliers or hearsay yields, which can lead to unrealistic DPRs and operational disappointment.
Technical estimation errors:
- Assuming the same dal mill recovery percentage for different pulses – using toor yields for moong or urad.
- Ignoring the difference between raw and cleaned pulses when defining the input basis.
- Treating broken dal as a complete loss instead of a lower-priced but saleable product.
Documentation mistakes:
- Copy-pasting yield figures from brochures without confirming the underlying process, pulse variety and moisture basis.
- Overestimating finished dal selling prices while underestimating by-product realisation in the market.
- Not disclosing cleaning loss and process wastage assumptions in bank proposals.
Financial modelling pitfalls:
- Using optimistic recovery without running sensitivity analysis for lower-yield scenarios.
- Ignoring the working capital impact of high broken percentages – slower-moving stock, different customer base.
- Failing to align capacity utilisation ramps with realistic learning curves. Government model DPRs sometimes assume 90% recovery, which is above what even modern systems achieve given that the theoretical maximum for pulses is 87–89%.
Promoters should cross-check supplier claims with independent research, conduct trial runs where possible, and seek professional support to structure assumptions in DPRs, particularly for medium and large-scale projects involving companies seeking term loan finance.
Frequently Asked Questions
The following questions address practical doubts that entrepreneurs frequently raise about dal mill recovery, adding clarity beyond the main discussion above.
What is a reasonable dal mill recovery percentage for a new commercial plant?
Reasonable recovery depends on the pulse being milled, grain quality, technology and operational control. Many commercial plants target total saleable dal (whole + split + broken) in the range of 68–82% on a cleaned input basis, varying by pulse type. New plants may initially operate at slightly lower effective recovery during the stabilisation period. Planning projections should reflect a ramp-up curve over the first 1–2 years rather than assuming full milling efficiency from day one.
How much dal can typically be produced from 100 kg of raw pulses?
After cleaning (removal of impurities), the effective milling input may fall to around 94–96 kg. From this cleaned quantity, a typical commercial mill might obtain 60–78 kg of whole and split dal depending on the pulse, 3–8 kg of broken dal, 10–15 kg of husk and powder, and a small balance as process loss. These values are indicative – serious promoters should base decisions on actual trial data for their targeted pulse and machinery.
Is higher dal recovery always better for profitability?
While higher recovery is generally positive, chasing maximum yield without considering product quality can be counterproductive. Over-polished or damaged dal may fetch lower prices or face quality complaints about safety and appearance. The optimal operating point balances acceptable recovery, desired product quality, reasonable energy costs and market-specific preferences for polished versus unpolished dal.
Can a dal mill process multiple pulses without affecting recovery?
A single plant can process multiple pulses – toor, moong, urad, chana, masoor – but each pulse requires different pretreatment conditions, adjusted machine settings and sieve configurations, and separate recovery benchmarks. Multi-pulse plants should keep pulse-wise recovery records and may benefit from a dedicated integrated multi-pulse processing DPR that accounts for these operational differences. Focusing on proper changeover procedures between pulse types is essential to maintaining consistent yields.
How frequently should a dal mill monitor and record recovery data?
Commercial plants should record recovery figures at least shift-wise or day-wise, noting input weight by batch, output weights of each category and moisture content. Monthly trending of these records helps identify gradual deterioration – for example, due to worn-out rollers or changes in raw pulse quality – and supports more reliable financial planning. This observed data also strengthens the plant’s credibility during bank reporting and any future financial projections and modelling exercises.
Realistic dal recovery estimates help entrepreneurs plan production, control milling losses and prepare defensible project feasibility assessments. The objective is not to present the most optimistic yield figure in a DPR, but to prepare projections that can withstand scrutiny from lenders, investors and the market itself.
For customised DPR preparation, CMA Data, financial modelling and project feasibility advisory for dal mill and pulse processing projects across India, reach out to CA Manish Gugliya, FCA, DISA (ICAI) at Project Report Bank via WhatsApp.