Setting up a dairy beverage manufacturing plant is a significant capital commitment. But installing machinery and commissioning a processing line is only one part of the equation. The long-term viability of any dairy beverage project depends on how effectively the manufacturer converts installed capacity into actual, profitable sales through the right combination of products, pricing, geography, distribution channels and customer segments.
In my experience preparing project reports, DPRs and financial projections for dairy processing ventures across India, the single most common weakness I encounter is an unrealistic revenue model. Promoters often project turnover by simply multiplying installed capacity by MRP. The result looks impressive on paper but collapses when tested against real-world trade margins, logistics costs, seasonal demand swings and the slow pace of distributor and retailer onboarding. This article is written to help promoters, investors and consultants understand what a commercially sound dairy beverage revenue model actually looks like, and how market strategy decisions should feed directly into project feasibility and bank finance documentation.
Key Takeaways
- In the dairy beverage business, plant capacity alone does not guarantee success. Revenue viability depends on a realistic dairy beverage revenue model that accounts for product mix, net realisation after trade margins, freight, schemes and returns, not just theoretical MRP-based turnover.
- Promoters must plan product mix, pricing, distribution channels, geography and working capital together when preparing a dairy beverage project report or DPR. These elements are deeply interconnected: a change in channel mix alters working capital needs, a change in geography alters logistics cost, and a change in product mix alters contribution margins.
- Realistic net sales realisation is more important than headline MRP for any dairy beverage manufacturing plant financial model. Distributor margins, retailer margins, promotional schemes, freight, cold chain costs and product expiry can collectively reduce ex-factory realisation by 25–40% below MRP depending on the product and channel.
- Different sales channels, including general trade, modern trade, HoReCa, institutional, private label and e-commerce, deliver different margins, risks and credit cycles. A robust dairy beverage plant financial model should assign separate assumptions to each channel rather than averaging everything.
- This article is written from the practical perspective of CA Manish Gugliya, a practising Chartered Accountant and project finance consultant who assists entrepreneurs in preparing customised project reports, DPRs, CMA data and bank finance documents for dairy beverage and food processing projects in India.
Understanding the Dairy Beverage Revenue Model
A dairy beverage revenue model, in the Indian manufacturing context, is the structured framework through which a plant converts its installed processing and filling capacity into projected revenue. It is not a single number. It is a layered set of assumptions covering how much you can actually sell, at what price you actually receive money, through which channels, and at what cost of serving those channels.
The dairy beverage market is growing due to health-conscious consumer trends, rising disposable income and expanding middle-class populations in emerging markets like India. India produces approximately 400 million litres of milk daily, making it the world’s largest milk producer. The Indian milk economy is valued at Rs 5 lakh crore and is growing at 15–16% CAGR. Yet 48% of India’s milk is consumed by producers themselves, and 80% of milk consumption in India remains liquid milk. This means the market for value added dairy products, including flavoured milk, milkshakes, protein drinks and functional beverages, still has enormous headroom.
The key drivers of a dairy beverage revenue model include:
- Annual volume sold (litres or units), which is always less than installed capacity due to ramp-up, downtime, maintenance and seasonal variation.
- Average net realisation per litre, which is significantly lower than MRP after accounting for trade deductions.
- Product mix: flavoured milk, chocolate milk, milkshakes, lassi, buttermilk, protein dairy beverages, functional beverages – each with different MRPs and cost profiles.
- Pack-size mix: 200 ml, 180 ml, 500 ml, 1 litre – smaller packs carry higher per-litre packaging cost but command higher per-litre MRP.
- Channel mix: proportion sold through general trade, modern trade, institutions, HoReCa, private label, e-commerce.
Revenue models in dairy vary based on scale and target consumer. The dairy beverage industry primarily generates income through volume-based sales models, where thin per-unit margins are multiplied across large quantities.
Commercial deductions are where most promoters underestimate reality. Typical distributor margins for dairy beverages run 8–15% gross, but net margins after spoilage, transport and credit risk may fall to 3–5%. Retailer margins add another 8–15%. Then come freight, cold chain costs, promotional schemes, introductory offers and product returns or expiry losses.
Seasonal variations are significant. Flavoured milk, milkshake and lassi sales spike during Indian summer months (April–June) and dip during monsoon and winter. This creates uneven monthly revenue patterns that must be factored into cash-flow projections.
Consider this contrast:
| Approach | Formula | Result |
|---|---|---|
| Simplistic (often seen in weak DPRs) | Installed capacity × 12 months × MRP | Massively overstated turnover |
| Realistic (commercially sound) | Achievable saleable volume × Net realisation after all deductions | Credible, bankable projection |
Illustrative example (for understanding only): If a 200 ml flavoured milk pack has an MRP of ₹30, retailer margin of ~15% brings the price-to-retailer to ~₹25.50, distributor margin of ~10% yields price-to-distributor of ~₹23, and after freight, schemes and expiry losses of ~5%, the net realisation to the plant is approximately ₹21.85 per unit. That is roughly 27% below MRP.
For DPRs and financial projections, turnover should always be built on realistic net realisation and achievable capacity utilisation – not on theoretical 100% capacity at full MRP. The Indian dairy beverage market is projected to grow to Rs 117.29 billion by 2032, but capturing any share of that requires a grounded revenue model, not wishful arithmetic.
Major Revenue Streams for a Dairy Beverage Plant
The dairy beverage industry employs diverse revenue models. A well-designed dairy beverage plant business model taps multiple streams rather than depending on any single channel. Here are the primary revenue streams available to a dairy beverage manufacturer in India:
- Own-brand general trade sales: The core revenue engine for most plants. Sales through distributors to kiranas, convenience stores, milk parlours and small supermarkets. Moderate margins, frequent delivery cycles, short credit periods.
- Distributor/dealer network sales: Primary billing to appointed distributors who handle secondary distribution. The largest volume channel for most brands.
- Modern trade (supermarkets, hypermarkets): Higher visibility and larger per-outlet volumes, but demands listing fees, promotional contributions and longer payment cycles.
- Institutional sales: Schools, hospitals, corporate canteens, caterers, railways, defence establishments. Large order quantities, often at negotiated rates below retail pricing, but predictable demand.
- HoReCa (Hotels, Restaurants, Cafés/Catering): Relationship-driven B2B channel. The B2B bulk supply model sells dairy in large quantities to food service clients, often in customised pack formats.
- Private label manufacturing: Producing dairy beverages under another company’s brand. Lower marketing cost, better capacity utilisation, but thinner margins.
- Contract manufacturing: Conversion-based charges for third-party brands. Co-manufacturing involves producing white-label dairy beverages for retailers or marketing companies.
- E-commerce and quick commerce: Growing rapidly in metros for chilled dairy products. Direct-to-consumer models involve subscription deliveries of dairy products, and some dairy companies use subscription models to enhance customer loyalty.
- Direct-to-consumer (D2C): Feasible in limited geographies, especially for premium or speciality products.
India’s organized milk economy is valued at Rs 80,000 crore. Over 55% of revenue for large cooperatives like Mother Dairy and Amul comes from liquid milk sales, but value added products increasingly drive margin growth. The global dairy beverage market is projected to reach $142.77 billion by 2033, growing at a CAGR of 6.1%, underscoring the scale of opportunity.
Each additional revenue stream adds operational complexity – separate SKUs, contracts, service-level expectations, invoicing and compliance requirements – that must be planned in the DPR. But the diversification reduces dependence on any single customer, season or geography.
Retail Distribution Revenue Model in Dairy Beverages
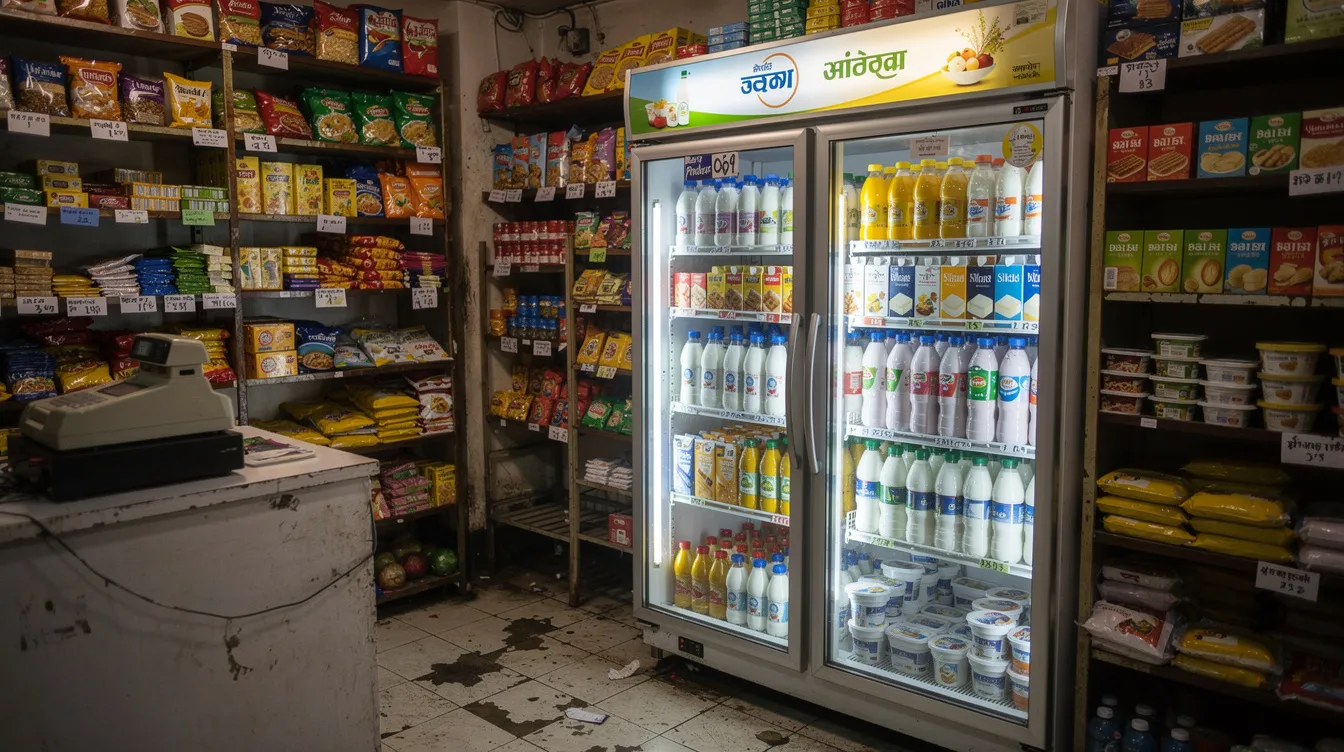
The classic Indian general trade flow for dairy beverages is: Manufacturer → Distributor → Retailer → Consumer. This channel handles both chilled and ambient dairy beverages and remains the backbone of most dairy brands’ sales strategy.
Primary sales (billing to distributors) and secondary sales (movement from distributors to retailers and ultimately to consumers) both need careful tracking. High primary billing without strong secondary offtake is a warning sign – it typically leads to inventory pile-up, expiry and costly returns that erode margins.
Key commercial terms in the retail distribution revenue model:
- Distributor margins (typically 8–15% of MRP for value-added dairy products, lower for plain milk)
- Retailer margins (8–15% depending on product and region)
- Introductory schemes for new product launches (free goods, display incentives)
- Cash discounts for prompt payment
- Credit periods to distributors (7–15 days for chilled, up to 30 days for ambient)
For chilled products, distribution costs are higher. The perishability of dairy products requires efficient cold chain logistics – refrigerated vehicles, visi-coolers at retail outlets, and rapid rotation of stock. These costs indirectly reduce net realisation for short shelf-life milk based beverages.
A realistic dairy beverage retail sales strategy should map outlet coverage, route planning, beat frequency and expected throughput per outlet for the first 12–24 months. The DPR should show how volumes will build gradually across a growing number of distributors and retail outlets, rather than assuming an abstract percentage of market share from Day 1.
Distributor, Super-Stockist and CFA Strategy
Distribution structure must match the plant’s scale and geographic ambitions:
- Direct distributors: Best for concentrated markets within 100–200 km of the plant. Lower channel margin, direct control over secondary sales.
- Super-stockists: Useful for wider state-level or multi-district coverage. They hold inventory, manage sub-distribution and earn a margin for providing reach. However, this extra layer reduces net realisation.
- Carrying and forwarding agents (CFAs): Handle warehousing and dispatch on behalf of the company, typically used when a brand needs regional hubs without appointing full-fledged distributors.
Territory allocation (city, district, region), exclusivity, minimum order quantities and performance targets should be clearly planned and reflected in revenue projections.
A small plant serving one or two districts should avoid building an unnecessarily complex dairy beverage distributor network that increases channel margins without generating sufficient volume. Conversely, a larger ambient-product plant aiming for multi-state distribution will need super-stockists and possibly CFAs to maintain supply chain efficiency.
Promoters should model different distributor network scenarios in their dairy beverage plant financial model and evaluate the trade-off between geographic coverage, channel margin and logistics cost.
Institutional Sales Model for Dairy Beverages
Institutional customers in the Indian dairy beverage context include schools, colleges, hostels, hospitals, corporate canteens, factories, caterers, canteen contractors, railway catering, defence establishments and government institutions (often via tender).
Institutional sales differ from retail in several ways:
- Bulk packs or customised SKUs are common
- Pricing is negotiated, usually lower than retail MRP
- Volume is more predictable and often contractual
- Credit periods tend to be longer (30–60 days or more)
- Quality consistency and reliable delivery schedules are non-negotiable
Strategic use: Institutions can serve as base-load customers that stabilise capacity utilisation while the promoter builds retail channels for better margin over time. When preparing a dairy beverage plant project report for India, promoters should clearly identify potential institutional tie-ups and build separate line items for institutional revenue with realistic pricing and credit-period assumptions.
HoReCa (Hotel, Restaurant, Café/Catering) Sales Strategy
HoReCa is distinct from general institutional sales. It covers hotels, standalone restaurants, café chains, cloud kitchens and catering businesses that use dairy beverages either as ready-to-serve products or as ingredients in their menu items.
Product formats for HoReCa include bulk packs of flavoured milk, milkshake bases, ready-to-drink lassi, coffee mixes and high-protein dairy beverages used in smoothies and desserts. The food service industry values consistency, taste profile and reliable supply over brand visibility.
HoReCa sales can be partially brand-neutral (the consumer never sees your pack) or co-branded (menu mentions). This affects dairy beverage product positioning and pricing differently than retail.
The sales cycle is relationship-driven – chef or food-manager approvals, trials, menu-integration time – and these lags must be factored into revenue ramp-up assumptions. HoReCa can be a strong B2B revenue stream in metro cities and tourist hubs, but it needs a dedicated sales team and service reliability to retain accounts.
Modern Trade Strategy and Supermarket Distribution
The modern trade channel encompasses national supermarket chains, hypermarkets, cash-and-carry formats and large regional organised retailers. This channel offers superior brand visibility and the ability to launch new SKUs in a controlled environment.
However, the economics of a dairy beverage modern trade strategy require careful modelling:
| Factor | Impact on Revenue Model |
|---|---|
| Listing fees | Upfront cost; reduces first-year net realisation |
| Category margins | Often 15–25% for dairy beverages |
| Promotional contributions | In-store promotions, end-cap displays, festival schemes |
| Centralised procurement | Standard terms, less negotiation flexibility |
| Payment cycles | 30–60 days, sometimes longer |
| Return policies | Unsold stock often returned, especially chilled products |
Modern trade can improve market penetration and consumer awareness for new brands, but promoters should evaluate it selectively in early years. In financial projections, clearly model the lower net price but potentially higher volume and marketing benefits.
Private Label Dairy Beverage Manufacturing
Private label dairy beverages in India involve manufacturing for retail chains, other brands or marketing companies using their brand name, while the plant focuses on production and quality. This segment has grown as organised retail expands.
Advantages:
- Improved capacity utilisation, especially during brand-building years
- Lower marketing and sales overheads
- Stable offtake if the partner brand has strong distribution
- An additional revenue stream parallel to own brand
Limitations from a profitability perspective:
- Generally lower contribution per litre compared with own-brand sales
- Dependence on a few key customers creates concentration risk
- Price pressure during contract renewal
- Limited control over brand perception
A DPR should discuss technical specifications, packaging formats, quality standards and contractual arrangements for any planned private label business. In practice, many medium-sized Indian dairy plants balance their own brand with private label dairy beverages to support cash flow during brand-building years.
Contract Manufacturing Revenue Model
Contract manufacturing differs from private label in a specific way: in a pure contract manufacturing model, the brand-owner may supply raw materials and packaging, while the plant charges conversion-based fees (per litre or per bottle). In private label, the manufacturer typically sources everything and sells the finished product.
Conversion-based revenue provides predictable though limited-margin income. Commercial terms that should be captured in the revenue model include:
- Minimum batch sizes and capacity reservation commitments
- Quality responsibilities and rework/rejection handling
- Raw material and packaging responsibility (who procures, who pays)
- Credit terms (typically 30–45 days)
From a project-feasibility perspective, contract manufacturing can support early years’ capacity utilisation while the promoter slowly scales own-brand sales. Include a separate revenue line for contract manufacturing in the dairy beverage plant financial model, with conservative volume assumptions unless firm contracts exist.
Product Positioning Strategy and Price Band
Product positioning directly determines target MRP and achievable net realisation. Brand strategy and positioning influence pricing power across the dairy industry, and this is particularly true for value added dairy products that can command premium pricing due to added health benefits.
Common positioning spaces in the Indian market:
- Mass-market: Affordable flavoured milk and buttermilk for daily consumption
- Value-for-money: Mid-priced milkshakes and lassi targeting youth and families
- Premium: Protein dairy beverages and functional beverages for fitness-conscious and health conscious consumers
- Kids’ segment: Flavoured dairy beverages are popular among children globally; chocolate and strawberry milk in fun packaging
- Regional/cultural: Kesar-badam milk, haldi doodh, thandai – leveraging traditional beverages and local flavour preferences
Product innovation is vital for capturing consumer interest in the dairy sector. Formulation, packaging and marketing spend must match the chosen price band. Premium products need better packaging (aseptic, glass, high-quality PET) and stronger brand presence, but they allow higher contribution margins.
Promoters should study competitor MRPs in their target geography and build a realistic dairy beverage pricing strategy grounded in competitive positioning, not just cost-plus arithmetic.
Product Mix and Revenue Strategy
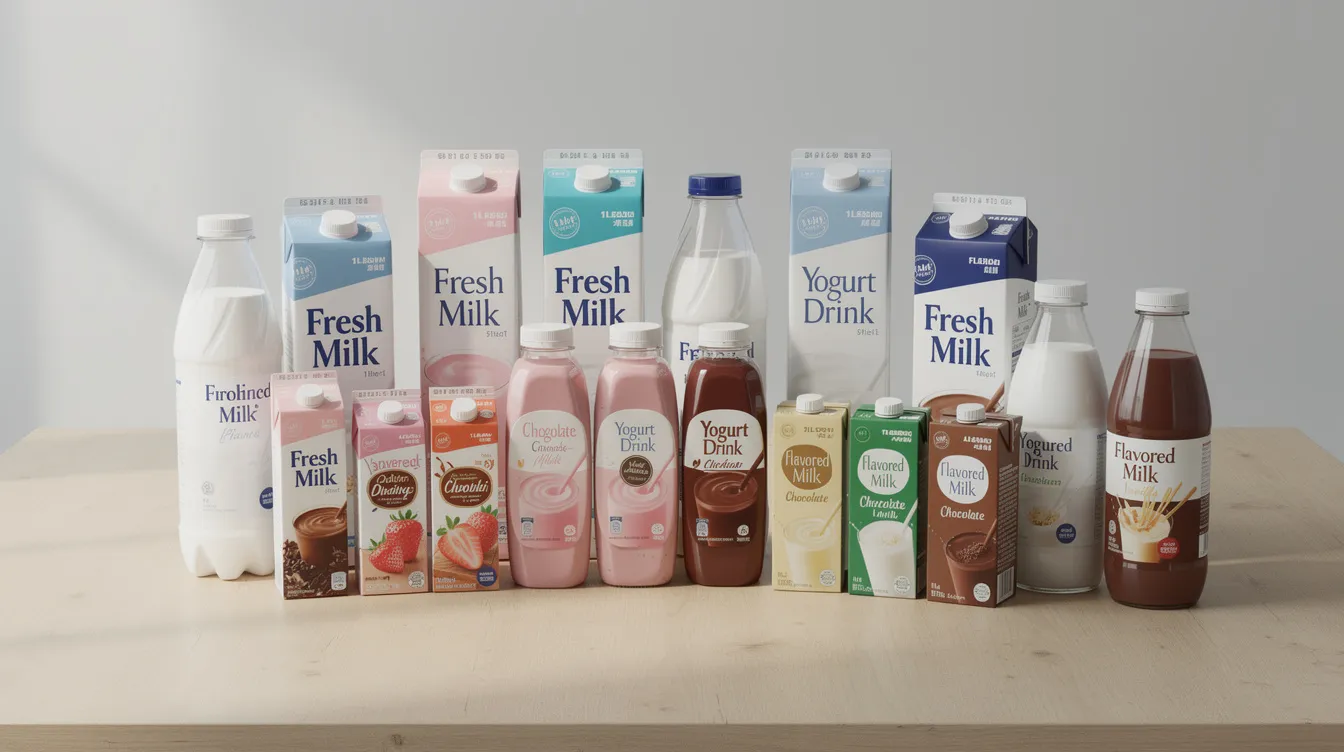
A dairy beverage plant revenue model should not depend on a single SKU. A balanced product mix with varying margins, shelf lives and demand patterns is essential for sustainable growth.
Short shelf-life chilled flavoured milk can generate daily volumes in local markets, while longer shelf-life ready-to-drink dairy beverages support wider distribution through ambient channels. Currently, 80% of milk consumption in India is liquid milk, which means that value-added segments – from flavoured milk to protein drinks – represent a significant conversion opportunity for dairy producers.
Consider the contribution each product segment can make:
- Flavoured milk is the volume driver in most plants. The Indian flavoured milk market was valued at around INR 76.4 billion in 2025, projected to reach INR 385.5 billion by 2034 at a compound annual growth rate of approximately 19.1%.
- Chocolate milk appeals strongly to children and young adults; it can be a consistent “hero” SKU for new brands.
- Milkshakes command a higher MRP per unit and can target cafés and modern trade alongside retail.
- Protein and functional dairy beverages are niche but growing rapidly. Probiotic milk is a fast-moving dairy product in retail, and probiotic drinks are among the fastest-growing dairy beverage segments globally.
- Nestle launched Greek yogurt as a high-demand product in India, and Danone introduced ambient yogurt with a six-month shelf life, demonstrating how product innovation expands the category.
Over 55% of revenue for large dairy cooperatives comes from liquid milk sales, but the margin on milk based beverages and functional beverages is considerably higher. Companies can diversify revenue by producing high-margin specialty beverages alongside volume products. The key is to start with a focused set of hero products and expand the mix as distribution and brand equity grow.
Capacity Utilisation and Revenue Planning
Capacity utilisation is a core assumption in any dairy beverage plant revenue projection. A new plant should not assume 100% utilisation from Day 1. Even established dairy companies take 2–3 years to scale distribution and brand acceptance fully.
Key factors affecting utilisation:
- Existing brand strength or promoter reputation in the dairy industry
- Distribution coverage and number of active outlets
- Confirmed institutional contracts or private label agreements
- Number of active SKUs and their market traction
- Availability of working capital to fund inventory and receivables
For a new greenfield project in India, it is commercially prudent to project conservative utilisation in the first 2–3 years, perhaps 40–50% in Year 1, increasing as distribution and consumer confidence improve. Detailed guidance on aligning capacity with product strategy is available in the article on dairy beverage plant capacity planning and product mix.
Under-utilised capacity increases the fixed-cost burden per unit and can erode margins even if gross sales appear reasonable. Capacity planning and market planning must be developed together.
Packaging Choices and Their Impact on Revenue
Packaging is not merely a production decision – it directly influences the dairy beverage pricing strategy, shelf appeal and distribution feasibility.
- PET bottles: Lightweight, cost-effective for mass-market flavoured milk. Suitable for general trade and modern trade. Dairy companies are increasingly adopting sustainable packaging materials, and some PET lines now use recyclable or lighter-weight bottles to reduce carbon footprint.
- Glass bottles: Premium perception, reusable, suitable for HoReCa and specialty stores. Higher logistics cost due to weight and fragility.
- Aseptic carton packs (Tetra-style): Enable ambient distribution, longer shelf life, wider geography. Higher per-unit packaging cost but dramatically lower cold chain expense. Plants targeting ambient shelf-stable products should explore aseptic dairy beverage processing and packaging.
- HDPE bottles and cups: Used for buttermilk, lassi and yogurt drinks in local markets.
For a detailed comparison of bottling line investments and operational aspects, refer to dairy beverage bottling plant and packaging systems.
Packaging choice influences selling price, net realisation and the feasible distribution radius. Smaller packs (150–200 ml) carry higher per-litre packaging cost but command higher per-litre MRP and suit impulse purchase occasions.
Cold Chain Requirements and Market Reach
The distinction between chilled and ambient dairy beverages fundamentally changes the revenue model and distribution economics.
Chilled products (flavoured milk, lassi, fresh milkshakes requiring 2–8°C storage) need:
- In-house cold rooms at the plant
- Refrigerated transport vehicles
- Distributor-level cold storage
- Visi-coolers at retail outlets
These requirements limit the economic distribution radius – typically a few hundred kilometres depending on shelf life. Cold chain logistics adds significantly to per-unit cost and increases the risk of spoilage.
Ambient shelf-stable products using ultra high temperature processing and aseptic packaging eliminate most cold chain costs and enable pan-India or even export distribution, but require higher upfront capital investment.
Investors and bankers look closely at cold chain assumptions because they influence both capital cost and ongoing logistics expenditure. Detailed planning guidance is available in cold storage and cold chain requirements for dairy beverages.
Pricing Strategy for Dairy Beverages
Pricing a dairy beverage is not a single decision – it involves layering costs, margins and commercial terms to arrive at a price that is competitive for the consumer, viable for the channel and profitable for the manufacturer.
Base cost components: Raw milk, sugar, flavours, stabilisers, packaging, utilities, labour, overheads, freight, cold chain, marketing and administration. Raw milk prices are a key factor since profit margins in dairy can be affected by raw milk price fluctuations and price volatility.
Price layers:
| Price Element | Description |
|---|---|
| MRP | Maximum Retail Price printed on pack |
| PTR (Price to Retailer) | MRP minus retailer margin |
| PTD (Price to Distributor) | PTR minus distributor margin |
| Gross Invoice Value | Amount billed to distributor |
| Net Realisation | Invoice value minus schemes, freight, returns, taxes |
For DPR-level financial projections, net realisation per unit is the key driver for revenue and profitability, not the consumer-facing MRP alone. Different channels require different trade margins. Mother Dairy’s distribution portfolio shows margins on flavoured milk around 12–15% and on lassi/buttermilk around 13–16%.
Geography-Based Market Strategy
Emerging market demand for dairy is driven by expanding middle-class populations, but market dynamics vary sharply across Indian states and cities. While North America holds 31.85% of the global dairy beverage market share, the Indian market is where local production and consumption patterns create unique opportunities for new plants.
A promoter can phase market entry:
- City-first: Launch in 1–2 cities near the plant, build deep retail coverage, prove secondary sales, then expand.
- Institutional-first: Secure institutional contracts in core geography for base volume, add retail gradually.
- Private-label-first: Use contract manufacturing for national brands to achieve utilisation, then launch own brand regionally.
First-year revenue projections should primarily focus on core catchment markets where the sales team can actively support distributors and retailers. Expanding too fast across too many states inflates logistics and promotional costs, strains working capital and increases product expiry risk.
Urban, Semi-Urban and Rural Market Approach
Urban markets support premium dairy beverage positioning, smaller on-the-go packs and modern trade presence. Semi-urban and rural markets are more price-sensitive, with lower refrigeration availability and less frequent distribution routes.
Pack-size strategies often differ:
- 150–200 ml impulse packs for urban youth at convenience stores
- 500 ml–1 litre family packs for semi-urban households
- Value-priced sachets or small cups for rural kirana outlets
A well-planned dairy beverage business model may maintain different price points and brand propositions for different tiers of markets, all consolidated into one plant revenue model. Consumer preferences in rural areas may lean toward traditional beverages like lassi and buttermilk, while urban consumers may be drawn to functional beverages and protein drinks.
Sales Channel Mix for a Dairy Beverage Project
The concept of a “channel mix” means that total projected sales are distributed across channels according to strategic intent, not evenly. In a dairy beverage plant financial model, each channel should have separate assumptions for average selling price, margin structure, credit period and expected growth rate.
Illustrative breakdown (for understanding, not as a fixed benchmark):
| Channel | Indicative Volume Share (Year 1) | Indicative Volume Share (Year 3) |
|---|---|---|
| General Trade | 45–55% | 35–45% |
| Modern Trade | 5–10% | 15–20% |
| Institutional | 15–20% | 10–15% |
| HoReCa | 5–8% | 8–12% |
| Private Label / Contract | 10–15% | 5–10% |
| E-commerce / D2C | 2–5% | 5–10% |
The optimal mix depends on plant capacity, brand strength, product types (chilled vs ambient), consumer awareness and promoter capabilities. As own-brand retail gains traction, reliance on private label may reduce, improving overall contribution margins.
Market Strategy for a New Dairy Beverage Brand
Launching a dairy beverage brand in the competitive Indian market requires a disciplined, phased approach:
- Research first: Study competitors’ MRPs, packaging, distribution and consumer segments in the target geography. Understand local markets, retailer expectations and dairy consumption patterns.
- Define hero products: Launch with 3–6 well-chosen SKUs rather than 15–20. A focused launch keeps production, inventory and marketing manageable.
- Appoint strong distributors: Start with 2–3 committed distributors in core geography who have existing retail networks and cold chain capability.
- Run sampling and promotions: In-store sampling, introductory trade schemes and retailer display incentives drive trial purchase. Track repeat purchase, not just initial placements.
- Monitor weekly: In the first 6–12 months, track secondary sales data, expiry rates, retailer feedback and distributor stock levels rigorously.
- Validate before expanding: Capacity expansion should follow market validation. Installing more machinery without proven demand is a recipe for financial stress.
The growing demand for health-focused and premium dairy beverages creates opportunity, but business success comes from disciplined execution, not from aggressive assumptions.
Own Brand versus Private Label Strategy
| Parameter | Own Brand | Private Label / Contract |
|---|---|---|
| Margin potential | Higher (if brand succeeds) | Lower but more predictable |
| Marketing investment | Substantial and ongoing | Minimal |
| Market development effort | High – distribution, branding, promotions | Low – client provides demand |
| Customer concentration risk | Diversified (many retailers/consumers) | Concentrated (few buyers) |
| Capacity utilisation | Depends on brand acceptance | Can be secured via contracts |
| Working capital | Higher (inventory, receivables, schemes) | Moderate |
| Scalability | High long-term brand equity | Limited by client relationships |
Many Indian promoters design a hybrid dairy beverage plant business model where private label ensures base capacity utilisation while own brand is scaled gradually. DPRs should clearly spell out the planned proportion of own brand versus private label/B2B sales in both volume and value terms.
Revenue Assumptions in a Dairy Beverage DPR
A comprehensive dairy beverage project report for India should explicitly disclose these core sales-side assumptions:
- Installed capacity (litres/month or litres/year)
- Projected capacity utilisation by year (Year 1 through Year 5 or 10)
- Process loss and wastage percentage
- Saleable quantity after losses
- SKU mix (which products, which pack sizes, what proportion)
- Channel mix (percentage through each sales channel)
- Net selling price per SKU after all trade deductions
- Year-on-year volume growth and price escalation assumptions
- Seasonal demand patterns and their impact on monthly revenue
- Expected returns and expiry losses as a percentage of sales
All major assumptions must be backed by commercial logic – market study, distributor feedback, competitor pricing analysis, or the promoter’s existing network. The DPR should also show sensitivity scenarios, such as lower-than-expected realisation or slower volume build-up, to help promoters and bankers understand downside risk.
Relationship Between Project Cost and Revenue Model
The planned product range and market coverage should drive machinery selection, packaging systems, cold chain and building size – and therefore project cost. Not the other way around.
A plant targeting ambient aseptic dairy beverages for pan-India distribution requires significantly higher capital investment than a local chilled flavoured milk unit. This means different debt-equity profiles and revenue-recovery timelines.
Promoters should first sketch their dairy beverage market strategy and revenue model, then finalise plant capacity, technology and capital expenditure to match. Detailed guidance on project cost structures is available in the articles on dairy beverage plant project cost and means of finance and dairy beverage manufacturing plant setup cost in India.
Over-investing in capacity without a realistic revenue plan can adversely affect DSCR, IRR and bankability. Every rupee of capital expenditure should be justified by incremental revenue it enables.
Machinery Selection and Revenue Strategy
Choice of machinery – pasteurisers, homogenisers, UHT systems, filling and capping lines, CIP systems and chilling equipment – must align with the planned product mix and pack sizes.
Multi-format filling lines (handling both bottles and cartons) support flexible revenue models but at higher capital cost. Single-format lines are cheaper but less versatile if the dairy beverage business strategy evolves to include new pack types.
From a financial perspective, every machinery decision should be evaluated in terms of incremental revenue it enables versus additional capital and operating cost. Detailed machinery cost structures are discussed in dairy beverage plant machinery and equipment cost, while processing nuances are covered in homogenization and heat treatment for dairy beverages.
Excessive capital expenditure without sufficient projected sales weakens project viability and increases the break-even threshold.
Manufacturing Process and Commercial Planning
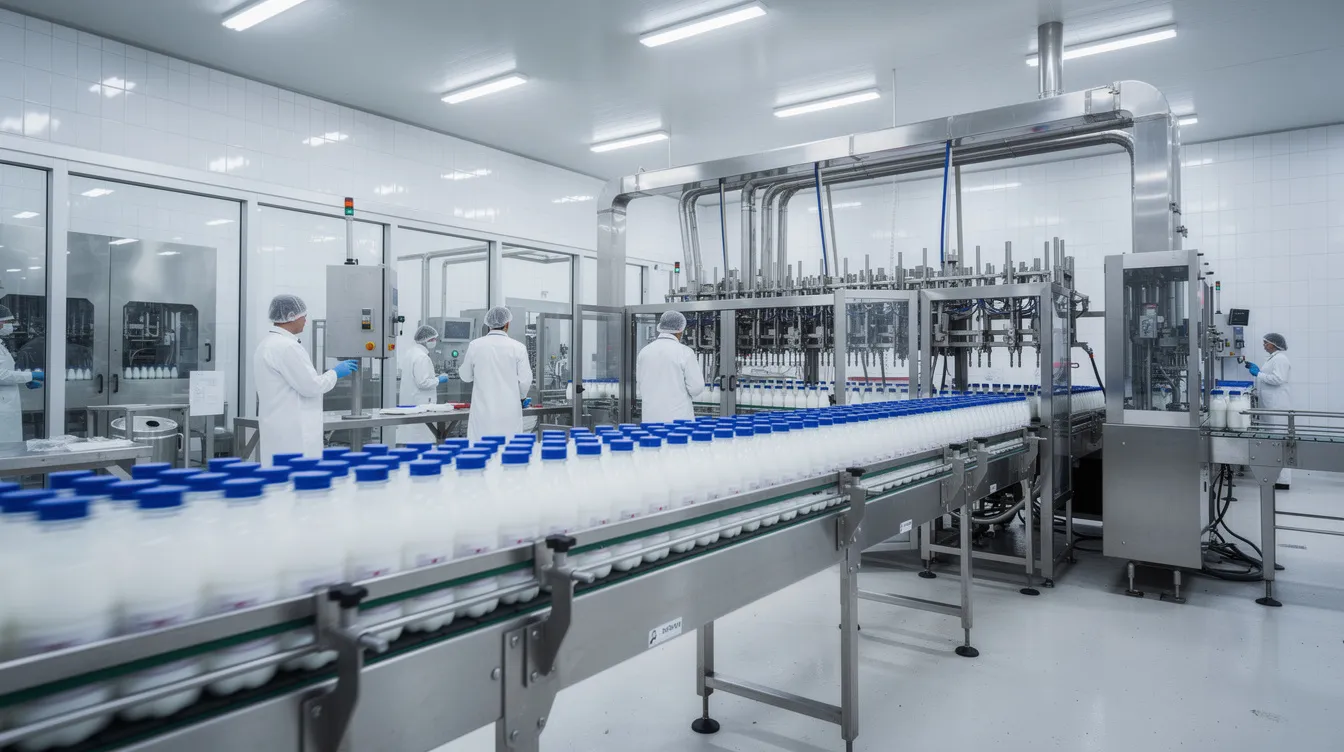
Dairy beverage manufacturing includes milk reception, standardisation, mixing, homogenisation, heat treatment, filling, packaging and cold storage. While the detailed process is covered in the article on dairy beverage manufacturing process and production line, the commercial relevance of process design deserves emphasis.
Batch size, process cycle time and changeover time between SKUs directly impact maximum practical output per shift and therefore achievable revenue. A plant with a diverse product mix strategy needs efficient SKU changeovers to avoid excessive downtime.
Dairy companies are investing in technologies to reduce environmental impacts across dairy processing and milk processing operations. Environmental sustainability is becoming a factor in consumer confidence and, increasingly, in food safety certifications.
Infrastructure, Hygienic Layout and Commercial Viability
Land, building design, process halls, utility blocks, quality labs and cold rooms should be sized in line with projected production scale and realistic expansion plans.
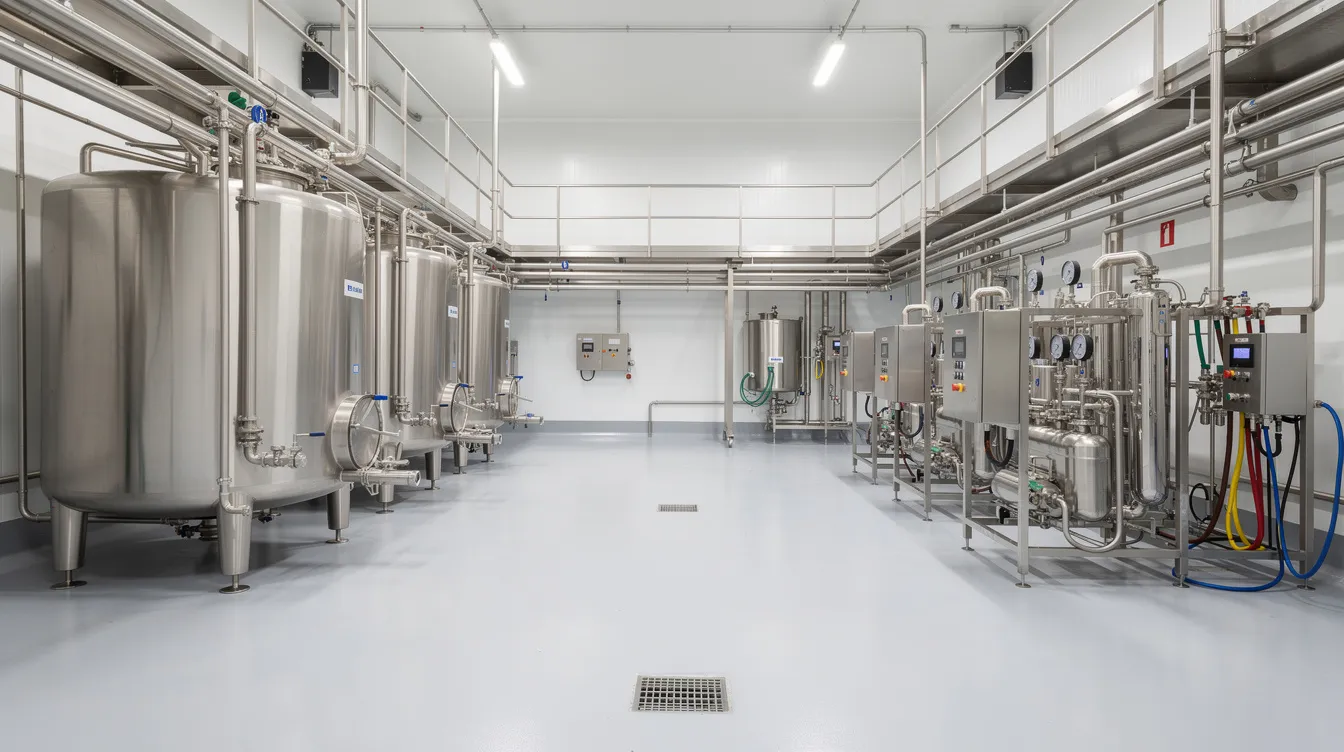
Hygienic zoning – separating raw milk areas from processing, filling, packing and dispatch zones – affects not only regulatory compliance and dairy production quality but also operational efficiency and losses. Under-designed utilities (chilling, steam, power backup) can limit capacity utilisation, while significantly over-designed infrastructure raises fixed costs and repayment burden.
In the broader dairy sector, 75% of energy consumed by CLAS (Climate, Land, Air, Sustainability)-focused dairy farms now comes from renewable sources – a trend that Indian plants can adopt to reduce operating costs and carbon footprint over time. Detailed layout considerations are explored in dairy beverage plant land, building, utilities and hygienic layout.
Working Capital Implications of Different Sales Channels
The dairy beverage revenue model ties directly into working capital. Higher credit periods, higher inventory requirements and extensive cold chain all increase the funds locked in operations.
| Channel | Typical Credit Period | Inventory Intensity | Cold Chain Dependency |
|---|---|---|---|
| General Trade | 7–15 days | Moderate | High (chilled) |
| Modern Trade | 30–60 days | Moderate | High |
| Institutional | 30–90 days | Low (bulk dispatch) | Moderate |
| Private Label | 30–45 days | Moderate | Varies |
| E-commerce | 15–30 days | High (fulfilment centres) | High |
Seasonal spikes – the April–June summer peak for flavoured milk, milkshakes and lassi – require temporary increases in raw material, packaging and finished-goods inventory, which must be funded through working capital lines.
A project with strong projected turnover can still face liquidity stress if working capital planning does not match the channel strategy. DPRs should include at least a season-wise working capital assessment built on channel-specific assumptions.
Contribution Margin Versus Sales Turnover
Promoters should not evaluate product performance only by turnover. The concept that matters is contribution margin: Net Sales – Variable Costs = Contribution. Variable costs include raw materials, packaging, variable utilities, variable freight and trade schemes.
Two SKUs with similar MRP can have very different contributions. A premium protein drink at ₹60 MRP with expensive whey protein ingredients and aseptic packaging may deliver lower contribution per unit than a simpler flavoured milk at ₹25 MRP with basic PET packaging and minimal ingredients – despite the former having a higher turnover per unit.
Promoters should analyse the dairy beverage profitability model at both SKU and channel level when deciding which products to push more aggressively. Moving volume from a low-contribution SKU to a higher-contribution SKU can improve overall plant profits even at the same aggregate turnover.
Break-Even Implications of the Revenue Model
Break-even sales volume depends jointly on fixed costs (salaries, interest, depreciation, utilities, overheads) and average contribution per litre. Higher trade margins, heavy promotional schemes or low net realisation raise the break-even point even if physical capacity is sufficient.
DPRs should compute break-even using realistic contribution assumptions based on the planned product and channel mix. A small local plant with lower fixed costs may break even at 35–45% capacity utilisation, while a large aseptic multi-state project with higher capital cost and marketing overhead may need 55–65% utilisation before covering fixed costs. No single benchmark applies – project-specific calculations are essential.
Key Risks in Dairy Beverage Market Strategy
| Risk | Mitigation |
|---|---|
| Overestimating demand | Pilot launches, sampling, monitoring secondary sales before scaling |
| Low capacity utilisation | Secure institutional contracts and private label for base load |
| Excessive SKU proliferation | Start with 3–6 hero products; add variants after validation |
| Weak distributor performance | Rigorous distributor selection; regular performance reviews |
| High product expiry/returns | Strong cold chain controls; conservative shelf-life management |
| Aggressive price competition from dairy alternatives and unorganised players | Differentiate through quality, packaging, functional claims |
| Raw milk and sugar price volatility | Periodic price review mechanisms; escalation clauses in contracts |
| Delayed institutional payments | Strict credit control; credit insurance where feasible |
| Insufficient working capital | Align working capital lines with channel strategy and seasonality |
| Inaccurate market assumptions | Collect real data from test markets; review projections quarterly |
In the broader beverage market, the dairy sector contributes 66.6% of agricultural greenhouse gas emissions in the EU, creating regulatory and consumer pressure on sustainability practices. Indian dairy farms and beverage companies are increasingly expected to demonstrate environmental sustainability, which can influence market access and consumer preferences over time.
Building a Bankable Revenue Model
Banks and financial institutions examine several key factors while appraising a dairy beverage manufacturing project:
- Reasonableness of sales ramp-up over 3–5 years
- Selling-price assumptions relative to market reality
- Channel mix and supporting distribution arrangements
- Capacity utilisation trajectory
- Working capital adequacy
- DSCR (Debt Service Coverage Ratio) under base and stress scenarios
- Promoter experience in the dairy business or food and beverage sector
Very aggressive turnover projections without evidence of market tie-ups or realistic dairy beverage distribution network planning reduce the credibility of a project report. Private equity investments in India’s dairy sector have recently reached Rs 900 crore, signalling investor interest, but this interest flows toward projects with well-structured financial models.
Promoters should support revenue projections with data: local demand indicators, competitor analysis, letters of interest from distributors or institutional buyers where feasible. A coherent dairy beverage plant revenue model improves chances of constructive discussion with banks, though it does not guarantee sanction.
Role of Revenue Model in Overall Project Feasibility
The revenue model feeds directly into:
- Projected Profit & Loss (sales, gross profit, EBITDA)
- Cash-flow projections
- Working capital assessment
- Break-even analysis
- DSCR and loan repayment capacity
- ROI and IRR calculations
- Overall project feasibility determination
Even a technically sound plant with efficient machinery and high quality dairy products can fail if revenue assumptions are unrealistic or unaligned with ground-level market dynamics. Market strategy and financial projections should be prepared together – changing one later usually requires recalibrating the other.
From a project-finance perspective, promoters should review best-case, base-case and conservative revenue scenarios before committing large capital. The global dairy beverage market is projected to reach $142.77 billion by 2033, and the beverage industry continues to evolve with market trends like functional beverages, sustainable packaging and fermented dairy drinks. But global markets statistics do not automatically translate into local plant profitability. Every projection must be grounded in the promoter’s specific context.
Illustrative Example of a Dairy Beverage Revenue Model
The following example is purely illustrative and should not be interpreted as a standard industry benchmark. All numbers are hypothetical and intended only to demonstrate how a dairy beverage revenue model is structured.
Assumptions: A mid-sized plant with installed capacity of 10 lakh litres/month. Year 1 capacity utilisation: 45%. Product mix: flavoured milk (55%), milkshakes (20%), buttermilk/lassi (15%), protein dairy beverages (10%).
| Channel | Volume Share | Avg Net Realisation (₹/litre) | Annual Revenue (₹ Cr, approx) |
|---|---|---|---|
| General Trade | 45% | ₹48 | ~11.7 |
| Modern Trade | 10% | ₹43 | ~2.3 |
| Institutional | 20% | ₹38 | ~4.1 |
| HoReCa | 10% | ₹50 | ~2.7 |
| Private Label | 15% | ₹32 | ~2.6 |
| Total | 100% | Blended ~₹42 | ~₹23.4 |
Note how general trade and HoReCa deliver higher net realisation per litre, while private label and institutional channels offer lower realisation but contribute to capacity utilisation and cash flow stability. The blended net realisation of ~₹42 per litre is significantly below the average MRP, which might range from ₹55–75 per litre depending on SKU and pack size.
This example is for conceptual understanding only. Actual numbers depend on product type, location, packaging, brand strength, competitive advantage, distribution maturity and prevailing commercial conditions. Revenue projections in a project report must be customised to the specific project.
Key Questions Promoters Should Answer Before Finalising Market Strategy
Before committing capital, promoters should document clear answers to these questions:
Consumer and product:
- Who is the target consumer (age, geography, income, occasion)?
- What are the core products to launch first?
- What is the target MRP and price band for each SKU?
- What nutritional benefits or health benefits differentiate the products?
Distribution and geography:
- What is the initial geography (city, district, state)?
- Which channel will generate the first major sales?
- What margin will distributors and retailers require?
- Is refrigeration required? What is the distribution radius?
Operations and finance:
- What is the expected capacity utilisation in Year 1, Year 2, Year 3?
- Is private label or contract manufacturing part of the strategy?
- How much working capital will distribution channels require?
- What credit periods will institutional and modern trade buyers expect?
- How will unsold or expired dairy products be handled?
- What data from local markets or key markets supports the sales assumptions?
Documenting these answers as part of the dairy beverage manufacturing business plan and DPR maintains internal clarity and alignment among promoters, partners and investors.
Professional Project Report and DPR Support
In practice, many entrepreneurs benefit from professional support in structuring the business model, revenue projections and financial documentation for dairy beverage projects. A comprehensive dairy beverage plant project report typically includes:
- Business model description and market strategy
- Product mix and installed capacity
- Revenue model with SKU-level and channel-level assumptions
- Project cost and means of finance
- Profitability projections (Profit & Loss, contribution analysis)
- Working capital assessment
- Cash-flow projections
- Break-even analysis
- DSCR, ROI and IRR calculations
- Loan repayment analysis
- CMA Data where required by banks
CA Manish Gugliya is a practising Chartered Accountant and project finance consultant who assists promoters in preparing customised project reports, DPRs, CMA data and financial projections for dairy beverage plants and other food processing units across India. The role is to help structure assumptions, prepare realistic financial models and documentation for bank and investor review – not to guarantee loan sanction, subsidy or profitability.
Conclusion
A successful dairy beverage project in India requires far more than efficient processing equipment and packaged foods rolling off a production line. It needs a commercially sound dairy beverage revenue model and market strategy aligned to ground realities – the actual trade margins distributors expect, the credit periods modern trade demands, the cold chain costs that chilled products incur, and the competitive landscape in local markets.
The key pillars that hold up a viable project are: appropriate product mix, clear product positioning, realistic pricing, carefully chosen distribution channels, disciplined capacity utilisation ramp-up and robust working capital planning. Milk production capability is necessary but not sufficient. The beverage sector rewards those who plan their route to market as carefully as they plan their factory floor.
From a project-finance perspective, promoters should challenge their own assumptions and ensure that projected sales, margins and cash flows are achievable before committing large capital. Dairy consumption trends in India and across global dairy markets are favourable, but market share is earned through execution, not projections.
Well-prepared DPRs and financial models, grounded in realistic market strategy and honest assumptions, improve decision quality for promoters, bankers and investors alike. In my experience preparing project reports and financial projections for dairy beverage ventures, the projects that succeed are invariably those where the promoter understood the market as deeply as the machinery.
Frequently Asked Questions (FAQ)
These FAQs address common practical doubts promoters raise while planning a dairy beverage manufacturing project in India. Answers are general guidelines; detailed project-specific advice should be based on customised financial modelling and market assessment.
What is the difference between a dairy beverage revenue model and a dairy beverage business model?
The business model covers the overall way a company creates and delivers value – its products, target customers, key activities, supply chain design and competitive positioning in the beverage market. The revenue model is a subset that focuses specifically on how money is earned: product pricing across SKUs, channel margins, volume assumptions, net realisation calculations and identification of distinct revenue streams (own brand, private label, institutional, B2B bulk supply). In a DPR, the business model provides context while the revenue model provides the numbers that flow into financial projections.
How many SKUs should a new dairy beverage plant launch initially?
While there is no universally correct number, most new plants are better off starting with a limited set of 3–6 well-chosen hero products to control production complexity, manage inventory, monitor real consumer demand and stabilise operations before adding variants. Excessive SKU proliferation early on increases changeover downtime, forecasting errors, packaging inventory costs and the risk of expiry across slow-moving items.
Can a small dairy beverage plant be viable if it focuses only on local markets?
Many successful dairy plants in India operate profitably with a strong local or regional presence. Viability depends on choosing the right product mix for local consumer preferences, maintaining consistent quality, managing cold chain effectively, and building deep relationships with local distributors and institutions. Local production advantages include lower freight costs, fresher product delivery and the ability to respond quickly to market feedback. The constraint is scale – a plant focused purely on a single local market must ensure that achievable volume at realistic net realisation covers its fixed costs.
Should a promoter prioritise own brand or private label in the first few years?
The choice depends on the promoter’s capabilities, risk appetite and existing dairy business network. Own brand builds long-term brand equity and offers higher margin potential but demands sustained investment in marketing, sales teams and trade schemes. Private label or contract manufacturing provides more predictable base volumes with lower marketing cost, enabling stable capacity utilisation, but at thinner margins and with customer concentration risk. A hybrid approach – using private label for base load while building own brand gradually – is a common and commercially sound strategy adopted by many mid-sized dairy producers in India during the forecast period owing to brand-building timelines.
How often should the revenue model and projections be reviewed after plant commissioning?
Promoters should review actual versus projected sales, margins, channel mix and working capital at least quarterly during the first two years. Early data on secondary sales, retailer feedback, expiry rates, distributor performance and seasonal patterns is invaluable for course-correcting the dairy beverage market strategy. After the first two years, semi-annual reviews with annual DPR updates are advisable, especially if new products, channels or geographies are being added.