
Key Takeaways
- Milk powder plant break-even analysis determines the minimum production volume, sales value and capacity utilisation at which a plant’s total revenue equals its total cost, resulting in neither profit nor loss.
- Raw-milk price, milk-to-powder recovery ratio, net selling price, energy cost and finance cost are the most critical drivers of the break-even point for any milk powder manufacturing plant in the Indian context.
- Operating break-even, accounting break-even and debt-service (DSCR) sustainability are fundamentally different measures and must all be evaluated separately before committing capital to a milk powder manufacturing business.
- A project that looks profitable at 100% capacity utilisation can still face severe cash-flow stress at a realistic 50–70% utilisation, making sensitivity analysis indispensable.
- ProjectReportBank.com prepares customised break-even and financial feasibility analyses for SMP, WMP and dairy whitener projects across India.
Introduction: Why Break-Even Analysis Is Critical Before Setting Up a Milk Powder Plant
A milk powder manufacturing plant is one of the most capital-intensive ventures in the dairy processing industry. The initial investment for a small-scale plant starts at ₹50–80 lakhs, while larger facilities with modern equipment such as pasteurizers, evaporators and spray dryers can require several crore in capital expenditure. A small to medium plant typically takes 12–18 months from project initiation to commissioning. Before committing this kind of money and time, every promoter, cooperative, investor and lender needs a clear answer to one question: at what volume of milk powder production and sales does this plant start covering its costs?
That answer comes from break-even analysis. The global milk powder market was valued at USD 38.47 billion in 2025 and is expected to reach USD 61.76 billion by 2034, with demand growing at 8–12% per annum. India, the world’s largest milk producer, is well-positioned within this expanding global milk powder industry. Yet favourable market trends alone do not guarantee project success. Even if a project appears profitable at full capacity, it can remain financially stressed if capacity utilisation ramps up slowly, raw milk prices rise, powder recovery falls short, selling prices fluctuate, steam and electricity costs increase, or working-capital interest becomes excessive.
This article focuses specifically on milk powder plant break-even analysis in India. It is not a generic project-report overview or a global milk powder market survey. For a detailed discussion of capital expenditure, readers may refer to our guide on milk powder plant setup cost in India. Here, we will stay focused on the minimum output, sales value and capacity utilisation thresholds required to cover project costs.
What Is Milk Powder Plant Break-Even Analysis?
The break-even point of a milk powder plant is the level of annual production and sales at which total revenue exactly equals total cost. At this point, the plant has neither profit nor loss. Break-even analysis connects production economics to revenue and costs, helping promoters and lenders understand the minimum viable production of milk powder.
There are three core ways to express the break-even point:
- Break-even quantity: the number of kilograms or metric tonnes of milk powder that must be produced and sold per year.
- Break-even sales value: the total revenue in ₹ lakh or ₹ crore needed to cover all costs.
- Break-even capacity utilisation: the percentage of the plant’s practical annual capacity that must be utilised to reach break-even.
It is equally important to distinguish between different types of break-even:
- Operating break-even covers only cash operating costs such as raw materials, energy, labour and overheads-excluding depreciation and interest.
- Accounting break-even additionally covers depreciation and finance cost, bringing profit before tax to approximately zero.
- Cash break-even covers all actual cash outflows while excluding non-cash charges like depreciation.
- Debt-service (DSCR) break-even is the minimum EBITDA and cash accrual needed to comfortably service scheduled term-loan principal and interest payments.
A critical point that many first-time promoters miss: achieving accounting break-even in the profit and loss statement does not automatically guarantee adequate cash to meet EMI obligations or maintain working capital. The break-even point is where total revenue equals total costs on paper, but cash timing can tell a very different story.
Why Break-Even Analysis Matters for a Milk Powder Manufacturing Plant
Break-even analysis is a decision tool for entrepreneurs, dairy cooperatives, investors and banks evaluating a milk powder project. Break-even analysis helps determine the necessary sales volume to become profitable and provides a foundation for nearly every financial decision around the project.
Here is how it supports specific decisions:
- Investment decisions: Comparing break-even profiles of a 5 TPD plant versus a 15 TPD milk powder manufacturing unit reveals how economies of scale affect fixed cost per kilogram and minimum viable production.
- Product-mix planning: Choosing between skimmed milk powder, whole milk powder and dairy whitener affects contribution margins and the break-even quantity. A plant with 500 kg/day capacity can earn ₹1.5–2 crore annually, but actual profitability depends on the right product mix and market positioning.
- Pricing strategy: Break-even analysis shows the minimum net realisation per kg needed across institutional, retail and export channels.
- Bank-loan appraisal: Lenders use break-even and margin-of-safety analysis, alongside DSCR, while appraising a milk powder plant DPR for bank loan proposals. They want to see that a project can recover its capital investment in 4–5 years under reasonable assumptions.
- Sensitivity testing: The IRR for milk powder projects is crucial for investors, and break-even sensitivity directly influences IRR under different scenarios.
In my experience of preparing manufacturing plant project reports and CMA Data, I use break-even analysis to cross-check whether proposed volumes, contribution margins and finance structures are realistic. It is the single most effective sanity check before submitting a project for funding.
Major Factors Affecting the Milk Powder Plant Break-Even Point
The break-even of a milk powder manufacturing business is highly sensitive to several technical and commercial assumptions. A change in any one of these variables can shift the break-even quantity by hundreds of tonnes per year. Each factor deserves careful consideration.
Raw-milk procurement cost is the most significant cost component. According to the Department of Animal Husbandry and Dairying (DAHD), raw milk (6% fat, 9% SNF) was procured at an average of ₹49.03 per kg during 2024–25. Raw milk accounts for 65–70% of total operating costs. The effective cost per litre varies with fat and SNF content, seasonality, procurement radius, chilling and transport costs. Milk processing and powder production require careful consideration of seasonal variations, since lean-season prices can spike significantly. A milk powder plant requires 500–2,000 litres of raw milk per hour depending on installed capacity. Detailed procurement strategies are discussed in our article on milk procurement and raw-material planning.
Milk-to-powder recovery ratio directly determines how much liquid milk is consumed per kilogram of finished powder. For SMP, the conversion ratio is approximately 7.5–8.5 litres of milk per kg powder, while WMP may require 10–13 litres depending on composition. Powder yield depends on milk composition and processing conditions. Better recovery sharply improves contribution and lowers the break-even quantity.
Product mix matters because SMP, WMP, dairy whitener and value-added nutritional powders each have different net sales realisations, by-product credits and variable costs. This alters the overall milk powder plant contribution margin. A plant producing multiple products must model break-even for each product line.
Net selling price versus invoice price is a distinction many promoters overlook. The selling price is the revenue generated per unit sold, but the relevant figure for break-even is the net sales realisation after trade discounts, cash discounts, brokerage, commission, outward freight, packaging charges, GST adjustments and product returns.
Capacity utilisation has an outsized impact. Low utilisation inflates fixed cost per kg and delays the break-even point. Production capacity utilization affects the break-even point significantly. Capacity planning considerations are covered in milk powder plant capacity planning.
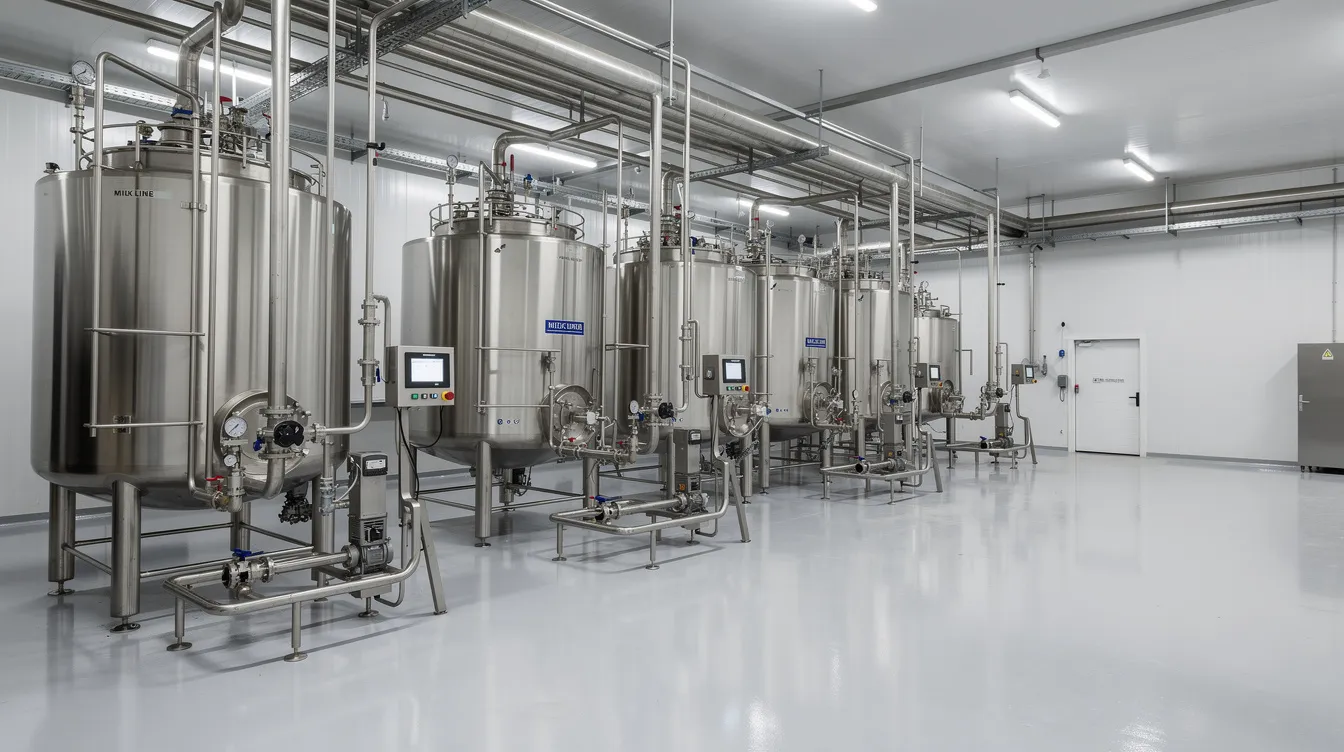
Utilities and energy efficiency: Evaporation and spray drying are major energy consumers in dairy processing. Energy costs account for 10–15% of total operating expenses. Fuel for boilers, electricity for spray dryers, refrigeration, water and effluent treatment all influence variable and semi-fixed costs. Deeper utility design is discussed in power, steam, water and refrigeration requirements.
Packaging and logistics: Pouch and laminate costs, corrugated boxes, storage, ambient or cold warehousing and outward freight-especially for pan-India or export distribution-add directly to distribution costs per kg.
Interest and working-capital cost: Higher inventory holding, longer receivable cycles and short supplier credit push up the cash break-even point. Seasonal milk procurement creates additional working-capital pressure. For a detailed treatment, see milk powder plant working-capital requirement.
Fixed Costs of a Milk Powder Manufacturing Plant
Fixed costs remain broadly constant in the short term regardless of the actual volume of milk powder produced. Fixed costs do not change with production volume. In break-even analysis, these are the costs that must be recovered through total contribution before any profit is earned.
| Fixed-Cost Head | What It Covers |
|---|---|
| Salaries and administrative overheads | Plant managers, accountants, admin staff, HR |
| Factory supervision and quality control | QC lab, technical monitoring, hygiene compliance |
| Security, insurance and property tax | Premises protection, asset insurance, local levies |
| Statutory compliance | FSSAI licensing, pollution control, regulatory approvals |
| Lease or opportunity cost of premises | Factory land and building as guided by milk powder plant land, building and infrastructure requirements |
| Fixed maintenance contracts | Annual service agreements for critical equipment including pasteurizers, evaporators and spray dryers, covered further in milk powder plant machinery and equipment cost |
| Minimum utility charges | Standby boiler costs, minimum electricity demand charges |
| Depreciation | Computed on spray dryers, evaporators, utility systems, buildings and civil infrastructure |
| Interest on term loan | Finance cost depending on capital structure, discussed in milk powder plant project cost and means of finance |
The treatment of depreciation and interest differs by break-even type. For operating break-even, both are excluded. For accounting break-even, both are included. For cash break-even, depreciation (a non-cash charge) is excluded, while actual interest paid in cash is included. The setup cost for a small-scale milk powder plant is ₹50–80 lakhs, but fixed costs also include ongoing operational overheads that many promoters underestimate.
Variable Costs and Milk Powder Manufacturing Cost per Kg
Variable costs are expenses that change directly with the quantity of milk powder manufactured and sold. Variable costs scale directly with production volume, and calculating break-even requires distinguishing between various fixed and variable costs with precision.
Raw milk is usually the dominant cost in milk powder production. Raw milk purchase accounts for 65–70% of operating costs, and milk powder accounts for 75–85% of total operating expenses in production when raw material consumption is included. The key variable cost elements per kg of finished product include:
| Variable-Cost Element | Description |
|---|---|
| Raw milk | Fresh milk purchased at farm-gate or collection-centre price |
| Milk collection and chilling | Bulk milk coolers, refrigerated transport to plant |
| Standardisation and additives | Cream adjustment, sugar or stabilisers for dairy whitener |
| Fuel and steam | Boiler fuel for evaporation and spray drying |
| Electricity (production-linked) | Drives for pumps, fans, atomisers, conveyors |
| Water and process consumables | Cleaning chemicals, filter aids, lab reagents |
| Packaging material | Laminates, pouches, bulk bags, liners, cartons for the packaging line |
| Outward freight | Transport to warehouses, distributors, institutional buyers |
| Sales commission and trade discounts | Agent commissions, channel discounts |
| Production-linked labour | Contract workers, overtime, loading and unloading |
Certain labour components may be variable (contract workers, overtime) while core staff costs remain fixed. Misclassifying these mixed costs is a common error that distorts break-even calculations. The milk powder manufacturing cost per kg must be computed product-wise for SMP, WMP and dairy whitener, because the variable cost structure and by-product credits vary by product.
Contribution Margin and P/V Ratio in Milk Powder Manufacturing
Contribution is the amount remaining after subtracting variable costs from net sales. It is the portion of revenue available to cover fixed costs and generate profit. Gross profit margins for milk powder typically range from 20–30%, but contribution margin is a more precise tool for break-even work.
The formula is straightforward:
Contribution per kg = Net Selling Price per kg – Variable Cost per kg
For example (purely illustrative): if the net selling price of SMP is ₹500 per kg and the variable cost including raw milk, energy, packaging and selling expenses is ₹420 per kg, the contribution per kg is ₹80.
Total Contribution = Contribution per kg × Quantity Sold
This total contribution must first cover all fixed costs. Only the balance becomes operating profit.
The Profit-Volume (P/V) ratio is calculated as:
P/V Ratio = (Contribution ÷ Net Sales) × 100
A higher P/V ratio means the plant needs a lower sales volume to reach break-even. But here is the critical sensitivity: even a ₹5 per kg increase in raw-milk cost, when multiplied by a recovery ratio of 8 litres per kg, increases variable cost by ₹40 per kg of powder, cutting contribution by half in many realistic scenarios. Factors such as energy costs and milk prices can significantly influence profitability.
For detailed revenue-side assumptions, readers may refer to milk powder plant revenue model and profitability.
Core Formulas for Milk Powder Plant Break-Even Calculation
Break-even analysis requires understanding fixed and variable costs and applying a few core formulas consistently. All units must match-if contribution is in ₹ per kg, fixed costs should also feed into the same per-kg logic.
Break-even quantity (kg or MT) = Total Fixed Costs ÷ Contribution per kg
This tells you the minimum kilograms of milk powder that must be sold annually to cover all fixed costs.
P/V Ratio = (Contribution ÷ Net Sales) × 100
Useful for estimating break-even in rupee terms without converting everything into quantity units.
Break-even sales value (₹) = Total Fixed Costs ÷ P/V Ratio (as a decimal fraction)
For instance, if fixed costs are ₹2.00 crore and P/V ratio is 16%, break-even sales = ₹2.00 crore ÷ 0.16 = ₹12.50 crore.
Break-even capacity utilisation (%) = Break-even Production ÷ Practical Annual Production Capacity × 100
This links directly to milk powder plant capacity planning and tells promoters and banks the minimum utilisation needed for viability.
Margin of Safety (₹) = Actual or Projected Sales – Break-even Sales
Margin of Safety (%) = Margin of Safety ÷ Actual or Projected Sales × 100
A higher margin of safety signals greater resilience to adverse conditions.
For cash break-even, exclude non-cash fixed costs such as depreciation. In some cases, notional rent or notional interest may also be excluded when evaluating pure cash sufficiency.
Illustrative Break-Even Example for an Indian Milk Powder Plant
The following numerical example is purely illustrative for educational purposes. It does not represent a quotation, industry average or financial advice. Actual results depend on location, milk composition, product mix, technology, seasonality and market conditions.
Assumptions
| Parameter | Illustrative Value |
|---|---|
| Installed annual capacity | 4,500 MT (≈ 15 TPD × 300 days) |
| Practical operating capacity | 4,200 MT (after maintenance downtime) |
| Expected capacity utilisation (Year 1) | 60% |
| Annual production (Year 1) | 2,520 MT |
| Net sales realisation per kg (SMP) | ₹480 |
| Variable cost per kg (incl. raw milk, energy, packaging) | ₹400 |
| Annual fixed operating cost (excl. depreciation & interest) | ₹1.50 crore |
| Annual depreciation | ₹0.60 crore |
| Annual finance cost (interest on term loan) | ₹0.50 crore |
| Annual term-loan principal repayment | ₹0.70 crore |
Step-by-Step Calculation
1. Contribution per kg = ₹480 – ₹400 = ₹80 per kg
2. Operating break-even quantity = ₹1.50 crore ÷ ₹80 = 1,87,500 kg (≈ 188 MT)
3. Accounting break-even quantity = (₹1.50 + ₹0.60 + ₹0.50) crore ÷ ₹80 = ₹2.60 crore ÷ ₹80 = 3,25,000 kg (≈ 325 MT)
4. Break-even sales value = 325 MT × ₹480/kg = ₹15.60 crore (approx.)
5. Break-even capacity utilisation = 325 MT ÷ 4,200 MT = approximately 7.7%
6. Margin of safety at projected Year 1 sales = Projected sales (2,520 MT × ₹480 = ₹121.0 crore) minus break-even sales (₹15.60 crore) = very large margin in this illustrative scenario, because the contribution per kg supports covering fixed costs at relatively low volumes.
7. Sensitivity – raw-milk cost increase of ₹5/litre: If milk requirement is 8 litres per kg of SMP, variable cost rises by ₹40/kg, reducing contribution from ₹80 to ₹40/kg. Accounting break-even quantity doubles to approximately 650 MT.
8. Sensitivity – selling price drops by ₹30/kg: Contribution falls from ₹80 to ₹50/kg. Accounting break-even rises to approximately 520 MT.
These illustrations show how sensitive the break-even is to raw materials and pricing. In practice, these calculations should be part of a full milk powder plant financial projections model covering at least 7–10 years. Operating costs are projected to increase significantly by year five, which must be factored into the projections.
Capacity Utilisation, Ramp-Up and Break-Even Timing
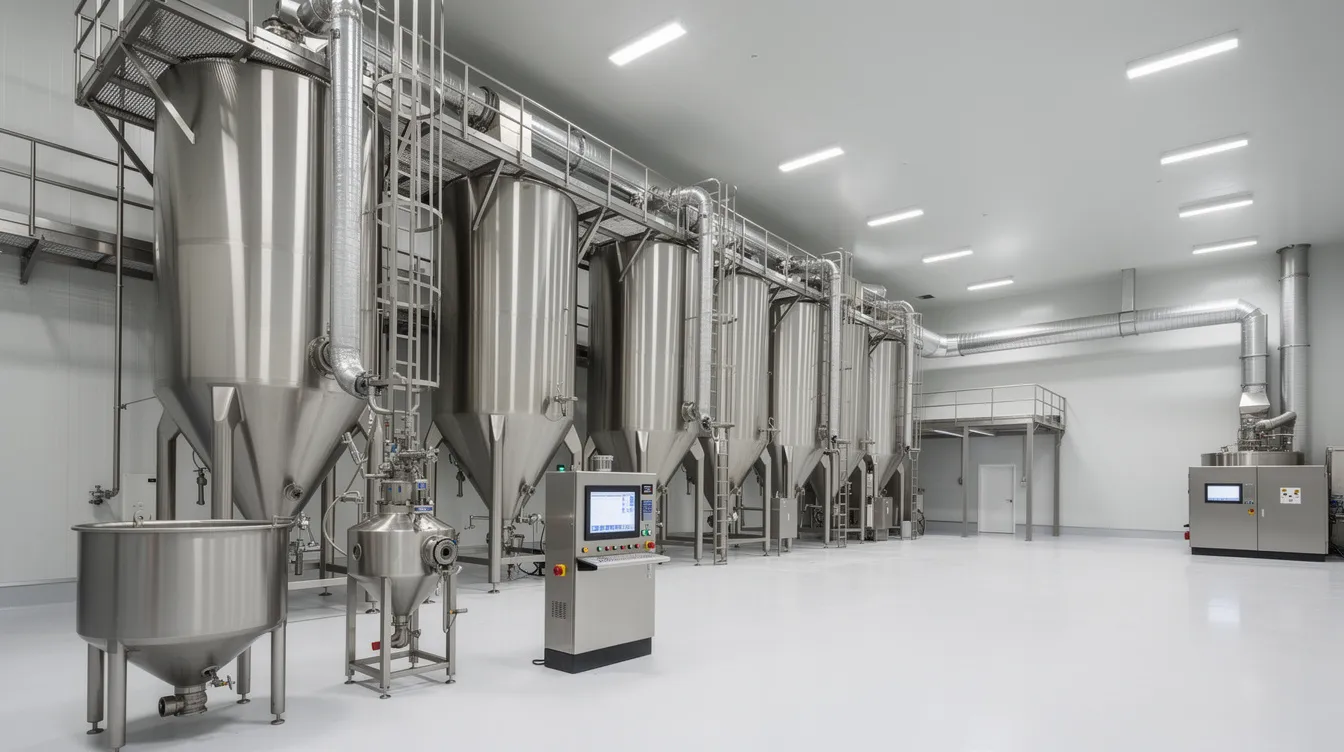
Many milk powder plants in India do not reach planned capacity immediately. Cooperative dairy plants averaged only about 35.66% capacity utilisation for milk powder during 2018–22, while private plants were even lower at 21–22%. By contrast, well-managed operations like AmulFed Dairy have achieved approximately 74% utilisation.
A year-wise capacity ramp-up schedule might look like this: 40% in Year 1, 60% in Year 2, 75% in Year 3 and 85% from Year 4 onwards. The actual pace depends on milk supply stability, product approval timelines, institutional-customer onboarding, export registrations and tuning of the manufacturing process flow for evaporation and spray drying parameters.
| Scenario | Utilisation | Annual Production | Fixed Cost per kg | Break-Even Status |
|---|
| Low (40%) | 1,680 MT | Higher | May not cover accounting fixed costs |
| Moderate (60%) | 2,520 MT | Moderate | Likely crosses operating break-even |
| High (85%) | 3,570 MT | Lowest | Likely covers accounting and DSCR break-even |
Lenders typically want to see that the plant can reach at least break-even capacity utilisation within a reasonable timeframe aligned with the term-loan repayment schedule. Efficient plant operations during ramp-up are critical.
Comparison of SMP, WMP and Dairy Whitener Break-Even Profiles
Different milk powder products have varying raw-material compositions, recovery efficiencies, by-product revenues and pricing power. Skimmed milk powder exports are increasing to Gulf countries and Southeast Asia, adding export potential but also price volatility.
| Factor | SMP | WMP | Dairy Whitener |
|---|---|---|---|
| Fat content in product | Minimal (≤1.5%) | Full fat retained | Adjusted fat-to-protein ratio |
| Milk required per kg | ~8 litres (lower fat milk) | ~10–13 litres (full-fat milk) | Varies with formulation |
| By-product revenue | High (cream, butter, ghee) | Low (fat retained) | Moderate |
| Primary end-use | Skimmed milk powder is used in infant nutrition and bakery | Whole milk powder is used in chocolate and high-quality retail packs | Dairy whitener is used in tea and coffee for its fat-to-protein ratio |
| Typical variable cost per kg | Moderate | Higher | Higher with additives |
| Net realisation per kg | Moderate | Higher | Potentially highest in retail |
Infant nutrition programs are driving sustained demand for milk powder, particularly SMP and specialised nutritional powders. Infant milk formula can sell for ₹12–18 lakh per tonne, while flavoured milk powders cater to tier-2 and tier-3 city markets. Detailed product-wise economics are covered in our articles on SMP manufacturing plant project, WMP manufacturing plant project and dairy whitener manufacturing plant project report.
None of these products is automatically more profitable. Profitability and break-even depend on procurement cost, product mix, selling arrangements and plant design within the competitive landscape of the milk powder industry.
Role of By-Product Revenue in Milk Powder Plant Break-Even
In SMP-focused plants, cream, butter and ghee are significant by-products. By-product revenue can reduce effective product cost in dairy economics, materially improving the break-even position.
Joint processing costs between milk powder and by-products can be allocated based on relative sales value or on technical yield percentages. In break-even analysis, by-product revenue may be treated either as other operating income or as a deduction from the net raw-milk cost. The chosen approach must be applied consistently across all financial projections.
Consider two illustrative scenarios. In a conservative assumption, a plant sells only 70% of its cream output at a modest market rate, yielding a by-product credit of ₹8–10 per kg of SMP produced. In an aggressive assumption, the same plant assumes 100% off-take at premium ghee prices, pushing the by-product credit to ₹25–30 per kg. The break-even quantity under the aggressive assumption might appear 30–40% lower, but if the market for ghee is uncertain, this creates a dangerous illusion of comfort. Promoters and lenders should use conservative by-product assumptions and treat any upside as additional margin of safety.
Operating Break-Even, Accounting Break-Even and DSCR
Operating profit, accounting profit and cash available for debt servicing are three distinct measures. Confusing them is one of the most common errors in milk powder plant profitability analysis.
Operating break-even is reached when contribution equals cash fixed operating costs-excluding depreciation and interest. In the illustrative example above, this required approximately 188 MT of SMP sales.
Accounting break-even is reached when contribution covers cash fixed costs plus depreciation and finance cost, bringing profit before tax to approximately zero. This required approximately 325 MT in the same example.
DSCR-related break-even refers to the minimum EBITDA and cash accrual needed to pay scheduled term-loan principal and interest with adequate buffer. A plant may cross operating break-even but still have a DSCR below 1.0 in early years if high interest and principal repayment obligations outstrip cash accruals. For a comprehensive treatment, readers should refer to milk powder plant DSCR and loan repayment capacity. DSCR analysis complements, rather than replaces, break-even analysis.
Break-Even Analysis Within a Bankable Manufacturing Plant Project Report
Bankers and financial institutions in India expect to see a coherent break-even analysis inside the milk powder plant DPR. It is not an optional exhibit-it is a core component of financial analysis.
The main financial sections of a bankable manufacturing plant project report that interact with break-even analysis include:
- Cost of production statement with product-wise cost analysis
- Product-wise sales estimates and net sales realisation
- Fixed and variable cost schedules
- Contribution margin analysis
- Projected profit and loss account
- Cash-flow projections, balance-sheet projections and term-loan repayment schedule
- DSCR calculations as part of milk powder plant financial projections
Assumptions about capacity utilisation, recovery ratios, raw-milk cost and pricing should be supported by process reasoning and market data, not just optimistic estimates. At ProjectReportBank.com, we integrate break-even analysis into the complete manufacturing plant project report, ensuring consistency across every financial statement.
Common Mistakes in Milk Powder Plant Break-Even Calculations
In my experience reviewing dairy and milk powder DPRs, several recurring errors distort the true break-even point:
- Using installed capacity instead of practical saleable production. Plants do not operate 365 days at rated capacity. Maintenance, breakdowns and seasonal downtime reduce practical output.
- Ignoring process losses. Lower initial recovery, spillage, non-conforming milk and moisture variations increase the raw materials required per kg of powder.
- Assuming immediate full-capacity utilisation from the first year, when real plants typically take 2–3 years to ramp up.
- Treating gross invoice price as net realisation. Product returns, freight, cash and trade discounts, brokerage and GST adjustments can reduce effective realisation by 5–15%.
- Omitting milk collection and chilling expenses from variable costs, treating only the farm-gate price as raw material cost.
- Misclassifying costs. Semi-variable expenses like certain utility charges and labour overtime must be correctly split.
- Overestimating by-product revenue without validated market channels or, conversely, ignoring cream and butter revenue entirely.
- Excluding working-capital interest from the cash break-even calculation.
- Confusing profit break-even with loan repayment capacity. A plant at accounting break-even has zero profit-it cannot service debt principal from zero profit.
- Using inconsistent assumptions across different sections of the DPR, leading to contradictory financial projections.
Sensitivity and Risk Analysis Around the Break-Even Point
A single break-even figure is not sufficient. Promoters and lenders must see how robust the project is under changing conditions. Sensitivity analysis is important for understanding break-even dynamics and testing whether the project survives realistic stress scenarios.
Key variables for sensitivity testing include raw-milk cost per litre, net selling price per kg, milk-to-powder recovery ratio, energy cost (both power and fuel), capacity utilisation, wage inflation and interest rates.
| Variable | Base Case | Favourable | Adverse |
|---|---|---|---|
| Raw-milk cost per litre | ₹49 | ₹45 | ₹58 |
| Net selling price per kg (SMP) | ₹480 | ₹520 | ₹440 |
| Capacity utilisation | 60% | 80% | 45% |
| Contribution per kg | ₹80 | ₹120 | ₹30 |
| Break-even quantity (illustrative) | 325 MT | 217 MT | 867 MT |
| Break-even CU (illustrative) | 7.7% | 5.2% | 20.6% |
All sensitivity figures above are illustrative. Actual results depend on local milk availability, seasonality, technology selection, price trends and market contracts. Sensitivity analysis should be part of every comprehensive milk powder plant financial feasibility study to inform promoters about the range of possible outcomes.
Strategies to Improve the Break-Even Position of a Milk Powder Manufacturing Unit
Break-even is not a fixed number carved in stone. Promoters can actively work to lower the break-even quantity and strengthen the margin of safety. A properly designed facility can reduce the break-even period, and an efficient procurement strategy is essential for earlier break-even.
Operational strategies:
- Secure reliable milk procurement through cooperatives, FPOs or long-term supply agreements, following the approaches in milk procurement and raw-material planning
- Invest in quality control and quality assurance criteria for raw milk intake to improve milk-solid recovery
- Adopt sustainable practices in waste reduction and water management
Technical actions:
- Improve milk-solid recovery through better unit operations involved in evaporation and drying
- Switch to energy-efficient multiple-effect evaporators with heat recovery to reduce energy costs
- Ensure that milk powder plant machinery and equipment are correctly sized for the planned capacity, avoiding both under-sizing and costly over-engineering
Commercial steps:
- Optimise the product mix between SMP, WMP, dairy whitener and value-added powdered milk products
- Negotiate better packaging and logistics contracts to reduce distribution costs
- Build stable institutional or B2B channels and explore contract-drying income as rising consumer demand for processed food and milk powder products expands the market
Financial structuring:
- Phase capital expenditure to match ramp-up, avoiding idle-asset costs
- Align term-loan repayment with realistic stabilisation periods as guided by milk powder plant project cost and means of finance
- Maintain prudent working-capital management to minimise interest costs
Improving the break-even position should be a continuous exercise supported by regular monitoring of contribution margins, operational efficiency and market-level cost trends.
Professional Perspective: How I Approach Milk Powder Plant Break-Even Analysis
When I prepare or review a milk powder manufacturing plant DPR, I treat break-even analysis not as an isolated formula but as a consistency check across the entire project. I start by verifying the milk balance-litres of raw milk in versus kilograms of powder and by-products out-and match it against the detailed process flow and financial projections. If the numbers do not reconcile, the break-even point is unreliable regardless of how neatly it appears in a spreadsheet.
I also cross-check whether the assumed production capacity utilization in Year 1 through Year 5 is realistic given the procurement infrastructure, the manufacturing process, seasonal milk production patterns and the time needed for market development. Overly aggressive ramp-up assumptions make the early-year projections look comfortable while hiding genuine cash-flow risk. The nutritional value and shelf life considerations of milk powder products also feed into my assessment of market feasibility.
Finally, I verify that working capital, interest costs and term-loan instalments have been adequately provided, so that the plant’s DSCR remains reasonable after accounting for the real break-even capacity utilisation. No break-even analysis is complete without this financial integration. Entrepreneurs and cooperatives are welcome to reach out for professional assistance with customised break-even modelling and feasibility analysis.
Conclusion: Using Break-Even Analysis for Better Milk Powder Plant Decisions
The true break-even point of a milk powder manufacturing plant depends on realistic assumptions about raw-milk cost, recovery ratio, net selling price, utilities, capacity utilisation, by-product income and finance costs. No single formula can capture all these moving parts unless fed with carefully researched, location-specific and product-specific inputs. The milk powder market performed well in recent years, but individual plant economics vary enormously.
Milk powder plant break-even analysis should be read alongside full financial projections, working-capital assessment and DSCR analysis rather than used as a standalone decision metric. All numerical examples in this article are illustrative, and actual project economics will vary by state, milk-shed, technology selection and market positioning. Leading milk powder manufacturers in India succeed not because they have a favourable break-even on paper, but because they manage the gap between projection and reality through disciplined operational and financial management.
If you are planning a milk powder manufacturing plant, expanding an existing milk processing plant or evaluating a dairy whitener or SMP project, I invite you to contact me through ProjectReportBank.com for a customised milk powder plant DPR, break-even study, CMA Data and bank-finance proposal support. No guarantees of loan sanction or profitability are made-what I offer is rigorous financial analysis grounded in decades of project-finance experience, covering the full spectrum from food processing industries to specialised dairy products within the food manufacturing sector.
FAQs on Milk Powder Plant Break-Even Analysis
The following FAQ section addresses practical questions that readers often ask beyond the main article content. All answers relate specifically to the Indian context for milk powder manufacturing and avoid guaranteed figures or universal benchmarks.
What is the break-even point of a milk powder plant?
The milk powder plant break-even point is the level of annual milk powder production or sales at which total revenue equals total cost, resulting in zero profit and zero loss. This varies widely based on plant size, milk-to-powder recovery, raw-milk cost, product mix and finance structure, so there is no single standard number applicable across India. A typical DPR will express break-even both as tonnes of powder per year and as a percentage of practical capacity utilisation. The break-even point is also expressed as a sales value in ₹ crore for lender presentation.
How do you calculate milk powder plant break-even quantity?
Break-even quantity is computed by dividing total annual fixed costs of the plant by the contribution per kg of milk powder. Contribution per kg is the difference between net selling price per kg and variable manufacturing cost per kg, including raw milk, utilities, packaging and selling expenses. When the plant produces SMP, WMP and dairy whitener together, product-wise break-even should ideally be calculated separately to reflect each product’s distinct cost structure and realisation.
What is break-even capacity utilisation for a milk powder plant?
Break-even capacity utilisation is the percentage of the plant’s practical annual production capacity that must be utilised and sold to reach break-even. It is calculated by dividing break-even annual production (in kg or MT) by the plant’s realistic annual capacity and multiplying by 100. Lenders generally prefer that projects can demonstrate reaching at least this break-even utilisation within the first two to three years of operation, subject to reasonable ramp-up assumptions supported by procurement and marketing plans.
Is break-even analysis alone enough to obtain a bank loan for a milk powder plant?
Break-even analysis is necessary but not sufficient. Banks also review detailed financial projections, DSCR, promoter background, collateral adequacy, market study, technical feasibility and net present value. A strong break-even profile supports the loan proposal but does not guarantee sanction, as lending decisions depend on multiple risk parameters and regulatory guidelines including those of RBI and NABARD. Entrepreneurs should integrate break-even analysis within a complete DPR and CMA Data package when approaching banks.
Can a milk powder plant be profitable yet still face cash-flow problems?
Yes. A plant can show accounting profit but still suffer cash-flow stress if receivables are high, inventory of dehydrated dairy product or raw materials builds up, or loan instalments and interest outflow are heavy relative to cash accruals. This happens when the timing of cash inflows and outflows is mismatched, or when working-capital limits are inadequate for the scale of operations. This is precisely why break-even analysis must be complemented with cash-flow projections, DSCR analysis and working-capital assessment. Hot air drying and the production process itself consume cash before revenue is realised, adding to the timing challenge in any milk powder manufacturing business.