
Key Takeaways
- Realistic milk powder plant financial projections must be built from technical capacity, milk-to-powder yield and market-linked selling prices-not reverse-engineered to show attractive profits or inflated DSCR.
- Indian banks require a 5–10 year Milk Powder Manufacturing Financial Model covering Projected Profit and Loss, Balance Sheet, Cash Flow, DSCR and detailed Milk Powder Plant CMA Data before sanctioning term loan and working capital limits.
- Assumptions for raw milk procurement, utilities, labour and selling prices must be internally consistent across the production plan, revenue schedule, cost sheets and loan repayment tables.
- Stress testing for raw milk price increases, powder price falls, capacity utilisation shortfalls and energy-cost shocks is critical to demonstrate project resilience during bank appraisal.
- This article is written by CA Manish Gugliya, FCA, from a practical Indian DPR and bank-loan appraisal perspective, guiding promoters on preparing bankable, defensible projections.
Introduction: Financial Projections for a Milk Powder Plant in India
Milk powder plant financial projections are the numerical backbone of every Detailed Project Report submitted to Indian banks for SMP, WMP and dairy whitener projects. Whether you are planning a greenfield skimmed milk powder unit in Gujarat or expanding a whole milk powder line in Maharashtra, your lender will evaluate your project primarily through projected financial statements covering FY 2026–27 through FY 2035–36.
These projections form a core part of a manufacturing plant project report and CMA Data, helping assess viability, bankability and risk for both term loan and working capital. The global milk powder market was valued at USD 38.47 billion in 2025 and is expected to reach USD 61.76 billion by 2034, underscoring the commercial opportunity-but opportunity alone does not make a project bankable.
This article is written by CA Manish Gugliya, FCA, with hands-on experience preparing milk powder plant DPRs and CMA Data for bank loans across states like Gujarat, Rajasthan, Uttar Pradesh and Maharashtra. The focus here is on constructing a realistic Milk Powder Manufacturing Financial Model-not on offering generic profitability claims. Wherever rupee figures or margins appear, they are illustrative assumptions for understanding projection structure, not quotes, guarantees or financial advice.
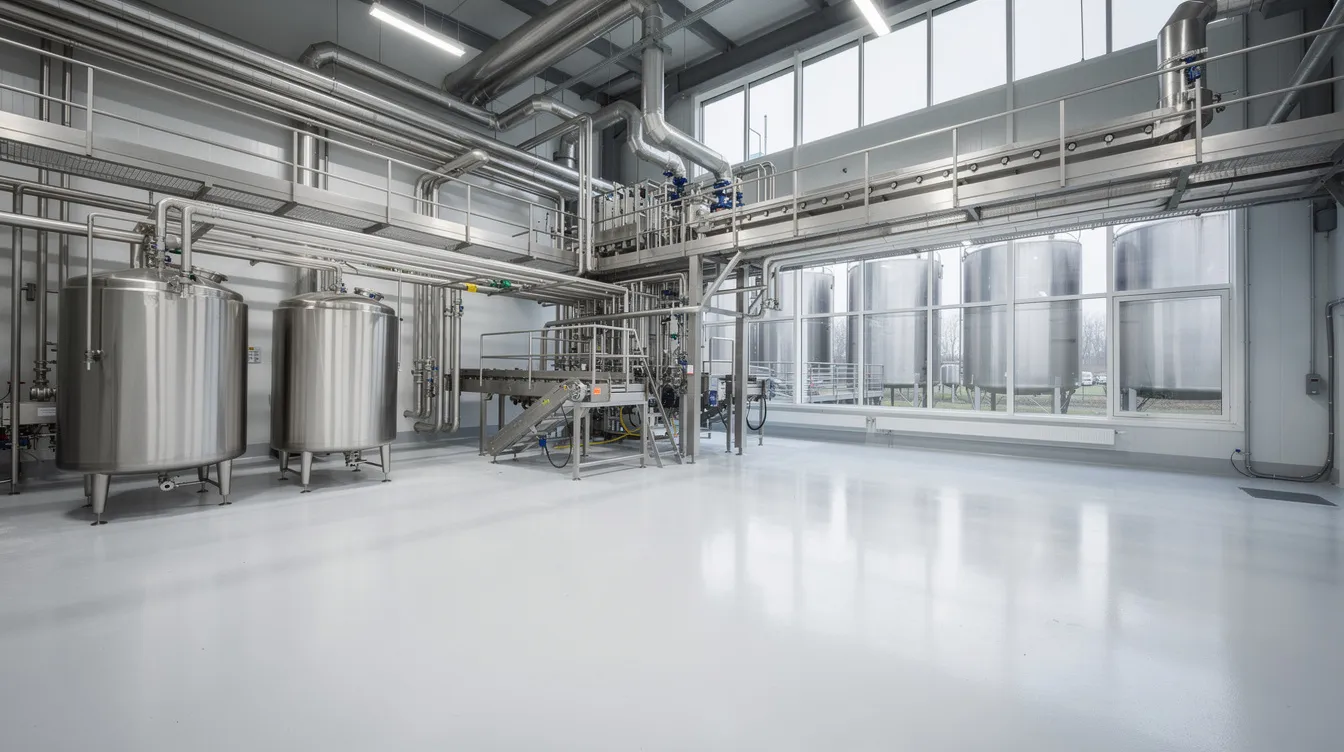
Role of Financial Projections in a Milk Powder Plant DPR
In a detailed project report, financial projections convert technical and market assumptions into numbers that banks, investors and promoters can evaluate. Without these projections, the narrative on plant design, milk procurement, utilities and market demand remains just a story.
A milk powder DPR typically includes these financial components:
- Projected Profit and Loss Account (5–10 years)
- Projected Balance Sheet
- Projected Cash Flow Statement
- Term-loan repayment schedule
- DSCR calculation (year-wise and average)
- Break-even analysis
- Sensitivity and stress-test scenarios
These projections help promoters judge whether a planned capacity-say 10 MT/day of milk powder production-and an initial investment of ₹35–40 crore can generate adequate operating margins and cash accrual. Government incentives (including those under the PLI scheme for food processing), depreciation benefits and interest subsidies should be explicitly reflected where applicable, not added as vague footnotes.
Banks view a milk powder DPR as incomplete if the engineering narrative does not reconcile with the projected financial statements.
Why Banks Scrutinise Milk Powder Plant Financial Projections
Indian banks use projections to assess repayment capacity, DSCR adequacy, working-capital cycles and promoter skin-in-the-game. For term-loan appraisals on milk powder plants-typically ₹15–60 crore-lenders require 5–10 year financial projections, with Year 1 often modelled as a ramp-up period.
Credit officers internally stress-test key assumptions: milk procurement price, powdered milk selling price, power cost and production capacity utilization. They compare these against market data and leading milk powder manufacturers’ benchmarks. India’s SMP production alone is forecast at approximately 790,000 metric tonnes in 2026.
Milk Powder Plant CMA Data submitted for cash-credit limits must align line-by-line with the main projections in the DPR. Inconsistent or overly optimistic assumptions-such as 95% capacity utilisation from day one, abnormally low energy costs, or selling prices well above the competitive landscape-are red flags that experienced credit officers identify quickly.
A small plant setup typically takes 12–18 months from sanction to operation, and banks factor this timeline into their cash-flow assessment.
Building Blocks: Key Technical and Commercial Assumptions
A robust Milk Powder Manufacturing Financial Model starts with plant and process assumptions-capacity, yield and product mix-before moving to revenue and cost projections.
Specific assumptions to define upfront:
- Plant capacity (e.g., 10 MT/day powder output)
- Number of operating days per year (e.g., 300, accounting for maintenance and seasonal shutdowns)
- Shift pattern (typically 2–3 shifts for continuous spray drying operations)
- Capacity utilisation ramp-up over 5 years
- Product mix among SMP, WMP and dairy whitener
- Manufacturing process flow and unit operations involved
Technical capacity assumptions should align with data from a capacity-planning study. The milk-to-powder yield-litres of raw milk per kg of finished powder-is a critical variable. Skimmed milk powder production requires approximately 7.5 to 9.2 litres of milk per kg of powder produced, depending on SNF content and seasonal variation.
Product mix assumptions (e.g., 70% SMP, 20% WMP, 10% dairy whitener) directly affect average selling price, raw material consumption and gross profit margins. Selling prices must be benchmarked against current market trends and price trends, not assumed arbitrarily high.
High-quality machinery is essential for milk powder production, and site selection must ensure access to raw milk supply and supporting infrastructure.
Plant Capacity, Utilisation and 5–10 Year Production Plan
Capacity utilisation is a central driver of revenue, costs and DSCR. It must be consistent across every projected financial statement-P&L, balance sheet, cash flow and CMA Data.
A milk powder plant typically requires 10,000–20,000 MT annual capacity to achieve efficient plant operations and economies of scale. Below is an illustrative 10 MT/day production plan:
Illustrative 5-Year Production Plan (10 MT/Day Plant, 300 Operating Days)
| Year | Capacity (MT/Year) | Utilisation (%) | Powder Output (MT) |
|---|---|---|---|
| 1 | 3,000 | 50% | 1,500 |
| 2 | 3,000 | 65% | 1,950 |
| 3 | 3,000 | 75% | 2,250 |
| 4 | 3,000 | 85% | 2,550 |
| 5 | 3,000 | 90% | 2,700 |
All figures illustrative only. Actual production depends on raw milk intake, seasonal availability and maintenance schedules.
For larger plants (e.g., 20 MT/day), promoters should consider seasonal variations in milk availability and planned maintenance shutdowns when fixing annual operating days. These assumptions should be cross-checked with a technical consultant’s data.
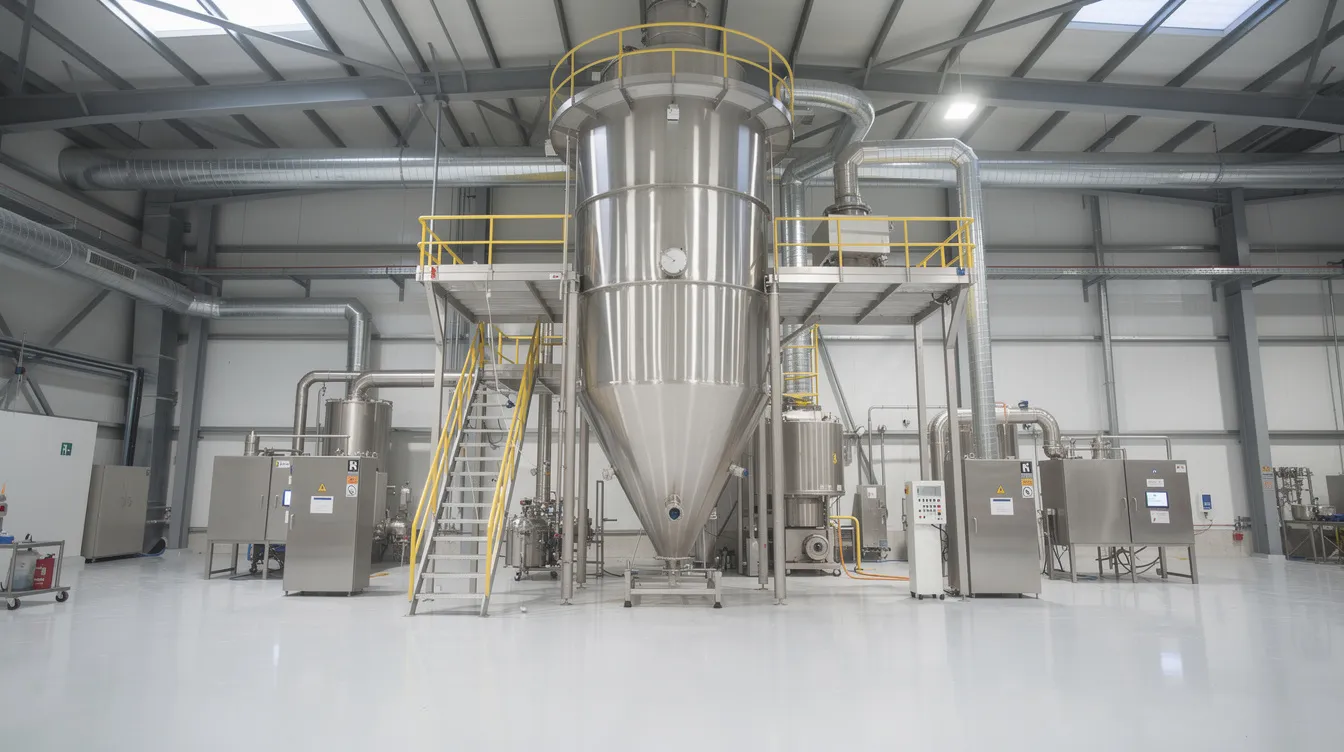
Milk Procurement, Yield and Product Mix Assumptions
Milk procurement is the single largest cost in any milk powder manufacturing business. Raw milk accounts for 75–85% of total operating expenses in production, making procurement planning critical.
Procurement must be planned geographically-sourcing from district cooperatives or village collection centres within a practical radius. Illustrative procurement price assumptions for 2026–27 might range from ₹34–₹40 per litre for fresh milk, with seasonal fluctuations of 8–15% between flush and lean periods.
Illustrative Milk-to-Powder Yield by Product
| Product | Litres of Raw Milk per Kg Powder | Key Variable |
|---|---|---|
| Skimmed Milk Powder (SMP) | 8.0–9.2 | SNF content (12–13%) |
| Whole Milk Powder (WMP) | 7.5–8.0 | Fat + SNF content |
| Dairy Whitener | 7.0–8.5 | Sugar/ingredient addition |
Yield depends on milk solids, fat content and manufacturing process efficiency.
For detailed procurement strategy, refer to the guidance on milk procurement and raw material planning. Plants focusing on skim milk powder manufacturing alone may align assumptions with a specialised SMP manufacturing DPR. Where WMP share is significant, fat standardisation and by-product cream sales should be explicitly modelled using WMP manufacturing plant economics.
Sales Realisation, Market Trends and Revenue Projections
Revenue projections must be grounded in product-wise volumes and realistic selling prices. The milk powder market in India is estimated at approximately ₹25,900 crore (FY2026), with forecast growth at a CAGR of about 11.8%. Demand for skimmed milk powder is growing at 8–12% annually. Revenue models should consider product tiering between B2B and B2C markets.
Milk powder conversion can lower transport costs by 60–70% per kg compared to liquid milk, and the long shelf life-increasing from days to 18–24 months-creates flexibility in sales timing.
Illustrative Year 3 Revenue Projection (10 MT/Day Plant)
| Product | Volume (MT) | Avg. Realisation (₹/kg) | Revenue (₹ Lakh) |
|---|---|---|---|
| SMP | 1,575 | 300 | 4,725 |
| WMP | 450 | 340 | 1,530 |
| Dairy Whitener | 225 | 380 | 855 |
| Total | 2,250 | 7,110 |
All figures illustrative. Domestic vs export sales, bulk vs retail packaging, and institutional vs B2C channels attract different price points.
Selling-price escalation should be modest (3–5% per annum), consistent with cost inflation assumptions. For deeper revenue analysis, refer to milk powder plant revenue model and profitability.
Operating Cost Assumptions: Raw Materials, Utilities, Labour and Overheads
Detailed cost analysis is central to any manufacturing plant project report. Milk powder manufacturing plants have tight operational margins, making accurate cost estimation non-negotiable. Operating costs include raw materials, utilities and maintenance as primary heads.
Major cost heads to model:
- Raw milk and raw materials: procurement, cream/fat adjustment, sugar and ingredients (for dairy whitener)
- Packing materials: poly pouches, laminated pouches, nitrogen-flushed tins, corrugated boxes-packaging materials for milk powder include nitrogen-flushed tins to prevent moisture absorption
- Power and energy: electricity for refrigeration, evaporation, spray drying; energy consumption is a major cost driver in production
- Steam/fuel: coal, briquettes or natural gas for boilers
- Labour and salaries: operators, quality control staff, packaging line workers; statutory compliances (PF, ESI, bonus)
- Repairs and maintenance, testing, transport, distribution costs, marketing and admin overheads
Illustrative Year 1 Cost Structure (% of Net Sales)
| Cost Head | % of Net Sales |
|---|---|
| Raw milk and raw material costs | 65–72% |
| Utilities (power, steam, water, ETP) | 8–12% |
| Packing materials | 3–4% |
| Labour and salaries | 4–6% |
| Repairs, testing, overheads | 3–5% |
| Selling and admin expenses | 2–3% |
Energy costs should reflect local tariffs. A modern milk powder plant’s electricity demand runs approximately 180–220 kWh per MT of powder. Detailed utilities planning should reference milk powder plant utilities guidance for energy efficiency benchmarks.
Regulatory standards for food safety must be met in milk powder production, necessitating quality control lab equipment and regular testing expenses in the cost model.
Capital Expenditure (CapEx), Fixed Assets and Project Cost
Capital expenditure for a milk powder manufacturing unit includes land, site development, civil construction, plant and machinery, utilities, electrification, preoperative expenses and contingencies. Estimates suggest total investment for a milk powder plant can range significantly based on capacity and automation levels. A modern milk powder plant can cost between ₹50–80 lakhs for smaller equipment modules, while a full-scale 10–15 MT/day facility may require ₹15–40 crore depending on scope.
Illustrative CapEx Breakdown (10 MT/Day SMP Plant)
| Head | Approx. % of Total Project Cost |
|---|---|
| Land and site development | 8–12% |
| Civil construction | 15–20% |
| Plant and machinery (spray dryer, evaporators, pasteurisers, packaging line) | 40–50% |
| Utilities (boiler, refrigeration, ETP, water treatment) | 8–12% |
| Electrification and instrumentation | 4–6% |
| Preoperative expenses and contingencies | 5–8% |
All percentages illustrative. See detailed machinery and equipment costing for specifics.
The means of finance typically follows a 70:30 debt-equity structure for projects above ₹10 crore. Detailed structuring-including promoter contribution, term loan, subsidies and working-capital margin-is covered in the guidance on project cost and means of finance. Government incentives support dairy processing under the PLI scheme and other food processing industry programmes.
The payback period for milk powder production facilities generally ranges from 3 to 8 years, with a modern plant’s capital investment often recoverable in 4–5 years at steady-state utilisation. The IRR for milk powder projects is crucial for investment evaluation alongside net present value.
Over- or under-estimation of capital expenditure directly affects depreciation, interest, DSCR and balance-sheet strength throughout the projection horizon. The initial investment for a milk powder plant is significant and must be planned with verified quotations.
Working Capital, Inventory and Cash-Cycle Assumptions
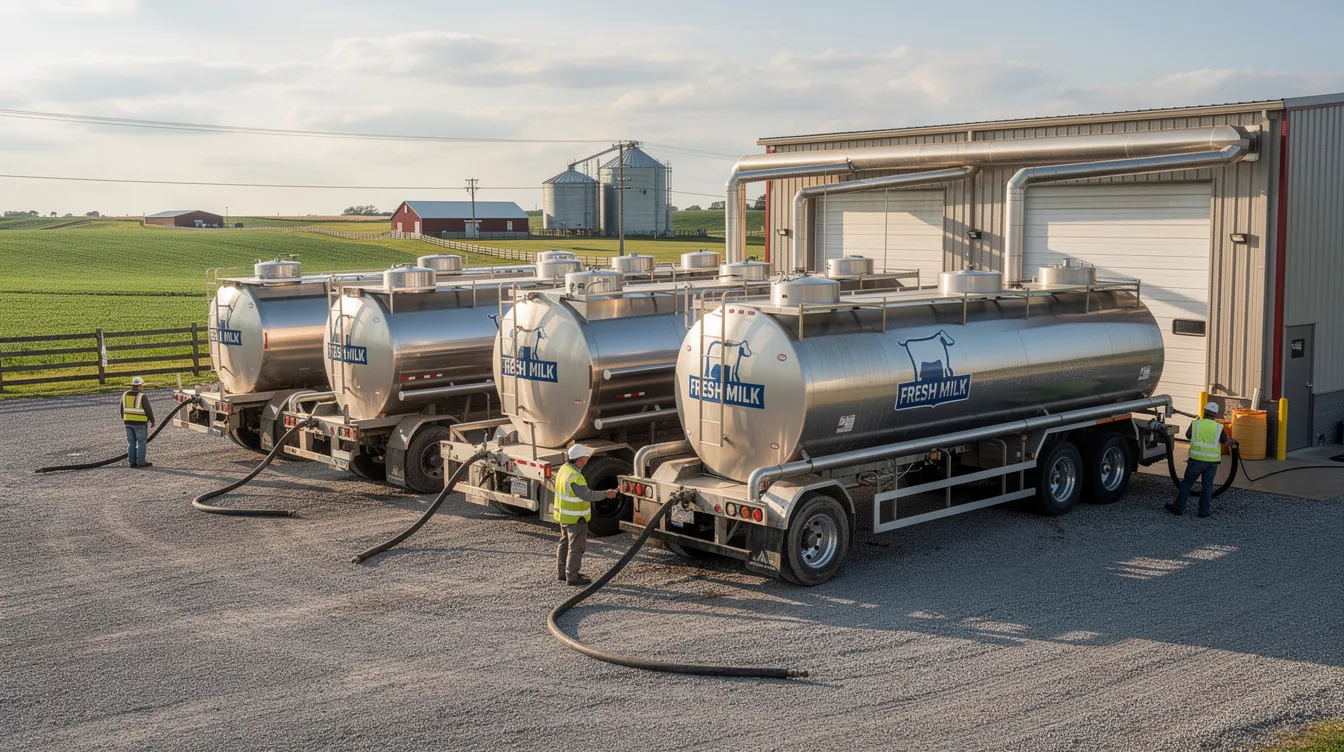
Milk powder plants are working-capital-intensive. Raw milk must be paid for within 7–10 days while finished goods may be sold on 30–60 day credit terms. Working capital is essential for managing continuous raw milk procurement in milk powder production.
Key drivers requiring assumptions:
- Raw-milk payment cycle: 7–10 days to farmers/cooperatives
- Finished-goods inventory holding: 15–30 days (milk powder has a longer shelf life than liquid milk, impacting inventory holding costs)
- Receivables period: 30–45 days for institutional sales, 15–30 days for distributors
- Creditors for packing materials and fuel: 15–30 days
Illustrative Working-Capital Computation (Year 3)
| Component | Days | Amount (₹ Lakh) |
|---|---|---|
| Raw milk and material inventory | 10 | 130 |
| Finished goods inventory | 20 | 390 |
| Receivables | 35 | 682 |
| Less: Creditors | 15 | (145) |
| Net Working Capital | 1,057 |
Illustrative only. Seasonal stock build-up during flush and liquidation in lean months widens the cash conversion cycle.
These assumptions must be fully aligned with the Milk Powder Plant CMA Data submitted for sanction of cash-credit and packing-credit limits.
Projected Profit & Loss Account for a Milk Powder Plant
The Milk Powder Plant Projected Profit and Loss statement should cover at least 5 years (preferably 7–10) and show evolution from initial ramp-up losses to stable operating margins.
Key line items: gross sales, net sales after GST, cost of goods sold (raw milk, ingredients, packing), manufacturing expenses (power, fuel, utilities), employee costs, administrative and selling expenses, EBITDA, depreciation, interest, PBT, tax and PAT.
Illustrative Year 3 Profit & Loss Summary (10 MT/Day Plant)
| Line Item | ₹ Lakh | % of Net Sales |
|---|---|---|
| Net Sales | 7,110 | 100% |
| Cost of Goods Sold | 5,120 | 72% |
| Gross Profit | 1,990 | 28% |
| Operating Expenses | 640 | 9% |
| EBITDA | 1,350 | 19% |
| Depreciation | 320 | 4.5% |
| Interest | 280 | 3.9% |
| PBT | 750 | 10.6% |
| Tax (25%) | 188 | 2.6% |
| PAT | 562 | 7.9% |
All figures illustrative. Actual margins depend on procurement, realisation and utilisation.
Milk powder manufacturing can achieve gross profit margins of 20–30%, and gross profit margins in milk powder production generally range between 15% to 27% depending on product mix, scale and procurement efficiency. Net profit margins typically hover between 3% to 12% after accounting for operational overheads-these are tight operational margins characteristic of the milk powder industry.
EBITDA margins should stay within realistic industry ranges (mid-teens for commodity segments). Projections are based on assumptions provided by the promoter and prevailing market conditions, not guaranteed profitability.
Projected Balance Sheet: Capital Structure and Asset Build-Up
The projected balance sheet captures financial position at year-end, reconciling fixed and variable costs, assets, liabilities and equity.
Key asset heads:
- Gross block of fixed assets, accumulated depreciation, net block
- Capital work-in-progress (initial years)
- Inventories, receivables, cash and bank balances, loans and advances
Key liability and equity heads:
- Share capital / promoter contribution
- Reserves and surplus (retained earnings from PAT minus drawings)
- Term-loan outstanding (must match repayment schedule)
- Working-capital limits (cash credit, WCDL)
- Trade creditors and other current liabilities
Retained earnings each year must reconcile with PAT minus dividends or drawings, and term-loan outstanding must match the repayment schedule used in the DSCR calculation. By Year 5, the illustrative balance sheet should show net worth growing as profits are retained and loans are repaid-demonstrating improving financial health to the lender.
Projected Cash Flow Statement and Cash Accrual
Cash-flow projections matter because loan instalments are paid from cash, not from accounting profit.
The standard three-part structure applies:
- Operating activities: EBITDA, working-capital changes, taxes paid
- Investing activities: capital expenditure, asset disposals
- Financing activities: loan disbursement, principal repayment, interest, equity infusion
In banking terminology, “cash accrual” typically means PAT plus depreciation. For a year where PAT is ₹562 lakh and depreciation is ₹320 lakh, cash accrual would be ₹882 lakh. If term-loan principal repayment for that year is ₹400 lakh and interest is ₹280 lakh, total debt service equals ₹680 lakh-leaving a comfortable surplus.
Front-loaded CapEx or delayed commissioning can create negative cash flows even when the projected P&L looks attractive. Timing must be modelled carefully, especially during the construction and trial-production phase.
Depreciation Policy and its Impact on Profitability
Depreciation is a non-cash expense but materially impacts reported profit, tax liability and net worth. Depreciation rates should follow Schedule II of the Companies Act, 2013 or applicable Income Tax Act rates.
For equipment like spray dryers and evaporators, useful life is typically 15–20 years. Higher initial depreciation on major machinery reduces PAT in early years but improves cash flows by lowering tax outgo. Banks focus on cash accrual and DSCR more than accounting PAT-but sustained accounting losses still raise viability concerns.
For asset classification and useful-life assumptions, refer to machinery and equipment costing guidance. Equipment costs should be properly categorised between plant and machinery, furniture and fixtures, and vehicles, each with different depreciation rates.
Interest, Moratorium and Term-Loan Repayment Schedule
Term-loan interest is computed on outstanding principal, typically with monthly or quarterly rests. Projections must match the sanction terms quoted by the lender.
Many milk powder projects receive a moratorium on principal repayment of 6–18 months after disbursement, during which only interest is serviced. This must be explicitly shown.
Illustrative Term-Loan Amortisation (First 3 Years)
| Year | Opening Principal (₹ Lakh) | Repayment (₹ Lakh) | Closing Principal (₹ Lakh) | Interest @ 10% (₹ Lakh) |
|---|---|---|---|---|
| 1 (Moratorium) | 2,100 | 0 | 2,100 | 210 |
| 2 | 2,100 | 300 | 1,800 | 195 |
| 3 | 1,800 | 350 | 1,450 | 163 |
Illustrative only. Banks usually insist on equated or stepped instalments matched to cash-flow build-up.
Interest subsidies (under food processing or dairy schemes) should be treated prudently-shown transparently, not as hidden margin boosters.
DSCR (Debt Service Coverage Ratio) and Its Role in Bank Appraisal
DSCR is defined as:
DSCR = (PAT + Depreciation + Interest) ÷ (Principal Repayment + Interest)
Banks typically look for a minimum average DSCR of 1.4–1.6 over the loan tenure, with no single year falling below approximately 1.1–1.2.
Illustrative DSCR Calculation
| Year | PAT (₹ Lakh) | Depreciation | Interest | Total Numerator | Principal + Interest | DSCR |
|---|---|---|---|---|---|---|
| 2 | 320 | 320 | 195 | 835 | 495 | 1.69 |
| 3 | 562 | 320 | 163 | 1,045 | 513 | 2.04 |
| 4 | 680 | 300 | 130 | 1,110 | 480 | 2.31 |
Illustrative only. All inputs must tie back to P&L and loan schedule.
Artificially inflating capacity utilisation or understating costs to push DSCR above 2.0 will not withstand scrutiny. DSCR is a key metric in Milk Powder Plant Financial Projections for bank loan approval and should be central to the promoter’s own risk assessment.

Break-Even, Sensitivity and Stress Testing
Beyond base-case projections, a bankable Milk Powder Manufacturing Financial Model must show how the project behaves under stress. Break-even analysis is critical for determining capacity utilization required to cover fixed overheads in milk powder production.
Break-even analysis: In most SMP projects, break-even occurs when capacity utilisation reaches approximately 60–65% of installed capacity, where contribution covers all fixed costs.
Key sensitivity variables:
- Raw milk purchase price increase
- Powder selling-price reduction
- Energy tariff changes
- Capacity utilisation drop
- Delay in achieving target product mix
Illustrative “What-If” Scenarios
| Scenario | Impact on Year 3 EBITDA | Impact on DSCR |
|---|---|---|
| Raw milk price +5% | EBITDA drops ~₹260 lakh (−19%) | DSCR drops from 2.04 to ~1.52 |
| SMP selling price −5% | EBITDA drops ~₹236 lakh (−17%) | DSCR drops to ~1.48 |
| Capacity utilisation at 65% vs 75% | EBITDA drops ~₹180 lakh (−13%) | DSCR drops to ~1.60 |
Sensitivity analyses should account for key factors like milk prices and powder yields in milk powder production models. Banks are especially cautious post-2020 about commodity-price and energy-cost volatility.
CMA Data Requirements for a Milk Powder Plant
CMA (Credit Monitoring Arrangement) Data is the structured financial format required by Indian banks for working-capital appraisal and renewal. It must fully align with the DPR projections.
Key CMA forms typically include:
- CMA-1: Operating statement / P&L (past, current, projected)
- CMA-2: Balance sheet analysis
- CMA-3: Fund flow statement
- CMA-4: Computation of working-capital limits (inventory, receivables, creditors)
- CMA-5: Assessment of fund-based limits
- CMA-6: Key financial ratios
Milk-powder-specific elements in CMA Data include seasonal inventory build-up, export receivables (if applicable), farmer payment cycles and dependence on institutional buyers.
Errors like mismatched sales figures, inconsistent working-capital numbers and incorrect term-loan balances between CMA and DPR are among the most common rejection triggers. Tailored Milk Powder Plant CMA Data is an integral part of the overall Milk Powder Plant Financial Projections for bank loan sanction.
Reconciling Technical, Operational and Financial Numbers in a Bankable DPR
A bankable DPR is one where engineering, operations and finance all tell the same story numerically. The following reconciliations must be demonstrable:
- Milk input vs powder output: litres procured must match yield assumptions and production tonnage
- Installed capacity vs utilisation vs production: a 10 MT/day plant at 75% utilisation cannot show 2,500 MT output per year unless operating days support it
- Product mix vs weighted-average selling price: revenue must reflect the actual SMP/WMP/dairy whitener split
- Operating margin vs cash accrual and DSCR: EBITDA and PAT must flow correctly into DSCR
- Working-capital requirement vs cash-conversion cycle: CMA Data must reflect real credit and inventory days
- Loan repayment vs projected cash flows: no year should show negative cash after debt service without explanation
For example, if the production plan shows 2,250 MT of powder in Year 3, but the revenue schedule reflects 2,400 MT of sales (excluding any opening stock), this mismatch will immediately raise questions. Such errors are surprisingly common and easily avoidable with careful cross-checking.
For integrated dairy setups with liquid milk, curd and ghee alongside powder, reconcile with dairy processing plant financial projections to ensure product-wise financials are consistent.
“As a Chartered Accountant preparing DPRs and CMA Data for dairy projects, I recommend finalising technical assumptions, procurement economics and market realisation before preparing projected financial statements.”
Common Mistakes in Milk Powder Plant Financial Projections
Based on practical experience with dairy financial analysis, here are frequent errors:
Operational mistakes:
- Assuming 85–95% capacity utilisation from Year 1 (realistic: 50–65%)
- Underestimating raw milk procurement price or ignoring seasonal milk availability
- Overstating selling prices relative to leading milk powder manufacturers and the competitive landscape
- Omitting maintenance or seasonal shutdown days from the production plan
Accounting mistakes:
- Misclassifying capital expenditure as revenue expense
- Using unrealistic depreciation rates not aligned with Companies Act or IT Act
- Ignoring preoperative interest and trial-run expenses
- Double counting subsidies or incentives in both CapEx reduction and revenue
Working-capital mistakes:
- Assuming zero or negligible inventory days
- Projecting tight receivable assumptions without institutional contracts as support
- Ignoring the need for margin money on bank limits
Projections reverse-engineered to show an attractive DSCR, without operational backing, are quickly identified by experienced credit officers and undermine promoter credibility.
Practical Checklist Before Submitting Projections to a Bank
- ✅ Capacity, production and sales volumes are consistent and feasible across all statements
- ✅ Milk procurement volumes, prices and logistics validated with local cooperative or trader data
- ✅ Product mix reconciled with realistic market demand for SMP, WMP and dairy whitener
- ✅ Equipment costs verified with actual quotations from machinery suppliers
- ✅ CapEx, depreciation and term-loan amounts consistent across all schedules
- ✅ CMA Data tallies with DPR projections line by line
- ✅ DSCR calculated correctly and remains acceptable under modest stress scenarios
- ✅ Sensitivity analysis for at least ±5% change in milk cost, selling price and utilisation
- ✅ Regulatory approvals, quality assurance criteria and BIS/FSSAI compliance factored into costs
- ✅ Supporting documents attached: machinery quotations, utility-tariff letters, milk procurement MOUs, market survey data
Projections are decision-support tools, not just formalities to “qualify” for a loan.

Author’s Note and Professional Support
I prepare Milk Powder Plant Financial Projections, DPRs and CMA Data based on assumptions, market information and technical inputs provided by the promoter and available research. These are not certified future results or guarantees of profitability.
If you are planning a new milk powder manufacturing plant-or expanding an existing dairy processing facility-I can assist with:
- Customised Milk Powder Manufacturing Financial Models
- Comprehensive manufacturing plant project report (DPR) with financial analysis
- Detailed Milk Powder Plant CMA Data for bank loan proposals
- Projected Profit and Loss, Balance Sheet, Cash Flow and DSCR workings aligned with bank formats
Serious promoters should compile basic project details-location, proposed capacity, target markets, preliminary quotations-before approaching for customised financial modelling. This ensures the projections reflect your specific dairy products, processed foods mix, ready to eat meals potential (if applicable), infant nutrition applications and regional raw milk economics.
FAQ – Milk Powder Plant Financial Projections
These questions address practical doubts commonly raised by first-time dairy entrepreneurs, FPOs and promoters entering the milk powder industry.
How many years of projections should I prepare for a milk powder plant loan proposal?
Indian banks typically expect at least 5 years of detailed projections, with some lenders preferring 7–10 years for large-capacity spray drying projects. For term loans with 7–9 year tenures, projections should cover the full repayment period so DSCR can be evaluated across all years. Past 3 years’ actuals (if available) plus 5–7 years’ projections form the standard package for project finance and CMA Data.
Can I use the same financial model for both a milk powder plant and a broader integrated dairy project?
While the same base Excel model structure can be adapted, assumptions for product mix, yields, pricing and working-capital cycle differ between a stand-alone milk powder plant and an integrated dairy processing operation covering liquid milk, curd and ghee. Create separate but linked modules so that milk powder manufacturing’s specific costs and margins remain visible, while reconciling with the overall integrated projections.
How frequently should I update my milk powder plant financial projections once operations start?
During the first 2–3 years, projections should be reviewed at least annually-and preferably every 6 months-to reflect actual milk procurement prices, selling prices and capacity utilisation. For working-capital renewal, banks often ask for revised CMA Data incorporating the latest audited figures. Track actual vs projected performance monthly on key KPIs: capacity utilisation, milk cost per kg powder, energy cost per kg powder, and distribution costs.
Are government subsidies or incentives always included in DSCR calculations?
While capital subsidies and interest subsidies can improve cash flows, banks may adopt a conservative approach and not fully factor uncertain incentives when assessing DSCR. Model two scenarios: one including expected subsidies and one without. This demonstrates that the food processing business remains fundamentally viable even if incentives are delayed. Document specific scheme names, sanction letters and timelines where subsidies are assumed.
What if my projected DSCR is slightly below the bank’s comfort range?
Minor shortfalls in DSCR can sometimes be addressed by adjusting project parameters: increasing promoter margin, slightly resizing capacity, optimising CapEx, or stretching the loan tenure within policy limits. DSCR improvement should come from genuine structural adjustments-a realistic capacity ramp-up plan, better procurement strategy or a validated production process-not from artificially inflated selling prices or suppressed cost assumptions. Discuss options transparently with a professional advisor and the lending bank.