Key Takeaways
- Annual revenue of a milk powder plant is calculated as saleable quantity × average net selling price, but actual profit depends heavily on raw milk procurement cost, powder recovery, capacity utilisation and product mix.
- Raw milk procurement typically accounts for 75–85% of operating expenses, making even a ₹1–2 per litre change in milk price a significant margin mover.
- Milk powder plant profitability in India varies widely by region, season and management quality; margins cannot be copied from generic industry numbers or competitor brochures.
- Product diversification across skimmed milk powder, whole milk powder, dairy whitener, ghee and butter strengthens revenue stability far more than dependence on a single commodity line.
- A detailed, project-specific DPR and financial model – not a downloaded template – is necessary for serious entrepreneurs, lenders and investors to judge viability and loan serviceability. In over 20 years of preparing DPRs and CMA data for dairy projects, I have consistently seen that projects grounded in realistic assumptions outperform those built on optimism.
Introduction: Why the Milk Powder Plant Revenue Model Matters Before You Invest
Understanding the milk powder plant revenue model is the single most important exercise before committing large capital to a dairy processing project. High sales turnover in a milk powder manufacturing plant does not automatically translate into high profit. Milk procurement cost, energy consumption, capacity utilisation, powder yield, product mix and selling prices can each change your margin by several percentage points – and they frequently move in unfavourable directions simultaneously.
In the Indian context of 2026, milk powder manufacturing is a volume-driven business where small changes matter enormously. A ₹1–2 per litre shift in raw milk price or a ₹5–10 per kg movement in powder selling price can alter annual profitability by tens of lakhs, sometimes crores, depending on plant scale. The global milk powder market was valued at USD 38.47 billion in 2025, and the market is expected to reach USD 61.76 billion by 2034, with demand for milk powder growing at 8–12% per annum. These numbers signal opportunity, but opportunity without rigorous financial analysis is speculation.
Every milk powder manufacturing business is unique. Profitability must be assessed through a customised DPR and financial model rather than generic “20–30% margin” claims from the milk powder industry. A professional manufacturing plant project report aligns capacity, revenue expectations, cost analysis and financing structure with realistic market trends – and that is where sound investment decisions begin.
How a Milk Powder Plant Generates Revenue: Core Revenue Formula
The core revenue formula for any milk powder plant is straightforward:
Annual Revenue = Saleable Production Quantity (kg) × Average Net Selling Price (₹/kg)
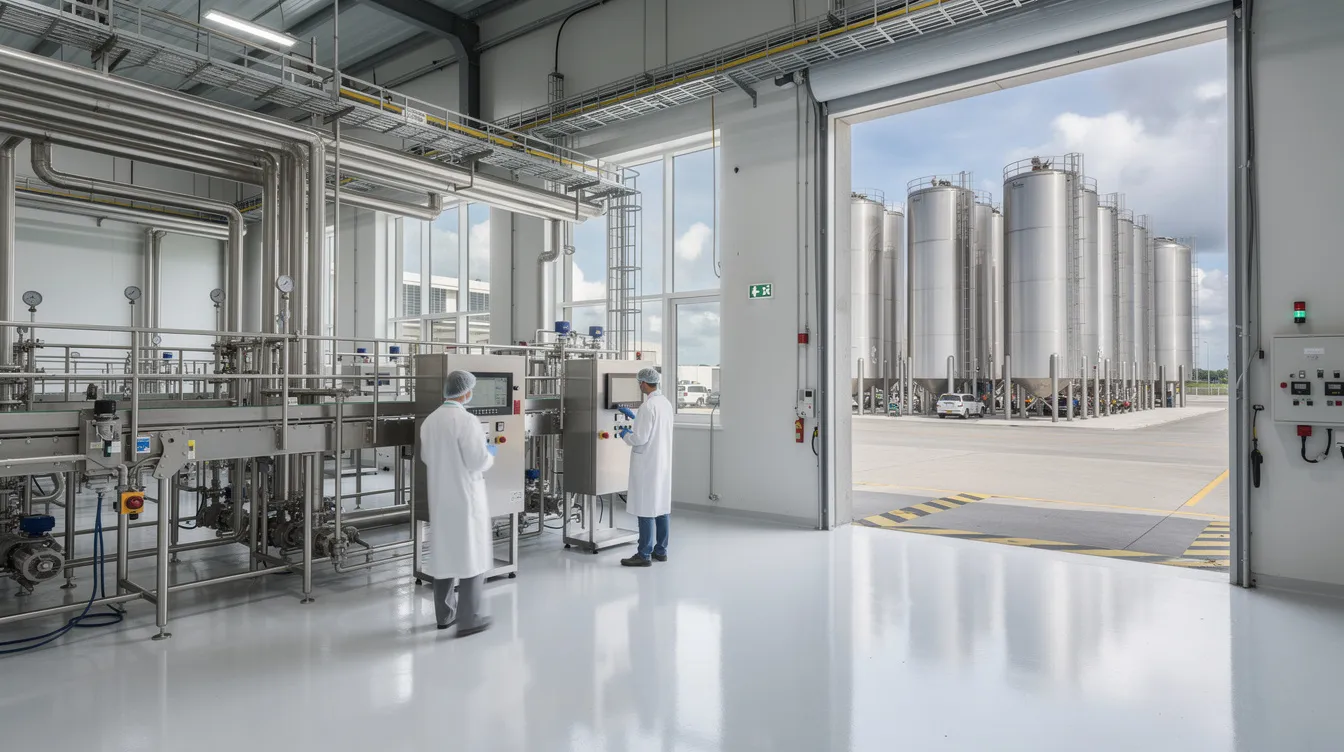
This applies across the entire product basket – SMP, WMP, dairy whitener, ghee, butter and any other saleable output. A milk powder production plant operates on a continuous-processing business model, and revenue accumulates across multiple product lines simultaneously.
However, the simplicity of the formula hides the complexity of its components:
- Installed capacity (expressed in LPD, LLPD or TPD) is not the same as actual milk processed per day, which depends on procurement availability and operational readiness.
- Saleable powder output is lower than theoretical output because of process losses, moisture adjustments and quality rejections.
- Capacity utilisation directly determines how much of the installed capacity actually generates revenue. A plant with 1,000 litres/hour capacity can achieve 18–24% gross margin only when utilisation, recovery and pricing align favourably.
- Milk solids and fat content in procured milk govern how many kilograms of powder and how much fat can be recovered per litre.
- By-product realisation from cream, butter, ghee and whey solids contributes meaningfully to total revenue and must not be treated as incidental.
- Net selling price differs from gross price once you deduct trade discounts, freight borne by the seller, GST adjustments and channel-specific margins.
For sound milk powder plant revenue calculation, installed capacity, actual utilisation and product yield must be modelled separately for each product line and customer segment.
Principal Revenue Streams in a Milk Powder Manufacturing Plant
A modern milk powder manufacturing plant in India rarely depends on a single product. Diversified revenue streams help stabilise profitability against commodity price swings and seasonal demand shifts.
Major revenue streams include:
- Skimmed milk powder (SMP) – bulk commodity for institutional, industrial and export buyers
- Whole milk powder (WMP) – retains milk fat, used in recombined milk, confectionery, bakery and consumer packs
- Dairy whitener – formulated product with higher retail margins
- Butter, white butter and ghee – high-value fat products recovered during SMP production
- Cream – sold fresh or converted into value-added dairy products
- Contract manufacturing and private-label production – toll-processing for FMCG brands, typically paid per kg of powder or per tonne of liquid milk processed
- Export sales – SMP and specialty powders shipped to deficit markets, subject to quality certifications and international price trends
Product diversification includes selling bulk skimmed milk powder and whole milk powder to food manufacturers, while exports can balance domestic demand for milk powder and mitigate risks associated with local market fluctuations. Milk powder can lower transport costs by 60–70% per kg compared to liquid milk, making it inherently suited for long-distance trade and storage.
The revenue model design must clearly define what proportion of capacity goes into bulk commodity powders versus higher-value products and services.
Revenue Model for Skimmed Milk Powder (SMP) Manufacturing
In an SMP-focused plant, milk fat is removed as cream or white butter, and the remaining skim milk is concentrated and spray dried into powder. The typical conversion requires approximately 7.5–8.5 litres of milk per kg of SMP when milk has around 13% solids-not-fat.
In the milk powder plant revenue model for SMP, both SMP and the separated milk fat must be analysed together. Raw milk is bought as a combination of fat and SNF – ignoring the fat fraction underestimates total realisation. By-product monetization involves selling cream, butter, and anhydrous milk fat obtained during processing, and with wholesale ghee prices averaging approximately ₹402 per kg in India, this revenue component is far from trivial.
Evaluating only SMP selling price against milk procurement cost can be misleading. Securing a reliable milk procurement strategy is vital for controlling primary production costs, and the total realisation from SMP plus ghee or butter must be compared with total input costs to get a true profitability picture.
For detailed SMP-specific DPR guidance, refer to our SMP manufacturing plant project guide.
Revenue Model for Whole Milk Powder (WMP) Manufacturing
Whole milk powder retains milk fat within the powder, resulting in a different yield, energy consumption profile and market positioning compared with SMP. WMP revenue per kg is generally higher due to the embedded fat content, but this means less separate fat-product revenue from ghee or butter.
Institutional and industrial demand for WMP comes from chocolate manufacturers, bakery units, recombined milk processors and ice-cream companies. Consumer packs of WMP target retail markets with higher margins but also higher packaging and distribution costs. Export potential exists, but quality specifications, shelf life management and FSSAI compliance are critical.
Key risk factors for WMP include sensitivity to storage conditions (fat oxidation), fluctuating consumer preference, and the need for strict quality assurance criteria and customer audits. The manufacturing process flow for WMP demands tighter process control than SMP to maintain nutritional value and sensory quality.
For a detailed reference on WMP project planning, see the WMP manufacturing plant project guide.
Revenue Model for Dairy Whitener and Value-Added Powders
Dairy whitener is a formulated product designed for tea and coffee, typically with specified fat–SNF ratios, sometimes with added sugar and stabilisers. It is distinct from commodity milk powder in its market positioning, packaging and pricing structure.
Dairy whitener typically sells at higher per-kg prices due to value addition, branding and retail-friendly packaging. However, this comes with higher packaging cost, marketing expenditure, distributor margins and promotional schemes. Revenue modelling for whitener must factor in MRP structures, trade discounts, GST implications and the difference between ex-factory price and net realisation.
Developing specialty and premium grades of milk powder can differentiate products and increase revenue beyond commodity levels. Innovative packaging formats can enhance the consumer appeal and profitability of milk powder products – think single-serve sachets, resealable pouches or gift packs for seasonal demand.
Flavoured milk powder, premixes and customised blends represent incremental revenue lines for plants with appropriate mixing and packaging line infrastructure.
For whitener-specific DPR insights, visit the Dairy Whitener Manufacturing Plant Project Report.
Product Mix and Customer Segments: Impact on Revenue and Margin
The product mix can dramatically affect profitability in a milk powder production facility. Revenue and margin depend not only on what you produce but on who buys it.
Key customer segments include:
- Integrated dairy companies and food-processing companies
- Bakeries, confectionery and ice-cream manufacturers
- Beverage brands and hotels
- Government and cooperative procurement channels
- Wholesale traders, distributors and retail consumers
- Export buyers
Bulk B2B vs Branded B2C – a quick comparison:
| Parameter | Bulk B2B | Branded B2C |
|---|---|---|
| Selling price per kg | Lower | Higher |
| Packaging cost | Minimal (25-50 kg bags) | Significant (consumer packs) |
| Distribution expense | Low | High |
| Marketing spend | Negligible | Substantial |
| Credit period | 30–60 days typical | Varies; distributor-driven |
| Volume stability | Higher with contracts | Seasonal, brand-dependent |
| Margin potential | Lower per kg, stable | Higher per kg, variable |
Long-term contracts can be secured for institutional supply agreements in the milk powder industry, providing volume predictability. Many new milk powder manufacturing businesses start with bulk B2B sales to stabilise utilisation, and add branded retail later once cash flow and working capital depth support the investment.
Efficient packaging and logistics can significantly impact economics in the milk powder sector, particularly when serving distant or export markets.
Capacity, Yield and Saleable Production: From Milk Input to Powder Output
Installed capacity does not guarantee revenue unless the plant achieves good capacity utilisation and efficient powder recovery. A milk powder plant requires 10,000–20,000 MT capacity depending on the scale of operation and target markets. The step-wise logic for estimating saleable output follows this framework:
- Daily milk intake = installed LPD × capacity utilisation %
- Annual milk processed = daily intake × operating days per year
- Powder recovery = annual milk processed × recovery rate (kg powder per 100 litres)
- Fat recovery = annual milk processed × average fat % × separation efficiency
- Saleable powder output = gross powder produced – process losses (typically 3–5%)
Recovery ratios are not standard across India. They depend on milk composition (fat and SNF content), season, breed, procurement region, target product specifications and process control in the milk powder manufacturing process. Small improvements in SNF-based procurement or efficiency in spray drying technology can meaningfully increase saleable quantity without additional milk volume.
For detailed guidance on linking capacity design with revenue potential, refer to our capacity planning guide.
Illustrative Revenue Calculation for a Milk Powder Plant (Hypothetical)
The following is a purely hypothetical illustration for learning purposes only. It is not a quotation, guarantee or current market benchmark.
Assume a 50,000 LPD (0.5 LLPD) milk powder manufacturing plant producing SMP and separating cream for ghee.
| Parameter | Assumed Value |
|---|---|
| Daily milk intake | 50,000 litres |
| Operating days per year | 300 |
| Capacity utilisation | 80% |
| Annual milk processed | 1,20,00,000 litres (1.2 crore litres) |
| SMP recovery | ~11.5 kg per 100 litres |
| Annual SMP produced | ~13,80,000 kg (1,380 MT) |
| Saleable SMP (after 4% loss) | ~13,25,000 kg |
| Average net SMP selling price | ₹295/kg |
| Annual SMP revenue | ₹39.09 crore |
| Fat/ghee recovered | ~3,60,000 kg |
| Average ghee realisation | ₹395/kg |
| Annual fat/by-product revenue | ₹14.22 crore |
| Total annual revenue | ₹53.31 crore (approx.) |
Each parameter – milk price, powder price, yields, operating days – must be replaced with location-specific and time-specific data from current suppliers and buyers when preparing a real DPR. Actual numbers depend on 2026–27 market conditions, local competitive landscape, and negotiated contracts.
Major Components of Production Cost in a Milk Powder Plant
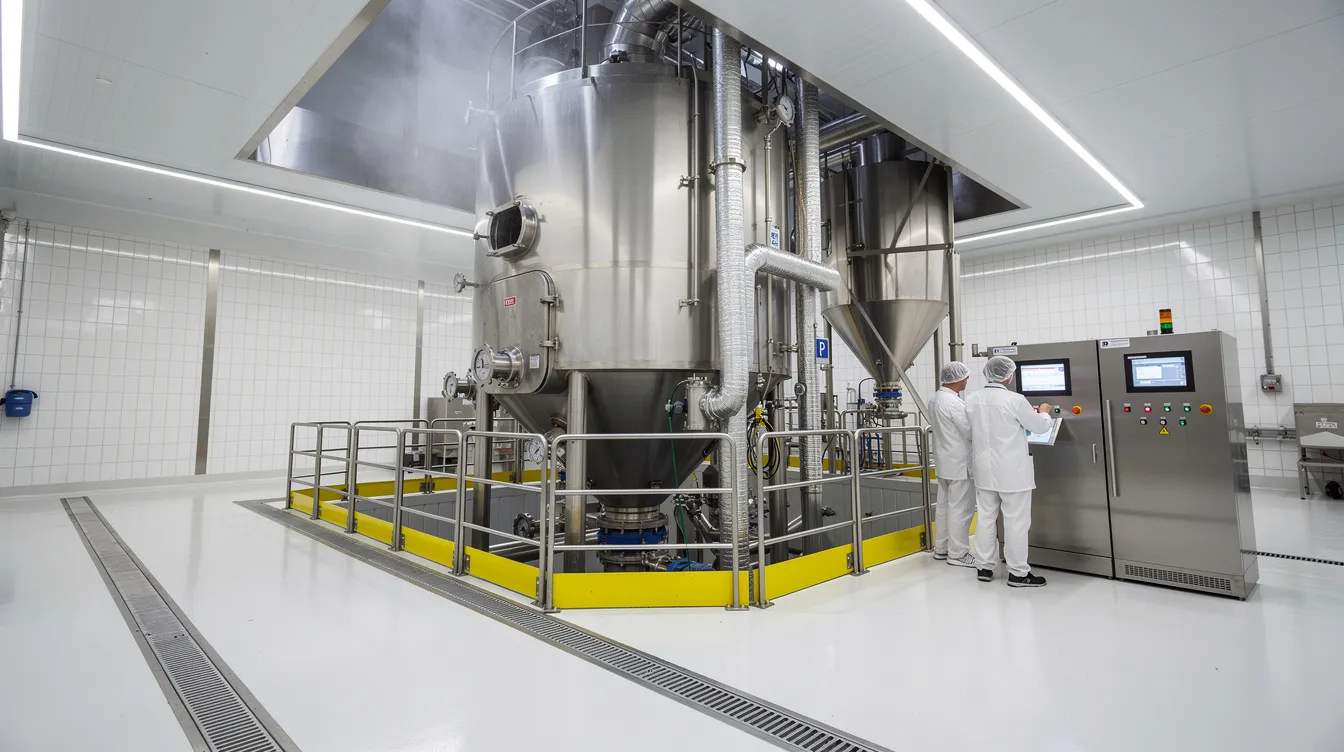
In a typical milk powder manufacturing plant, raw milk is the largest cost component. Raw milk accounts for approximately 75–85% of total operating expenses in production, with some studies placing raw milk purchase at 65–70% of total operating costs when measured against all costs including fixed overheads, depreciation and interest.
Major cost heads include:
- Raw milk procurement – raw material costs dominate; raw material consumption scales linearly with output
- Milk collection, chilling and transportation from collection centres
- Packaging materials – varies sharply between bulk and retail
- Power, steam and fuel – energy expenses in milk powder production are significant due to spray drying; energy costs represent 10–15% of total operational expenses
- Refrigeration and water
- Cleaning chemicals and CIP systems
- Direct and indirect labour – labor costs increase with shift operations
- Repairs, maintenance and quality testing
- Warehousing, distribution and freight – distribution costs affect net realisation
- Administrative overhead, interest and depreciation
Small changes in raw milk procurement price or SNF content have a much larger impact on profit than modest savings in overheads. Multi-effect evaporators and heat recovery systems are energy-efficient technologies that can reduce thermal energy consumption significantly.
For detailed discussions on milk procurement and raw material planning and utilities, refer to our dedicated guides.
Understanding Milk Powder Plant Profitability and Financial Metrics
Profitability in a milk powder manufacturing unit must be understood across multiple layers:
- Contribution per kg = net selling price – variable cost per kg (milk + utilities + packing + direct labour)
- Gross profit = total revenue – total variable costs
- EBITDA = total contribution – fixed operating costs (excluding depreciation and interest)
- EBIT = EBITDA – depreciation
- PBT = EBIT – interest
- PAT = PBT – tax
- Cash accrual = PAT + depreciation
Gross profit margins for milk powder typically range between 20–30%, depending on product mix, procurement efficiency and selling prices. The internal rate of return is crucial for evaluating project viability, alongside net present value and payback period.
Promoters should analyse both rupee profit per kg and total annual profit. A low-margin, high-volume strategy can still yield healthy absolute profit if production capacity utilization is strong. Interest coverage ratio, DSCR and cash-flow position are as important as PAT when lenders evaluate a milk powder manufacturing plant for bank finance.
Key Profitability Drivers in Milk Powder Manufacturing
Profitability in a milk powder manufacturing business is the outcome of several interlinked drivers:
Operational drivers:
- Raw milk purchase price and procurement model (fat-SNF based vs flat-rate)
- Seasonal milk availability and SNF levels
- Powder recovery efficiency and process losses
- Plant capacity utilisation and operating days
- Energy costs per kg of powder – a critical factor in the profitability of milk powder production
- Product mix between SMP, WMP, whitener and fat products
Commercial drivers:
- Mix of bulk versus branded sales and average selling price
- Packaging cost per kg
- Inventory holding period
- Credit period offered to customers
- Financing cost and leverage level
- Scale of operation
Management drivers:
- Quality of milk procurement network and farmer relations
- Technical competence of the production team
- Monthly monitoring of cost-versus-realisation per product
- Milk powder production requires a focus on quality to command higher prices in competitive markets
In DPRs and financial models, these variables should be tested under different scenarios rather than assuming best-case values for all parameters simultaneously.
Impact of Capacity Utilisation on Cost per Kg and Profitability
Capacity utilization impacts fixed overhead costs in milk powder production directly. Fixed costs – salaries, certain utilities, depreciation, insurance – do not fall in proportion to production volume. When utilisation drops, fixed cost per kg rises, squeezing margins.
Illustrative impact of capacity utilisation (hypothetical 10 TPD plant, 300 days/year):
| Utilisation | Annual Output (MT) | Fixed Cost per kg (₹) | EBITDA Margin Trend |
|---|---|---|---|
| 50% | 1,500 | High (~₹28–32) | Thin or negative |
| 65% | 1,950 | Moderate (~₹22–25) | Marginal |
| 80% | 2,400 | Lower (~₹18–20) | Healthy |
| 90% | 2,700 | Lowest (~₹15–17) | Strong |
In the first year, operational costs are projected to be significant as utilisation ramps up – new plants typically take 1–2 years to reach 75–80% levels. Projecting 90–95% utilisation from Year 1 without strong procurement evidence is a common DPR error that I have seen weaken loan proposals repeatedly.
Robust procurement planning, confirmed sales contracts and realistic ramp-up assumptions reduce the risk of prolonged under-utilisation.
Commodity Model Versus Branded Product Model
| Parameter | Commodity (Bulk) Model | Branded (Retail) Model |
|---|---|---|
| Target customers | Food companies, traders, institutions | Retail consumers, distributors |
| Average selling price | Lower | Higher |
| Packaging cost | Low (bulk bags) | Significant (consumer packs) |
| Marketing expense | Minimal | Substantial |
| Distribution margins | Negligible | 8–15% of MRP |
| Credit risk | Concentrated | Dispersed |
| Inventory | Moderate | Higher (multiple SKUs) |
| Margin potential per kg | Lower, stable | Higher, variable |
| Brand-building period | Not applicable | 2–5 years |
Although branded products show a higher ex-factory price, net margin after factoring advertising, promotional schemes, returns, breakages and credit losses may or may not exceed a stable B2B model. Banks often view stable, contracted bulk sales positively when assessing the milk powder plant revenue model and repayment capacity.
New entrepreneurs should consider a phased approach: start as a bulk or contract manufacturer, then gradually allocate capacity to own-label as cash flows mature.
Seasonality and Inventory Strategy in Milk Powder Plants
In India, milk production is seasonal – flush season (October–March) brings higher supply and generally lower procurement prices, while lean season (April–September) sees reduced supply and rising costs. Milk powder prices are influenced by domestic production and seasonal supply availability.
Common strategy involves producing more powder during flush months, building inventory and selling throughout the year. This carries risks:
- Powder price may fall after inventory is built
- Quality deterioration if storage conditions are inadequate (especially for high-fat powdered milk)
- Working capital blockage from large inventory holdings
- Interest cost on funded inventory
Potential seasonal inventory gains should not be treated as guaranteed profit in projections. Banks scrutinise inventory norms and value in drawing-power calculations for cash-credit limits.
Break-Even and Margin of Safety for a Milk Powder Manufacturing Plant
Break-even is the production level at which total contribution equals total fixed costs – zero profit, zero loss.
Key formulas:
- Contribution per kg = net selling price – variable cost per kg
- Break-even quantity (kg) = annual fixed costs ÷ contribution per kg
- Break-even capacity utilisation (%) = break-even quantity ÷ practical annual capacity
- Margin of safety (%) = (expected sales – break-even sales) ÷ expected sales × 100
A properly designed facility can reduce the break-even period significantly. A skimmed milk powder plant can recover capital investment in 4–5 years when operating at 70%+ utilisation with favourable market conditions.
Detailed break-even analysis, along with DSCR and cash-flow projections, is a standard part of a professional manufacturing plant project report.
Sensitivity Analysis: Testing the Strength of the Revenue Model
Sensitivity analysis tests how changes in critical variables affect profitability, DSCR and payback for a milk powder manufacturing plant.
Key variables to test:
| Variable Changed | Direction | Impact on EBITDA | Impact on DSCR |
|---|---|---|---|
| Raw milk price +5% | Adverse | Significant decline | Weakens |
| Powder selling price –5% | Adverse | Moderate decline | Weakens |
| Capacity utilisation –10 pp | Adverse | Material decline | Weakens |
| Powder recovery –2% | Adverse | Moderate decline | Weakens |
| Energy tariff +10% | Adverse | Minor–moderate decline | Slight weakening |
| Interest rate +1% | Adverse | No EBITDA impact | Weakens |
| Selling price +5% | Favourable | Moderate improvement | Strengthens |
Global commodity price volatility affects milk powder market realization prices, and raw milk price volatility remains the most sensitive factor in Indian projects. A bankable DPR uses sensitivity analysis to demonstrate that the project can withstand reasonable adverse movements without defaulting on term-loan obligations.
Project Cost and Profitability Relationship: CapEx, Efficiency and Returns
While this article focuses on revenue and profitability, capital expenditure decisions significantly influence operating cost per kg and long-term ROI. Higher initial investment in energy-efficient evaporators, modern spray dryers and automation may reduce variable costs and improve product quality. High-quality machinery is essential for milk powder production – equipment costs for spray dryers alone can represent 35–40% of total CapEx.
Investment for small-scale milk powder units ranges from ₹50–80 lakhs, while mid-sized plants (15 MT/day) may require ₹10–18 crore. Government incentives can reduce equity deployment to 25–30% of project cost through interest subventions and grants under schemes like DIDF and NPDD. Plant setup requires compliance with local zoning laws, FSSAI, pollution-control, factory and fire-safety approvals.
The cheapest machine quote is not automatically best for profitability if it leads to lower recovery, higher energy costs or frequent downtime. A DPR should weigh lifecycle economics, not just purchase price.
For deeper CapEx insights, refer to our guides on milk powder plant setup cost, machinery and equipment cost, land, building and infrastructure, and project cost and means of finance.
Illustrative Profitability Statement (Hypothetical Example)
The following is a simplified, hypothetical illustration of a profitability statement for a mid-sized Indian milk powder plant. All figures are assumed for structural understanding only.
| Line Item | ₹ Crore (Annual) | % of Revenue |
|---|---|---|
| Revenue from milk powder | 39.00 | 73% |
| Revenue from fat/by-products | 14.00 | 27% |
| Total operating revenue | 53.00 | 100% |
| Raw material cost (milk) | 40.00 | 75% |
| Packaging cost | 1.60 | 3% |
| Utilities (power, steam, fuel, water) | 3.20 | 6% |
| Employee cost | 1.30 | 2.5% |
| Repairs, overhead, quality, logistics | 1.90 | 3.5% |
| EBITDA | 5.00 | 9.4% |
| Depreciation | 1.50 | 2.8% |
| Interest | 1.20 | 2.3% |
| Profit before tax | 2.30 | 4.3% |
Disclaimer: These figures are hypothetical and for illustrative purposes only. Actual results vary by location, period, technology, management, milk prices, selling prices and financing structure. This is a template to be customised using project-specific data during DPR preparation.
Working Capital and Cash Profitability
Accounting profit and actual cash availability differ significantly in a milk powder manufacturing business. Working capital management is essential in the operation of a milk powder plant.
Key components affecting cash profitability:
- Raw milk payment cycles – farmers and societies typically expect payment within 10–15 days
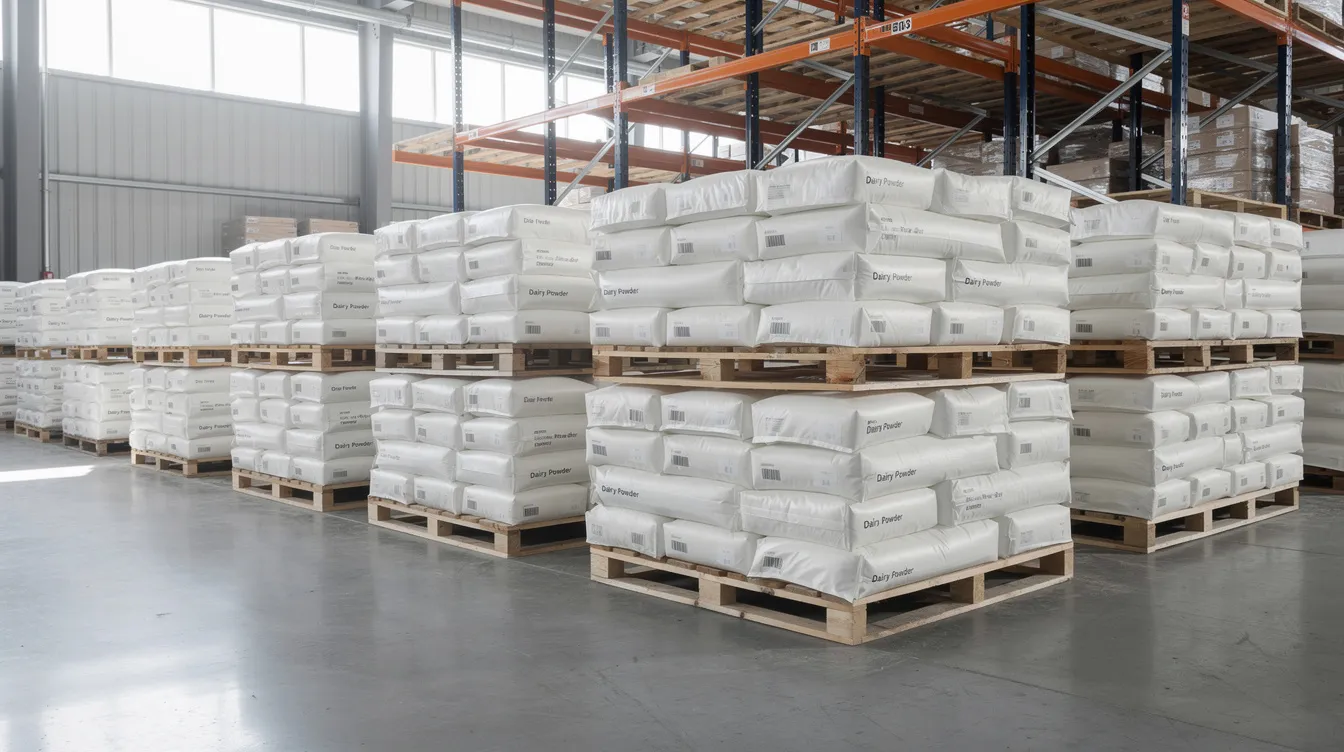
- Finished goods inventory – powder may be held 30–60 days depending on sales cycle and seasonality
- Trade receivables – B2B customers may take 30–90 days credit
- Trade payables – limited leverage on raw milk but better terms on packaging and consumables
- Cash-credit utilisation – banks fund part of inventory and receivables but charge interest
High inventory and long credit periods, common in B2B milk powder sales, can create cash-flow strain even in a plant that appears profitable on paper. Promoters should track cash profitability (PAT + depreciation – principal repayments) and debt-service coverage, not just gross profit margins.
Risks Affecting Revenue and Profitability – and Practical Mitigation
The milk powder plant revenue model is exposed to several risks that must be recognised and managed:
| Risk | Mitigation |
|---|---|
| Milk price volatility | Diversified procurement regions, SNF-based pricing, long-term farmer relationships |
| Powder price volatility | Staggered sales, forward contracts, product-mix flexibility |
| Procurement shortages (lean season) | Multi-region sourcing, inventory building during flush |
| Quality complaints/rejection | Robust quality control systems, FSSAI compliance, lab testing at intake |
| High energy consumption | Energy audits, heat-recovery systems, energy efficiency upgrades |
| Low capacity utilisation | Confirmed offtake agreements, phased capacity expansion |
| Customer concentration | Diversified customer base across segments |
| Delayed receivables | Strict credit policies, advances for new buyers |
| Inventory price losses | Conservative stocking, real-time price monitoring |
| Regulatory non-compliance | Maintaining FSSAI, pollution-control and regulatory approvals proactively |
| Export and currency risks | Hedging, confirmed LCs, understanding of international price trends |
Maintaining strict quality standards minimizes batch rejections in milk powder production. Excessive leverage and unrealistic projections increase vulnerability – conservative revenue estimates and adequate contingency margins improve project resilience.
How to Improve Milk Powder Plant Profitability in Practice
Several technical and commercial measures can enhance profitability over time:
Procurement and production:
- Strengthen milk procurement networks and move to solids-based payment systems
- Improve powder and fat recovery through better process control
- Reduce energy consumption via efficient plant operations and utility upgrades
- A milk powder plant can optimize profitability through product-mix optimization strategies between SMP, WMP, whitener and fats
Commercial measures:
- Diversify customer segments – institutional, government, export, select retail
- Negotiate better credit terms with buyers
- Reduce production losses through preventive maintenance
- Implement scientific inventory management aligned with market trends
Management practices:
- Monthly variance analysis comparing budget versus actual by product
- Preventive maintenance schedules for all unit operations involved in production
- Training of operations staff and continuous cost benchmarking
- Robust quality assurance criteria across every stage of the production process
Gradual, data-driven improvements generally produce safer and more sustainable gains than aggressive pricing or over-expansion.
Role of a Detailed Project Report (DPR) and Financial Model
Before setting up or expanding a milk powder manufacturing plant, a professional DPR and financial model are essential tools. Key contents include:
- Capacity and product-mix assumptions
- Detailed revenue projections and raw material calculations
- Cost of production analysis with fixed and variable costs separated
- Profitability statements, projected balance sheets and cash-flow statements
- Working-capital assessment and DSCR analysis
- Break-even analysis and sensitivity analysis
- Project cost and means of finance, loan-repayment schedule
Such projections are prepared based on assumptions and information shared by promoters, sector knowledge and current market references. They are not a guarantee or certification of future performance. A well-structured DPR helps align the milk powder plant revenue model with realistic procurement, sales and financing constraints.
Professional Perspective of CA Manish Gugliya on Evaluating Milk Powder Plant Profitability
In my experience of over 20 years preparing DPRs, CMA data and bank-finance presentations for dairy processing projects across India, I have consistently observed that milk powder plant profitability cannot be assessed by simply multiplying powder output by current selling price. We must jointly examine milk solids recovery, fat recovery, procurement cost, energy cost, capacity utilisation, by-product realisation, inventory cycle and debt servicing.
I regularly see projects where small differences in assumptions – 0.5% change in SNF recovery, ₹0.50 per kWh difference in power cost, or 15 extra days of credit period – drastically change DSCR and payback in financial models. These are not academic concerns; they are the difference between a bankable project and a rejected loan application.
I provide professional assistance in preparing customised DPRs, financial projections, CMA data and bank-finance presentations for dairy and milk powder manufacturing projects, always based on data and assumptions provided by promoters. These services are decision-support tools – they do not amount to certifying projections as guaranteed, nor do they guarantee bank loan sanction.

Frequently Asked Questions (Milk Powder Plant Revenue Model & Profitability)
The following FAQ addresses common questions entrepreneurs and investors ask about revenue modelling and profit margins in milk powder manufacturing plants. Answers are general in nature – project-specific advice requires a customised DPR aligned to your proposed location, capacity and product mix. All responses reflect conditions relevant to India as of 2026.
Is a milk powder manufacturing plant profitable in India?
Profitability is achievable but not automatic. It depends on competitive raw milk procurement cost, efficient technology, stable demand for selected milk powder products, and professional financial management. Even within the same state, one plant can be profitable while another struggles due to differences in procurement strategy, utilisation and debt burden. A detailed, location-specific DPR is necessary to judge whether a proposed plant is likely to achieve acceptable returns. The rising consumer demand for dairy products and powdered milk across food manufacturing, infant nutrition, and ready to eat meals segments supports the commercial case – but execution determines the outcome.
What is the normal profit margin in milk powder manufacturing?
There is no single “normal” profit margin applicable across India. Margins vary with season, region, plant size, product mix and financing structure. Some months may show thin or negative margins if powder prices fall or milk prices spike, while flush-season production or export opportunities can improve margins. Focus on long-term average contribution per kg and sustainable EBITDA after considering realistic capacity utilisation and financing cost rather than headline margin percentages.
How is milk powder plant revenue calculated in practice?
Revenue is calculated product-wise: expected saleable quantity of SMP, WMP, whitener, fats and other products multiplied by respective net selling price after discounts, freight and taxes. For contract manufacturing, revenue may be based on processing fees per kg rather than powder selling price. Entrepreneurs should validate assumed quantities with capacity planning and yield estimates, and validate prices with current buyer quotations or market data. The annual production capacity and recovery rates are the foundation of any reliable revenue projection.
What is the biggest cost in milk powder production?
Raw milk procurement is typically the largest operating cost component, with raw milk accounts for 75–85% of operating expenses in most Indian plants. Energy costs – power, steam and refrigeration – are the second-most sensitive cost area, especially where tariffs are high or equipment is inefficient. Focusing only on reducing minor operating expenses while ignoring milk and energy optimisation will not materially improve profitability.
How does capacity utilisation affect profitability in a milk powder plant?
Under-utilised plants spread fixed costs over fewer kilograms of powder, raising cost per kg and squeezing margin. Once a plant crosses break-even utilisation, additional volume contributes significantly to profit provided selling prices cover variable costs. The revenue model and DPR should realistically phase utilisation ramp-up over 2–3 years instead of assuming immediate full-capacity operation.
Is SMP or WMP more profitable for a new plant?
Profitability depends on local milk composition, relative prices of SMP, WMP and ghee, market demand and export opportunities – there is no fixed rule favouring one product. SMP allows separate sale of fat products, while WMP locks fat into powder. Many plants design flexibility to shift capacity between SMP and WMP depending on market conditions. Proper financial analysis through a DPR is the only reliable way to compare profitability for your specific situation.
Can by-products like cream, butter and ghee significantly improve plant profitability?
By-products are not minor in milk powder revenue models. Fat realisation from cream, butter or ghee can meaningfully contribute to overall margin – ghee alone trades at ₹400+ per kg in Indian wholesale markets. The key is efficient fat recovery, quality control and reliable markets. DPRs must model fat and powder realisation together to avoid underestimating or double-counting revenue.
Which financial ratios should investors and lenders examine for a milk powder project?
Important ratios include EBITDA margin, PAT margin, return on capital employed, DSCR, interest-coverage ratio, current ratio, net present value, IRR and inventory/receivable days. Lenders pay particular attention to DSCR and cash-flow stability over the loan tenure, not just projected IRR. Promoters should review these ratios under both base-case and stress-case scenarios before approaching banks.
Why is a customised DPR necessary for bank finance of a milk powder plant?
Banks require project-specific details: capacity, location, milk procurement plan, customer base, projected revenue, cost structure, profitability, DSCR and security structure. Generic internet-based project reports or copied spreadsheets do not satisfy due diligence requirements and can delay or weaken loan proposals. A professionally prepared powder manufacturing plant project report, aligned with bank formats and supported by realistic assumptions, significantly improves the quality of the finance proposal – though it does not guarantee sanction.
Conclusion: Building a Robust Milk Powder Plant Revenue Model Before You Build the Plant
Milk powder plant profitability is determined by the combined effect of procurement cost and milk quality, powder and fat recovery, product mix, capacity utilisation, energy efficiency, selling prices, by-product realisation, inventory management and cost of finance. No single factor – not even a favourable selling price – can compensate for weakness across multiple drivers.
Attractive market demand in the global milk powder industry and India’s growing dairy processing industry offer genuine opportunities, but installed capacity alone does not convert opportunity into profit. Disciplined financial planning, data-driven cost analysis and ongoing monitoring of contribution per kg across every product line are essential practices for sustainable profitability.
Serious promoters should invest time and resources in a customised DPR and financial model before committing to machinery orders, land acquisition or large borrowings. If you are planning to establish or expand a milk powder manufacturing plant in India, I invite you to reach out for professional assistance in preparing detailed milk powder plant revenue models, DPRs, CMA data and bank-finance presentations tailored to your specific project. Sound planning today prevents costly surprises tomorrow.