Key Takeaways
- Under illustrative assumptions (chana dal at ₹50/kg, 96% recovery, bulk packaging), ex-factory besan production cost per kg for a wholesale plant may fall in the range of approximately ₹55–₹62 per kg. At recent higher dal prices (₹80–₹95/kg), estimated base production cost of besan ranges from ₹73.50 to ₹88.50 per kg based on recent data. Actual cost varies with market prices, location, scale and process efficiency.
- Besan manufacturing cost per kg is driven mainly by chana dal price, recovery percentage, power consumption, labour, packaging and capacity utilisation – not merely by owning an automatic besan plant or flour mill.
- Profit margin in besan manufacturing depends on contribution per kg (selling price minus variable cost) and on achieving higher capacity utilisation of the besan plant machinery, which spreads fixed costs across more production.
- Wholesale loose besan, retail packaged gram flour and premium branded besan each carry different selling prices, cost structures and profit profiles – higher MRP does not automatically mean higher manufacturer margin.
- Entrepreneurs should prepare a proper cost sheet, break-even analysis, working capital plan and sensitivity analysis before investing in any besan mill plant. Professional support for DPR and CMA Data is available from Project Report Bank.
Introduction – Understanding Besan Manufacturing Economics
I am CA Manish Gugliya, a practising Chartered Accountant since 2006 and the founder of Project Report Bank, a professional advisory platform for MSME and manufacturing projects including Detailed Project Reports, financial projections, CMA Data and bank finance proposals.
In my experience preparing DPRs for food processing projects across India, one of the most frequently asked questions is: what is the actual besan production cost per kg, and what profit margin can a besan manufacturing business realistically deliver? The short answer is that under illustrative conditions with moderate chana dal prices, a well-run besan plant may achieve an ex-factory production cost in the range of ₹55–₹62 per kg for bulk supply. However, these figures are hypothetical and change significantly with raw material prices, location, recovery percentage, electricity tariff and automation grade.
Understanding besan manufacturing economics is essential for entrepreneurs planning an automatic besan plant, a besan making plant, a flour mill plant or a multi-product pulse flour mill producing besan, sattu and other pulse-based flours. Fully automatic besan plants are commonly used in India, with production capacity of a besan plant varying from 100 kg/hr to 2000 kg/hr. Cost components for manufacturing besan include raw material, power, labor and packaging, but the complete picture involves several additional factors.
The key cost drivers include chana dal or whole gram procurement prices, quality and moisture content, recovery and process losses, scale of production, electricity and utilities, labour intensity, packaging type and the operation mode of the plant – whether semi automatic or fully automatic. Location affects the cost structure of besan production due to logistics, industrial power tariffs and local overheads. Financing structure, including term loan interest, working capital cash credit and plant utilisation, directly influences per-kg cost and net profit margin.
For a comprehensive understanding of the capital investment required, readers may refer to the detailed besan manufacturing plant setup cost in India.
What Determines Besan Production Cost per Kg?
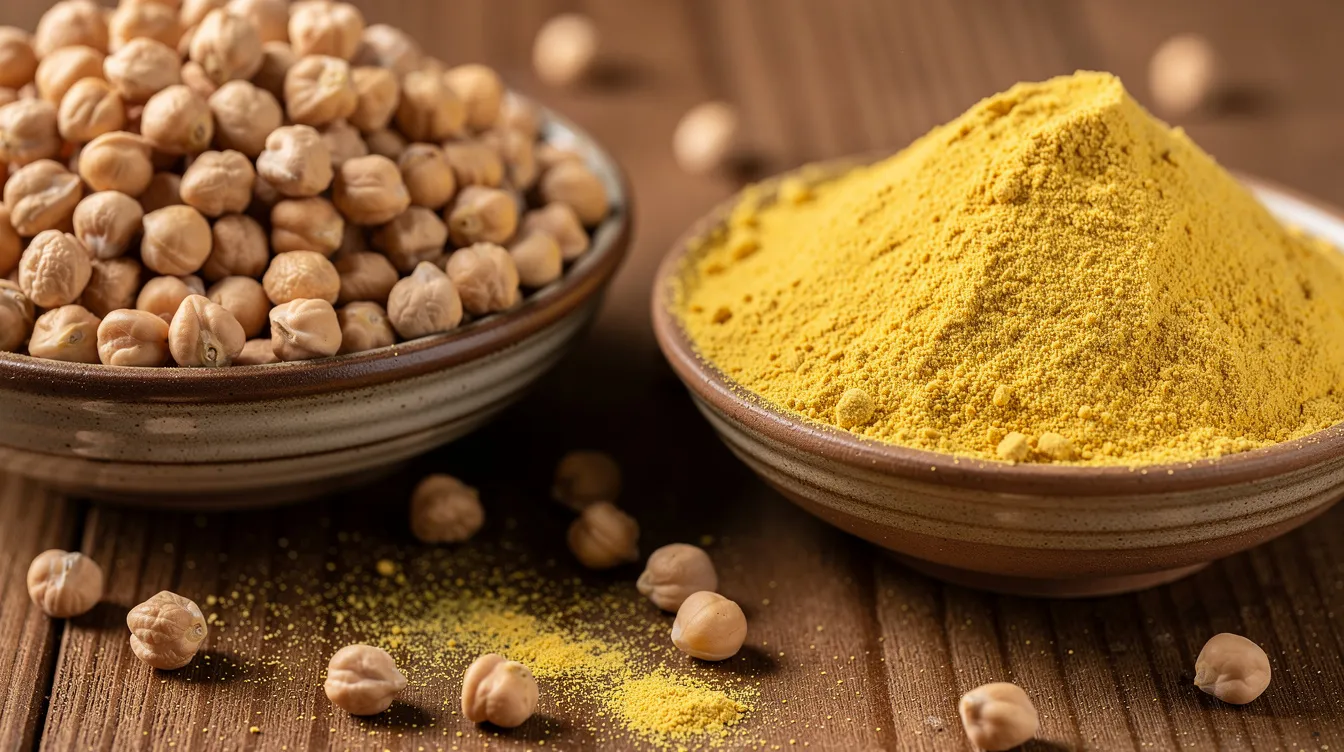
The besan production cost per kg is the cumulative effect of several cost components, not simply the chana dal purchase rate or besan plant machine price. Each element adds to the final manufacturing cost per kilogram of saleable besan.
The major cost components include: chana dal or whole gram procurement, cleaning and grading, dehusking (if processing whole gram in house), grinding and milling, electricity and power, labour and supervision, packaging materials, repairs and maintenance, factory overheads including rent and insurance, quality control and FSSAI testing, transportation and handling, depreciation on plant and machinery, interest on borrowings, and administrative overheads. Regulatory compliance and local transport factors also contribute to total production costs.
It is important to understand the terminology clearly. Raw material input cost refers only to the purchase price of chana dal or gram. Variable conversion cost covers power, labour, consumables and packing per kg. Total manufacturing cost adds raw material cost to variable plant costs. Cost of goods sold includes factory overheads, and fully loaded cost further adds selling, distribution and administrative expenses. These distinctions matter when computing margins and presenting financials to a bank.
Besan plant machinery can range from ₹65,000 to ₹20,00,000 depending on capacity and automation. A semi-automatic besan setup costs approximately ₹2,50,000, while a fully automatic besan plant costs approximately ₹30,00,000. Besan making plants can have capacities of 200–500 kg/hr, while larger automatic besan plants can process up to 2000 kg/hr. A 500 kg/hr besan plant is priced around ₹27,60,000, and even the cost of a 1500 kg/hr fully automatic besan plant is quoted at approximately ₹9,25,000 by some suppliers, though actual project cost including installation, civil work and utilities will be substantially higher.
The choice of milling technology directly impacts energy consumption and operational yield. Traditional stone mills typically incur higher processing costs per kilogram compared to modern impact pulveriser-based methods. An automatic besan plant with a proper control panel, dust collection system and airlock valve arrangement improves consistency and recovery, but does not eliminate raw material price risk. Besan making plants utilise impact pulverizers for grinding, and these are available for approximately ₹1,50,000 as standalone units. The plants are typically made from heavy-duty stainless steel and mild steel structure, designed for long service life and low maintenance, and are customisable to fit specific production needs.
For a detailed understanding of grinding and milling equipment, readers can review the key besan manufacturing machinery and automatic besan plant machine options. For process-flow understanding covering cleaning, dehusking, grinding and sieving, the besan manufacturing process explained step by step is a useful reference.
Besan Raw Material Cost per Kg – Chana Dal Price and Recovery
Chana dal accounts for approximately 75% to 85% of besan production costs in most manufacturing models, making raw material management the single most critical lever for profitability. The production cost of besan is fundamentally influenced by raw material procurement.
The core formula is straightforward:
Raw Material Cost per Kg of Besan = Net Raw Material Cost ÷ Saleable Besan Output
Here, saleable output must account for moisture, sieving rejects, dust losses and process waste. The recovery rate of raw materials directly affects final weight recovery in besan production.
Consider a hypothetical example. If chana dal is purchased at ₹50/kg and the dal-to-besan recovery is 96% (i.e., 4% processing loss), then producing 1 kg of besan requires approximately 1.0417 kg of dal input. The raw material cost per kg of besan becomes 1.0417 × ₹50 = approximately ₹52.08. If recovery improves to 97%, input reduces to 1.0309 kg, and the cost becomes approximately ₹51.55 per kg. At higher market rates – say ₹85/kg for chana dal – the raw material cost alone rises to approximately ₹88.54/kg at 96% recovery.
The route matters considerably. Processing whole gram (desi chickpea) involves dehusking and splitting before grinding, with overall recovery from whole gram to besan typically around 65–75%. This generates by-products such as husk (bhusi) and broken pieces. By-product recovery during processing can marginally offset raw material costs when husk is sold as cattle feed. However, these credits should be deducted from raw material cost carefully, and writers of DPRs should avoid double counting by-product credits in total cost calculations.
For a detailed comparison of chana dal vs whole gram for besan cost viability, readers should examine both routes based on local procurement options. Purchase timing and stocking decisions also matter – chana dal procurement and inventory planning for besan units discusses seasonal buying strategies.
Detailed Besan Manufacturing Cost Sheet per Kg
The following illustrative cost sheet assumes a bulk-supply besan mill plant using chana dal as input, with a hypothetical dal price of ₹50/kg and 96% recovery. These numbers are for educational purposes only – not live market quotations.
Illustrative Besan Manufacturing Cost Sheet per Kg (Hypothetical Example)
| Cost Component | ₹ per Kg of Besan | Basis of Calculation |
|---|---|---|
| Raw material (chana dal) | 52.08 | ₹50/kg dal, 96% recovery, 1.0417 kg input per kg besan |
| Electricity and power | 2.00 | Based on kWh consumption per kg at local industrial tariff |
| Direct labour | 1.50 | Monthly shop-floor wages divided by effective kg produced at 70% utilisation |
| Packaging (bulk, 25–50 kg bags) | 1.00 | Cost of HDPE/PP bags for bulk dispatch |
| Repairs and maintenance | 0.75 | Annualised spares, grinding parts, sieves, spread across production |
| Factory overheads (rent, insurance, supervision) | 2.00 | Fixed monthly expenses distributed per kg at assumed utilisation |
| Quality control and testing | 0.50 | FSSAI compliance, lab testing, sampling |
| Total production cost | 59.83 | |
| Selling and distribution expenses | 1.50 | Freight, handling, basic sales coordination |
| Total operating cost | 61.33 |
The numbers above are mathematically consistent and purely illustrative. At higher chana dal prices – for instance ₹80–₹90/kg – the raw material line alone would rise to ₹83–₹94/kg, pushing total operating cost significantly higher. The estimated base production cost of besan ranges from ₹73.50 to ₹88.50 per kg based on recent data with moderate raw material costs.
Variable costs – raw material, power, packing and direct labour – change proportionally with production volume. Fixed costs – supervisor salaries, factory rent, depreciation, administrative expenses – remain largely unchanged per month regardless of output. Higher capacity utilisation therefore spreads fixed costs over more kilograms, reducing the effective per-kg cost. Power consumption for grinding pulses is a significant operational overhead, and industrial power tariffs affect operational expenses meaningfully. The electricity connection requirement and three phase power consumption of a fully automatic besan plant with dust collection can be substantial; readers may refer to the besan plant power requirement, dust collection and utilities for detailed analysis.
Packaging choices significantly impact the cost of finished besan. Bulk bags at ₹1/kg contrast sharply with laminated retail pouches costing ₹6–₹10/kg.
Besan Selling Price per Kg in India
Actual besan selling prices vary across regions such as Rajasthan, Madhya Pradesh, Maharashtra and West Bengal, across product types (ordinary besan, fine gram flour, branded variants) and across customer categories. Any values used below are illustrative and not verified market quotations.
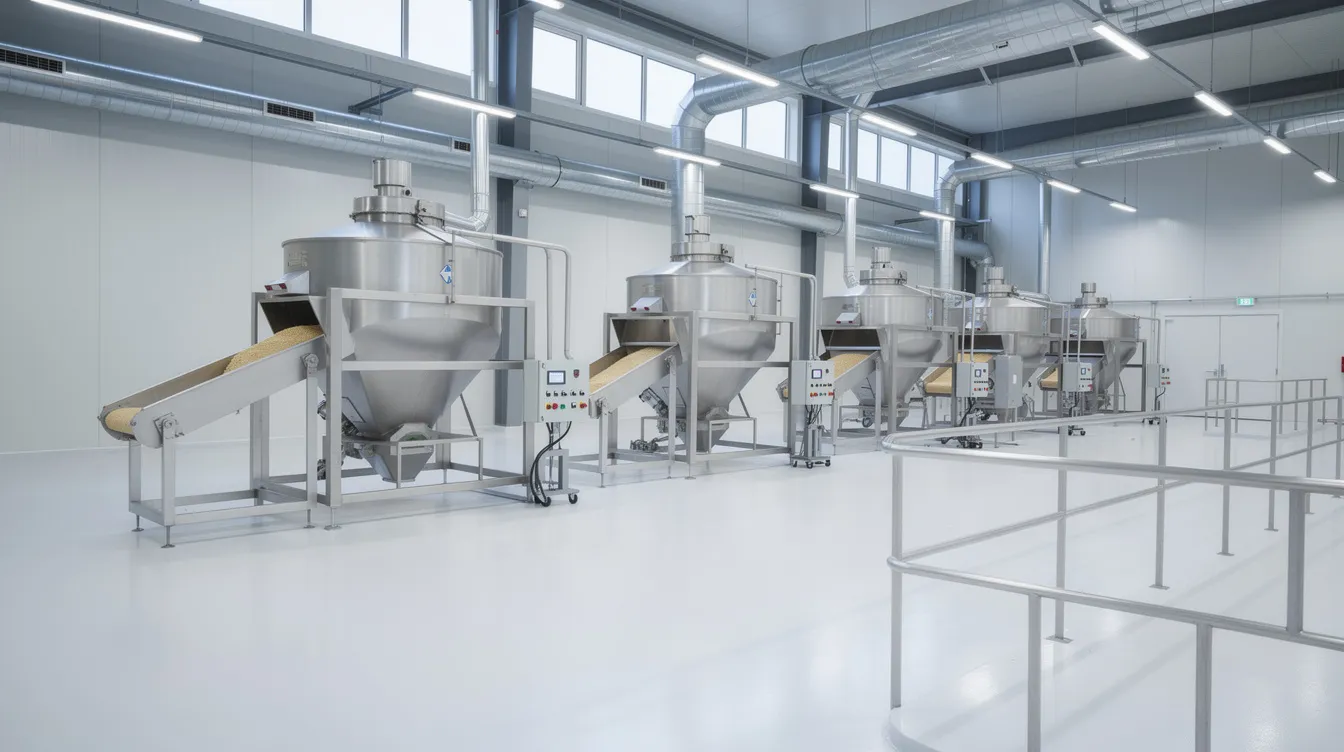
For bulk institutional sales (20–50 kg sacks) to namkeen manufacturers, sweet shops or food service companies, ex-factory prices typically track close to raw material cost plus a modest margin. Wholesale distribution prices may carry a small additional margin over ex-factory. Loose besan sold by local flour mill operators often has minimal branding premium. Retail packaged besan (500 g or 1 kg pouches) carries a higher MRP, while premium or organic branded besan commands the highest prices. Private-label manufacturing for retailers involves the besan plant supplying at an agreed ex-factory rate, with branding and marketing borne by the client.
Key terms should be understood clearly. Ex-factory realisation is the price the manufacturer receives at the factory gate. Distributor price includes the manufacturer’s margin plus distribution cost. MRP is the maximum retail price printed on the pack. Trade discount, scheme discount and distributor margin all reduce the net manufacturer revenue below MRP.
For example, a 1 kg branded besan packet with MRP of ₹90 may yield a net ex-factory realisation of only ₹65–₹72 after trade margins and distributor discounts. In contrast, a bulk wholesale sale at ₹68/kg ex-factory offers a lower nominal price but involves no distribution margin, branding cost or scheme expense.
GST collected on sales is not income – costing and pricing decisions should be based on the basic price exclusive of GST when computing profit margins.
Besan Manufacturing Profit Margin per Kg
Contribution per kg is the first indicator of viability for any besan plant. It is defined as net selling realisation per kg minus variable cost per kg.
The relevant formulas are:
- Contribution per Kg = Net Selling Price per Kg − Variable Cost per Kg
- Gross Profit Margin (%) = (Gross Profit ÷ Net Sales) × 100
- EBITDA Margin (%) = (EBITDA ÷ Net Sales) × 100
- Net Profit Margin (%) = (Profit After Tax ÷ Net Sales) × 100
Using the earlier cost sheet for a wholesale model: at ₹68/kg net selling price and ₹56.58/kg total variable cost (raw material + power + labour + packing), contribution per kg is approximately ₹11.42. At 67,200 kg monthly saleable output, monthly contribution is approximately ₹7.67 lakh.
For branded retail besan, the net ex-factory realisation may be ₹72/kg after trade margins, but variable cost rises to approximately ₹63/kg due to higher packaging and distribution, yielding contribution of only ₹9/kg. Despite the higher MRP, the net manufacturer margin may be comparable or even lower if volumes are smaller and brand spending is substantial.
Fixed costs such as rent, salaries, depreciation and interest do not change per kg with output in the short term. Raising capacity utilisation is therefore often the most practical route to improving EBITDA margin. These margins differ substantially between a small 100 kg hr automatic besan plant and a large 1,000–2,000 kg hr besan mill plant due to scale economies.
Monthly Profit Calculation for a Besan Manufacturing Plant
Consider a hypothetical besan manufacturing unit with an installed capacity of 500 kg/hr, running 8 hours per day and 25 days per month. The installed monthly capacity is therefore 1,00,000 kg. At 70% capacity utilisation, actual monthly production is 70,000 kg of raw dal processed. With 96% recovery, saleable besan output is 67,200 kg per month.
Assuming a net selling price of ₹68/kg for bulk supply, monthly revenue is ₹45,69,600. Raw material cost at ₹52.08/kg for 67,200 kg is ₹34,99,776. Other variable costs (power, labour, packing, consumables) at ₹5.25/kg total ₹3,52,800. Monthly contribution therefore stands at approximately ₹7,17,024.
| Item | ₹ per Month |
|---|---|
| Sales Revenue | 45,69,600 |
| Raw Material Cost | 34,99,776 |
| Other Variable Costs | 3,52,800 |
| Contribution | 7,17,024 |
| Fixed Operating Expenses | 3,50,000 |
| EBITDA | 3,67,024 |
| Depreciation | 75,000 |
| Interest (term loan + working capital) | 50,000 |
| Profit Before Tax | 2,42,024 |
At lower utilisation – say 40–50% during initial months – contribution drops while fixed costs remain the same, potentially resulting in low or negative EBITDA.
For financing considerations, both term loan EMI and interest on working capital reduce profit before tax. Interest should be accounted for only once – not duplicated in both operating and finance costs. For detailed besan manufacturing project cost and means of finance planning, a structured DPR is essential.
Besan Manufacturing Profitability at Different Capacity Utilisation Levels
For a given besan plant, installed capacity is fixed, but actual utilisation determines how fixed costs are distributed per kg. Using the same base assumptions as above, here is how profitability shifts across utilisation levels.
| Utilisation % | Monthly Saleable Output (kg) | Variable Cost/Kg (₹) | Fixed Cost/Month (₹) | Fixed Cost/Kg (₹) | Total Cost/Kg (₹) | Selling Price/Kg (₹) | Contribution/Kg (₹) | Monthly EBITDA (₹) |
|---|---|---|---|---|---|---|---|---|
| 50% | 48,000 | 57.33 | 3,50,000 | 7.29 | 64.62 | 68.00 | 10.67 | 1,62,160 |
| 60% | 57,600 | 57.33 | 3,50,000 | 6.08 | 63.41 | 68.00 | 10.67 | 2,64,592 |
| 75% | 72,000 | 57.33 | 3,50,000 | 4.86 | 62.19 | 68.00 | 10.67 | 4,18,240 |
| 90% | 86,400 | 57.33 | 3,50,000 | 4.05 | 61.38 | 68.00 | 10.67 | 5,71,888 |
While variable cost per kg remains nearly constant, fixed cost per kg falls sharply as utilisation improves, which is why large, well-loaded besan making plants and flour mill plants enjoy better margins. Realistic ramp-up planning – starting at 50–60% in Year 1 and reaching 80–85% over time – is essential for convincing banks about project viability. For detailed besan plant production capacity planning and utilisation assumptions, the DPR should document these assumptions clearly.
Wholesale vs Branded Retail Besan – Which Business Model Is More Profitable?
There is no single answer. Profitability depends on plant scale, brand strength, distribution network, automation grade, working capital capacity and risk appetite of the entrepreneur. Fully automatic besan plants reduce labor and energy consumption per kg, benefiting both models, but the business economics differ considerably.
In wholesale bulk supply, the net selling realisation is lower but packaging and labelling costs are minimal. Operations are simpler, with lower marketing spend and faster inventory turnover. However, the manufacturer is often dependent on a few bulk buyers – namkeen companies, sweet shops or institutional customers – and has limited pricing power. A trader or institutional buyer often negotiates hard on price.
In branded retail or private-label besan, the nominal selling price per kg is higher, but packaging costs for laminated pouches with printed design, advertising expenditure, dealer incentives and scheme discounts consume a substantial portion. Receivable cycles tend to be longer, increasing working capital requirements. The company must invest in brand building, distributor management and market support.
As a numerical illustration: wholesale besan at ₹68/kg with variable cost of ₹57.33/kg gives contribution of ₹10.67/kg. Branded retail besan with net ex-factory realisation of ₹72/kg but variable cost of ₹63/kg (higher packing and distribution) gives contribution of only ₹9/kg. The detailed analysis of bulk supply vs branded retail besan models explores these trade-offs further.
Impact of Chana Dal Price Changes on Besan Profitability
Raw material volatility is the biggest external risk in besan manufacturing. A sensitivity analysis is essential in any DPR or CMA Data. Using the earlier base cost sheet as reference:
| Scenario | Chana Dal Rate (₹/kg) | Raw Material Cost/Kg Besan (₹) | Total Cost/Kg (₹) | Contribution/Kg at ₹68 Selling Price (₹) | EBITDA Margin % |
|---|---|---|---|---|---|
| Base | 50.00 | 52.08 | 61.33 | 10.67 | 8.0% |
| +5% | 52.50 | 54.69 | 63.94 | 8.06 | 6.0% |
| +10% | 55.00 | 57.29 | 66.54 | 5.46 | 3.6% |
| +15% | 57.50 | 59.90 | 69.15 | 2.85 | 1.1% |
If market competition does not allow equivalent selling price increases, contribution per kg compresses sharply. In extreme cases – particularly at current market dal prices of ₹80–₹95/kg – besan manufacturing profit per kg can drop to negligible levels or turn negative for bulk suppliers who cannot raise prices proportionally.
Partial pass-through is sometimes necessary: raising the selling price by 3–4% when raw material rises 5–6% still erodes margins but may preserve market share and customer relationships.
Procurement strategy, inventory planning and staggered purchases can help smoothen raw material cost impact. Frequency of procurement review and in-house stock monitoring are critical management practices.
How Recovery Percentage Affects Besan Manufacturing Cost
Recovery percentage in besan manufacturing refers to the ratio of saleable besan output to raw material input, after accounting for dust, sieve rejects and process losses.
Recovery % = (Saleable Besan Output ÷ Raw Material Input) × 100
Even a 1% improvement in recovery meaningfully reduces raw material cost per kg.
Consider two scenarios with dal at ₹50/kg: in Scenario A, 1,000 kg dal yields 960 kg besan (96% recovery), giving a raw material cost of ₹52.08/kg. In Scenario B, the same 1,000 kg yields 970 kg (97% recovery), reducing cost to ₹51.55/kg. The difference of ₹0.53/kg, multiplied across thousands of kilograms monthly, creates a material saving.
Factors influencing recovery include quality and cleanliness of chana, calibration of impact pulveriser, condition of sieves, air sweeping system performance, motor power settings and maintenance of besan plant machinery. Operators trained by experienced engineers achieve better results. Claimed recovery percentages from leading manufacturer brochures should be cross-checked with actual production trials and validated in the DPR. The detailed discussion on besan manufacturing recovery, yield and process losses provides further guidance.
Break-Even Analysis of a Besan Manufacturing Plant
Break-even is the production level at which total contribution equals total fixed costs, resulting in zero profit before interest and tax.
The formulas are:
- Break-Even Quantity (kg/month) = Fixed Operating Costs ÷ Contribution per Kg
- Break-Even Revenue = Break-Even Quantity × Net Selling Price per Kg
- Break-Even Utilisation % = Break-Even Quantity ÷ Monthly Practical Capacity
Using the earlier example: fixed operating expenses of ₹3,50,000 per month and contribution of ₹10.67/kg give a break-even quantity of approximately 32,803 kg per month. Against an installed practical capacity of 96,000 kg (500 kg/hr × 8 hrs × 25 days at 96% recovery), break-even utilisation is approximately 34%. Break-even sales revenue would be 32,803 × ₹68 = approximately ₹22.31 lakh per month.
Cash break-even excludes non-cash expenses such as depreciation. Since depreciation is ₹75,000/month, cash break-even occurs at approximately (₹3,50,000 − ₹75,000) ÷ ₹10.67 = approximately 25,773 kg, a somewhat lower threshold. However, for long-term project viability, full accounting break-even and satisfactory DSCR are more important. Lower fixed costs and higher contribution per kg improve resilience during weak demand or high chana dal price phases.
Working Capital and Cash Flow in Besan Manufacturing
Many besan plant owners focus on term loan and machinery investment but underestimate working capital and cash flow requirements, leading to liquidity problems despite apparent profitability.
The main working capital components include: inventory of chana dal (which may require 15–30 days of stock), finished besan inventory awaiting dispatch, packing material stock (bags, pouches, cartons), trade receivables from dealers or institutional buyers, and trade payables or supplier credit terms.
Longer credit periods to distributors and higher inventory days increase working capital requirement, interest burden and risk. Prompt receivables and tight inventory management improve cash flow and DSCR. Accounting profitability does not guarantee positive cash flow. A besan plant may show book profit while cash remains tied up in large stocks and unpaid invoices, requiring higher cash credit limits.
Common bank facilities for besan manufacturers include cash credit against stock and book debts, letter of credit for bulk raw material purchases, and short-term loans for seasonal stocking when chana prices are favourable. For detailed working capital and cash credit planning for besan manufacturing, a comprehensive financial assessment is necessary.
How to Improve Besan Manufacturing Profit Margins
There are no guaranteed margins in besan manufacturing, but focused management can significantly enhance profitability for entrepreneurs operating automatic besan plants, besan mill plants or multiproduct flour mill units.
- Raw material strategies: buying directly from mandis in production markets across India or through trusted aggregators, monitoring chana dal moisture and high efficiency grading, and maintaining optimum stock levels.
- Process efficiency: regular maintenance of impact pulverisers, proper balancing of blowers and dust collectors with functioning airlock valves, minimising product spillage, and training operators.
- Energy optimisation: monitoring kWh per kg of besan produced, using energy-efficient motors with appropriate motor power ratings, maintaining proper belt alignments and automated start-stop sequences.
- Packaging and distribution: optimising laminate specifications, negotiating better rates with printers and suppliers, choosing pack-size mix strategically, and planning full-truck-load dispatches.
- Commercial levers: focusing on higher-margin SKUs, exploring private-label contracts with clients to stabilise volumes, shortening receivable cycles through prudent credit control, and using data-driven pricing based on regular manufacturing cost sheet reviews.
Financial Projections and DPR for a Besan Manufacturing Plant
Any serious besan manufacturing project – from a 200 kg hr semi automatic besan making plant to a 2 ton/hr fully automatic besan mill – should be supported by a bankable Detailed Project Report and realistic financial projections before approaching lenders. Automatic besan plants include cleaning, milling and packaging processes, and semi-automatic setups are available for various capacities, but the financial viability depends entirely on whether the numbers work.
A DPR should cover detailed project cost (land, building, plant and machinery, electrification, utilities, civil work, pre-operative expenses), means of finance (promoter contribution, term loan, subsidies), production and sales assumptions, per-kg manufacturing cost calculations, projected P&L, cash flow statement, balance sheet, break-even analysis and sensitivity analysis.
CMA Data and DSCR analysis are prepared from these projections for bank loan appraisal. Key ratios such as DSCR, interest coverage ratio, current ratio and debt-equity ratio are examined. Conservative assumptions on selling price, raw material cost and capacity utilisation generally carry more credibility with bankers. Projections are estimates based on current information and reasonable assumptions, not guarantees of performance or bank sanction. Neither Project Report Bank nor CA Manish Gugliya certifies future profits or repayment ability.
For besan plant financial projections, CMA data preparation and DSCR analysis, a properly structured financial model is the foundation.
Promoters interested in combining besan with other pulse flours such as chana sattu, moong flour or urad flour in a multi-product automatic flour mill can explore the multi-product pulse flour plant project report for additional reference. Usage application of wheat flour or other grains alongside pulses can diversify revenue in an integrated mill plant, but requires separate feasibility assessment.
Frequently Asked Questions
The following section addresses common queries about besan production cost per kg, selling price and profitability that may not have been covered directly in the main analysis.
What is the approximate production cost of 1 kg of besan in India?
Based on the illustrative assumptions used in this article – chana dal at ₹50/kg, 96% recovery, bulk packaging and reasonable utility costs – the ex-factory manufacturing cost per kg works out to approximately ₹60. At recent higher dal prices, the estimated base production cost of besan ranges from ₹73.50 to ₹88.50 per kg. Entrepreneurs should prepare their own plant-specific cost sheets based on actual procurement costs and local operating expenses before setting prices.
Is wholesale or branded besan manufacturing more profitable?
Wholesale bulk besan supply offers lower per-kg margins but faster inventory rotation and minimal marketing expenditure. Branded gram flour can deliver higher net realisation per kg but requires stronger distribution, significantly higher packaging and branding investments, and more working capital. The better model depends on each entrepreneur’s strengths, customer base, risk appetite and available capital for brand building.
How much chana dal is required to produce 100 kg of besan?
At 96% recovery from chana dal to besan, approximately 104–105 kg of dal input is needed to produce 100 kg of finished besan. At 97% recovery, the requirement reduces to approximately 103 kg. Actual figures must be derived from plant trials and besan plant machinery specifications rather than assumed from general benchmarks. The country of origin and variety of the chickpea can also influence recovery.
How does an automatic besan plant affect production cost per kg?
An automatic besan plant and higher automation grade generally improve consistency, reduce labour per kg and enhance recovery and energy efficiency, which together lower processing cost per kg. Plants can range from 50 kg/hr to 1500 kg/hr capacity, and besan plant machinery from various manufacturers offers different levels of technology and throughput. However, overall besan manufacturing cost per kg is still dominated by chana dal prices and recovery percentage rather than machinery alone. The three phase stone size and construction mild steel warranty specifications should be verified with the exporter or supplier before purchase.
Can I get bank finance for a new besan manufacturing project?
Term loans and working capital credit are generally available from banks for viable besan plant projects, subject to credit appraisal. Banks typically require a Detailed Project Report, financial projections, CMA Data, KYC documentation, collateral details and promoter background information. A professionally prepared DPR with realistic assumptions improves the quality and reliability of the proposal. Professional assistance from a service like Project Report Bank enhances presentation but cannot guarantee loan sanction.
Conclusion – Evaluating Besan Manufacturing Profitability
Besan production cost per kg in India is highly sensitive to chana dal prices, manufacturing recovery and realistic capacity utilisation. Profitability differs widely between units – even those with similar besan plant machinery – depending on procurement discipline, process control, packaging strategy and financial management.
Entrepreneurs should focus on three pillars before investing: accurate costing and sensitivity analysis; realistic production and sales ramp-up planning; and disciplined working capital and cash flow management. Relying solely on optimistic vendor pitches about fully automatic besan plant profitability, without independent financial verification, is a common and avoidable miss.
From my experience as a practising Chartered Accountant, a structured DPR with well-explained assumptions, a detailed cost sheet per kg, break-even analysis, DSCR calculations and realistic risk scenarios provides a strong basis for both internal decision-making and bank discussions. The food processing sector offers genuine opportunities, but projects must be evaluated with professional rigour.
Manish Gugliya & Company, Chartered Accountants, through ProjectReportBank.com, offers customised besan manufacturing DPRs, project finance advisory, manufacturing cost and profitability modelling, CMA Data preparation, DSCR and loan repayment analysis, working capital assessment and feasibility studies. Bank Finance DPR and Loan Proposal Assistance starts from ₹25,000, depending on project scope. Entrepreneurs may make an initial enquiry via WhatsApp from the ProjectReportBank.com website, with phone calls as a secondary option.
Besan manufacturing can be a commercially attractive MSME project when planned with professional financial analysis, prudent assumptions and disciplined execution – rather than viewed as an assured high-profit venture.