Key Takeaways
- Agro processing park financial projections must separate the park developer/SPV’s rental, lease and service income from the turnover and profitability of individual tenant processing units. Mixing the two produces misleading DSCR and IRR outputs.
- DSCR, project IRR, equity IRR, NPV and payback period together determine whether the park can secure term loan sanction and meet investor return expectations. Banks typically look for average DSCR in the range of 1.40x to 1.80x over the loan tenure.
- Occupancy ramp-up, rental and lease structure, common facility utilisation and capital cost discipline are the four variables with the highest impact on financial feasibility. A 10-15% shift in any of these can move project IRR by several percentage points.
- Sensitivity and scenario analysis across occupancy delays, capex overruns and interest rate changes is non-negotiable for any park with project cost above ₹150 crore.
- Project Report Bank, led by CA Manish Gugliya (FCA, DISA, over 20 years of experience), prepares customised DPRs, CMA Data and financial models for agro processing parks aligned with bank credit appraisal and institutional investor requirements.
Introduction: Why Agro Processing Park Financial Projections Matter
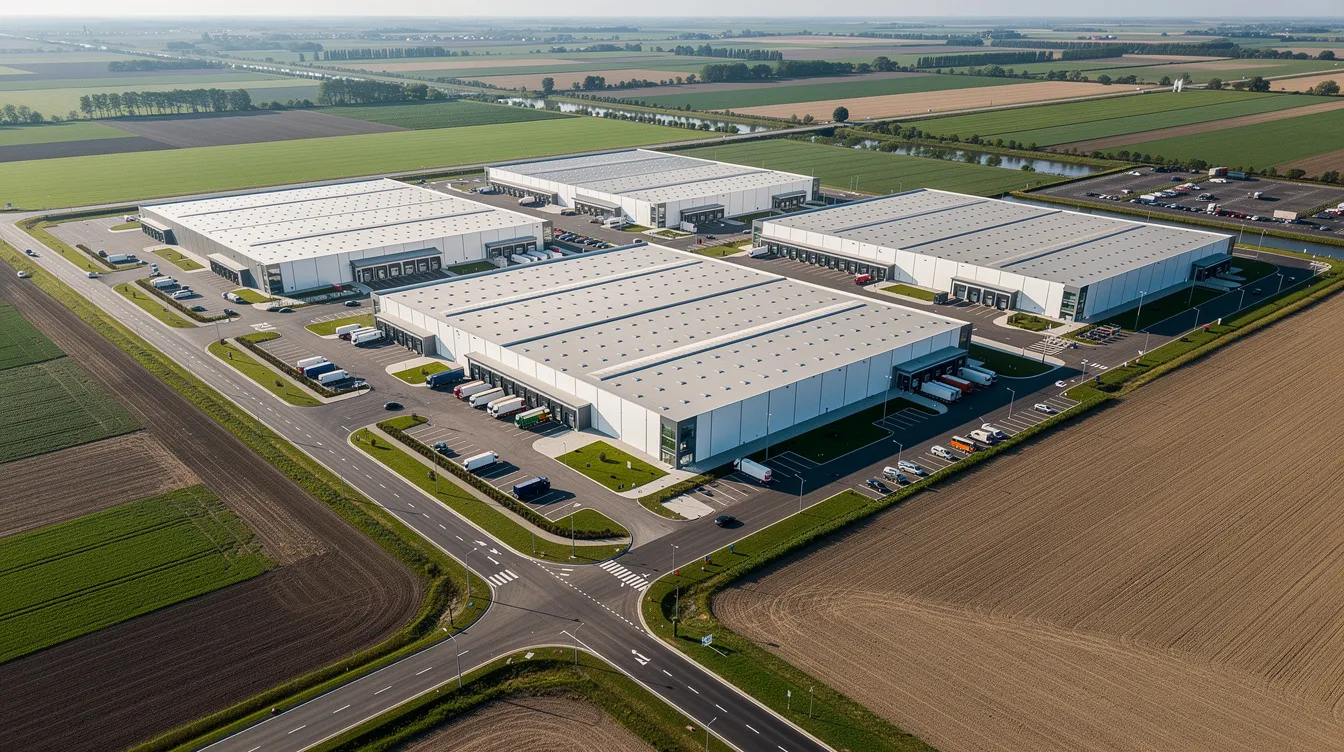
An agro processing park is a multi-tenant industrial infrastructure development where food and agro-based processing units operate within shared facilities, utilities and supply chains. These parks typically function in a hub-and-spoke formation: collection centres and primary processing centres in rural areas feed raw materials into a central processing hub equipped with cold storage, warehousing, common packaging lines and quality testing labs.
Agro-processing hubs transform raw products into higher-value goods. An average processing industry has 85 backward and 123 forward linkages, connecting farmers, transporters, equipment suppliers and markets into a single economic chain. Agro-processing units can achieve 53% value addition on average, and fruits and vegetable processing shows maximum value addition at 133%. Agro-food parks enhance agricultural productivity and rural development across the catchment.
For parks with project costs ranging from ₹150 crore to ₹600 crore, professionally prepared agro processing park financial projections are essential for term loan appraisal, investor evaluation and scheme-level approvals under MoFPI guidelines. The projections must integrate sustainable agricultural practices in the catchment, sourcing from smallholder farmers, phased infrastructure development and alignment with broader sustainable development objectives. This article covers projected Profit & Loss, Cash Flow, Balance Sheet, DSCR, IRR, NPV, ROI, payback period, break-even, sensitivity analysis and risk assessment from the perspective of a practising Chartered Accountant advising serious project promoters.
Executive Summary and Key Financial Takeaways
A well-structured financial model for an agro processing park should answer three questions for any investor or lender: what is the stabilised earning capacity of the park SPV, how reliably can it service debt, and what return does the equity investment generate over a 15-20 year horizon?
Consider an illustrative park profile: a 75-100 acre development in a major agricultural state, total project cost around ₹280 crore, mix of industrial plots, built-up sheds, cold stores and common processing facilities. At stabilised occupancy (Year 5 onwards), such a park’s EBITDA margin on rental and service income may range from 45% to 60%. Average DSCR acceptable to most banks falls in the range of 1.40x to 1.80x, and project IRR may fall in the low-teens to high-teens depending on land cost, occupancy speed and tariff structure.
Slow occupancy, higher construction cost, interest rate changes and delays in utility connections compress both DSCR and IRR. All numbers in this article are purely illustrative; every project must be tested with its own assumptions, demand study, Agro Processing Cluster Project Report and location-specific data.
Financial Model of an Agro Processing Park
The park developer or SPV earns revenue by developing land and infrastructure over a long cycle and monetising it through leases, rentals and service charges. Preparing financial projections for an agro-processing park requires blending real estate income streams with utility infrastructure services into a single model.
The SPV’s own revenue (lease premiums, shed rentals, utility margins, common facility usage fees) must be modelled separately from the production and sales of tenant units such as flour mills, dairy plants, cold chain operators or spice processing units. While financiers evaluate park-level cash flows, they also assess tenant categories and the Agro Processing Park Industry Mix to judge whether projected occupancies and collections are achievable.
The hub-and-spoke system, where collection centres in rural areas feed the central hub, strengthens supply chains from smallholder farmers and reduces raw material risk for tenants. Financial modelling tools, typically Excel-based, should maintain linked sheets for assumptions, revenues, operating costs, capex, funding, depreciation, tax, working capital and debt schedules.
Capital Investment and Project Cost Structure
Accurate project cost estimation is the starting point for credible agro processing park financial projections and for planning means of finance. CapEx for an agro-processing park is usually divided into land acquisition (or long-term lease) and core infrastructure costs. Financial models for agro-processing parks must incorporate capital expenditure components for utilities and infrastructure alongside civil works.
Major cost heads include:
- Land acquisition or long-term lease and land development
- Internal roads, compound wall, storm water drainage and water supply grid
- Power distribution network and street lighting
- Industrial sheds, warehouses, cold storage facilities
- Common processing and packaging facilities, testing labs
- Effluent treatment plant (ETP) and sewage treatment plant (STP)
- Administrative block, ICT/SCADA systems and basic amenities
- Design, engineering, statutory approvals and pre-operative expenses
- Interest during construction (IDC), contingency (5-10% of base cost) and equipment for quality control
Under MoFPI’s Mega Food Park scheme, the average project cost for approved parks through 2021 stood at ₹110.92 crore for eligible infrastructure. Detailed breakdowns for land and infrastructure assumptions are covered in Agro Processing Park Setup Cost and Agro Processing Park Land Requirement. The model must classify costs between depreciable assets and non-depreciable land, tying them correctly into depreciation computation and Income Tax Act block-of-asset rates.
Revenue Model and Income Sources for the Park SPV
A bankable model must clearly distinguish recurring income from one-time recoveries and deposits. Revenue projections should include income from land lease, factory rentals and utility charges as the primary recurring streams.
Recurring income sources:
- Monthly rentals from ready-built industrial sheds
- Long-term ground lease charges for plots
- Warehousing and cold storage rental income
- Margins on utilities (power, water, steam, compressed air) as described in Agro Processing Park Common Utilities
- Charges from Agro Processing Park Common Packaging Facilities
- Testing lab fees, weighbridge income and common logistics yard usage
Utilisation of common facilities in agro-parks impacts revenue generation and should be modelled carefully. In the Tumkur Food Park, for example, cold rooms are charged at approximately ₹2,050 per palette per month, and IQF lines at roughly ₹8/kg. Shed rentals run around ₹20/sq.ft/month with annual escalation of 4-6%.
One-time or non-recurring items (upfront lease premiums, development charges, connection charges, refundable security deposits) must not be recorded as operating revenue. Fruits and vegetable processing can yield up to 133% value addition for tenant units, but that turnover belongs to the tenant, not the park SPV.
Occupancy and Capacity Utilisation Assumptions
Occupancy ramp-up is the single most critical assumption impacting DSCR, profitability and IRR for an agro processing park. Occupancy rates should be modeled realistically rather than assuming immediate full occupancy.
A realistic timeline involves construction over 24-36 months, phased completion of sheds and common facilities, and rental commencement aligned to actual handover dates with grace periods for tenant fit-out. Occupancy curves should reflect:
- Year 1-2: 20-35% occupancy (early anchor tenants, initial allotments)
- Year 3-4: 50-70% occupancy (secondary allotments, word-of-mouth traction)
- Year 5 onwards: 80-90% stabilised occupancy
Agro Processing Park Anchor Tenant Selection with strong corporates or cooperatives reduces risk and improves lender confidence. Capacity utilisation for common assets (cold stores, warehouses, utilities) requires separate assumptions: tonnes handled, pallet positions occupied, kWh sold and cubic metres of water billed, each feeding into revenue calculations independently.
Operating Expenditure and Park Management Costs
Operating expenses for agro-processing parks should distinguish between fixed and variable costs. Fixed costs (administration, security, minimum staff, base utilities, insurance) remain constant regardless of occupancy. Semi-variable costs (energy consumption, maintenance proportional to usage, waste treatment volumes) scale with tenant activity.
Key O&M cost heads:
- Salaries and wages for park management and maintenance staff
- Outsourced security and housekeeping
- Repairs and maintenance of infrastructure
- Electricity for street lighting and common areas; water pumping
- ETP/STP operating costs
- Administrative costs (office, IT, communication)
- Legal, audit and regulatory compliance costs
- Property insurance and third-party liability
- Marketing and tenant acquisition expenses
Some costs should be allocated between recoverable (through CAM charges and utility tariffs) and non-recoverable (park’s own overheads). Environmentally compliant operations for agro-residue management may increase certain Opex lines but can improve eligibility for green finance. Operating cost projections over 10 years should reflect normal inflation at 5-6% per annum with step-ups for major infrastructure overhaul in specific years.
Projected Profit and Loss Account (10-Year Horizon)
Sustainable financial projections cover a 10-15 year period for agro-processing parks. The Profit and Loss Statement tracks gross margins, EBITDA, depreciation and net profit for the park SPV. Investors and bankers expect at least 10-15 years of projected P&L.
The structure flows from revenue lines (rentals, leases, utility margins, common facility income) minus operating expenses to derive EBITDA, then deducts depreciation, interest and tax to arrive at Profit After Tax (PAT).
| Year | Total Income (₹ Cr) | Opex (₹ Cr) | EBITDA (₹ Cr) | EBITDA % | Depreciation | Interest | PBT | Tax | PAT |
|---|---|---|---|---|---|---|---|---|---|
| 1 | 8.5 | 6.2 | 2.3 | 27% | 4.8 | 12.5 | (15.0) | 0 | (15.0) |
| 3 | 22.0 | 9.5 | 12.5 | 57% | 4.6 | 10.8 | (2.9) | 0 | (2.9) |
| 5 | 35.0 | 13.0 | 22.0 | 63% | 4.4 | 8.5 | 9.1 | 2.3 | 6.8 |
| 7 | 42.0 | 15.5 | 26.5 | 63% | 4.2 | 6.0 | 16.3 | 4.1 | 12.2 |
| 10 | 52.0 | 19.0 | 33.0 | 63% | 3.9 | 2.5 | 26.6 | 6.7 | 19.9 |
All figures illustrative only, for methodology explanation. Not industry benchmarks.
Gradual occupancy ramp-up moves the park from initial accounting losses to steady profitability. The P&L must be consistent with realistic tenant economics derived from reports like Multi-Tenant Agro Food Processing Park Project Report.
Projected Cash Flow and Balance Sheet Linkages
Cash flow, not accounting profit, is central for agro processing park financial projections, particularly for debt servicing capacity and IRR calculations. Cash flow statements are essential for mapping liquidity during seasonal cash inflows from agro-parks. Agro-processing parks should account for working capital fluctuations due to seasonal raw material availability affecting tenant payment cycles.
Operating cash flow derivation: start from PAT, add back depreciation and non-cash charges, adjust for working capital changes (receivables, payables, spare parts inventory) to arrive at cash flow from operations.
Construction-period cash flows cover capex outflows, IDC, promoter equity infusions, drawdown of term loans and any grant/subsidy receipts. Realistic EPC disbursement schedules, similar to those in Integrated Grain Industrial Complex Infrastructure and EPC Cost, must be modelled.
The projected Balance Sheet shows fixed assets net of depreciation, capital work-in-progress, current assets, current liabilities, term loan outstanding, promoter equity and reserves. Every cash movement must reconcile between P&L, cash flow and balance sheet: capex to fixed assets, depreciation to accumulated depreciation, loan amortisation to term loan outstanding, and retained earnings to reserves.
DSCR Analysis for Bank Finance
The Debt Service Coverage Ratio (DSCR) measures the ability to service debt obligations from operational income. For agro processing parks, DSCR equals Cash Flow Available for Debt Service (CFADS) divided by total scheduled debt obligations (interest plus principal) for the year. Some banks adjust the numerator for specific items; definitions vary by lender.
Guided numerical example (illustrative): if CFADS in Year 5 is ₹40 crore and total term loan repayment plus interest is ₹25 crore, the annual DSCR is 1.60x. This single-year figure must be examined alongside average DSCR (across the full loan tenure) and minimum DSCR (the weakest single year).
Banks evaluating agro processing parks generally expect average DSCR in the range of 1.40x to 1.75x, with minimum annual DSCR not falling below approximately 1.20x. Parks with higher perceived risk may face stricter requirements.
Occupancy delays and cost overruns compress DSCR directly. Banks may require conditions such as minimum pre-leasing commitments, escrow of park receivables, creation of a Debt Service Reserve Account (DSRA) and DSCR-based covenants. CMA Data and realistic loan repayment structuring are essential for term loan sanction.
IRR, NPV, ROI and Payback Period for Agro Processing Parks
Project IRR measures returns on total project free cash flows; equity IRR measures returns on cash flows attributable only to equity investors after debt funding and repayments. IRR is the discount rate where NPV equals zero. A project with an IRR of 15% indicates a 15% annual return on the invested capital. IRR is useful for comparing multiple investment opportunities, and a project is viable if IRR exceeds the cost of capital.
Cash flow streams for IRR computation begin with initial negative outflows during construction, followed by net cash inflows from operations, and terminal value at the end of an appraisal horizon (e.g., Year 20-25) based on capitalisation of stabilised net operating income.
NPV is the sum of future cash flows discounted to present value, typically using a discount rate near the weighted average cost of capital. ROI can be computed as average annual profit divided by total investment. Payback period tracks when cumulative cash flows turn positive; for plantation crop processing projects under similar frameworks, payback periods of 3 years 5 months have been reported with IRR around 22%.
For infrastructure-style parks, both project IRR and equity IRR should be compared against hurdle rates. Lenders also examine predictable CFADS trends, reasonable payback horizon and sensitivity of the internal rate of return to changes in key variables.
Break-Even and Profitability Analysis
Break-even analysis indicates the occupancy level at which revenue covers all cash operating expenses and debt service obligations (cash break-even) or covers Opex plus depreciation (accounting break-even). Break-even analysis indicates processing units can operate at low capacity levels and still reach viability, particularly when fixed costs are managed tightly.
Fixed costs (administration, minimum staff, base maintenance) create operating leverage; once these are covered, incremental revenue from additional tenants flows almost entirely to EBITDA. Variable and semi-variable costs (energy, throughput-linked maintenance) scale with usage.
Slow tenant onboarding and lower tariffs depress EBITDA margins and delay break-even. Strong anchor clients and integrated value chains with reliable supply from smallholder farmers accelerate it. Financial ratios reveal high current ratios in processing industries, indicating manageable short-term liquidity. Small agro-processing units have more favorable financial ratios than large ones, a pattern relevant when evaluating tenant credit quality.
At stabilised occupancy, EBITDA margins for the park SPV may range from 45% to 63% (illustrative), depending on the mix of plot leases, shed rentals and service income.
Sensitivity and Scenario Analysis
Robust agro processing park financial feasibility assessment is incomplete without structured sensitivity and scenario testing. Scenario planning is necessary to understand the financial resilience of agro-processing parks against market fluctuations.
Three core scenarios:
- Optimistic: Faster occupancy (80% by Year 3), tariffs 5% above base, capex within budget
- Base Case: Occupancy per standard ramp-up, planned tariffs, capex at budgeted levels
- Downside: Occupancy delayed by 12-18 months, 10-15% capex overrun, interest rate +100 bps, construction delay of 6-12 months
Variables to flex: occupancy ramp-up profiles, rental rates and escalation, utility throughput, capex levels, Opex inflation and lending interest rate. Sensitivity analysis should evaluate risks such as raw material price fluctuations and occupancy delays.
Each scenario should output revised DSCR, project and equity IRR, NPV, cash shortfall years and required additional equity. Scenario analysis helps identify early-warning thresholds (e.g., occupancy below 55% in Year 4 leads to DSCR below 1.20x) and design mitigation strategies accordingly.
Illustrative Financial Projection Tables and Assumptions
All tables below are labelled illustrative and should not be treated as industry benchmarks. Each project must develop its own numbers.
Tables recommended for a complete DPR:
- Project Cost and Means of Finance summary (₹ crore) over construction period
- 10-year revenue and operating cost table
- 10-year Profit & Loss summary
- 10-year cash flow statement including CFADS and DSCR
- Term loan amortisation schedule
- IRR and NPV summary based on projected free cash flows
Assumptions must be explicitly disclosed: land area developed, number and size of sheds and warehouses, assumed average rentals, occupancy by year, capex phasing, interest rate, loan tenure and moratorium period.
Similar modelling approaches are applied in other agro-industrial infrastructure projects such as the Integrated Grain Industrial Complex Project Report, where comparable methods are used for phased capex, revenue ramp-up and debt structuring.
Financial Risks and Mitigation Strategies
Even financially attractive agro processing parks face specific risks. Agro-processing parks often face unique vulnerabilities related to agricultural supply chains, tenant concentration and infrastructure execution.
Key risks:
- Occupancy risk: delayed leasing, competition from other parks
- Tenant credit and collection risk: defaults in rental payments
- Concentration risk: over-dependence on a few large tenants or a single commodity
- Construction delay and cost overrun risk: civil works, utility connections, regulatory approvals
- Regulatory and environmental compliance risk: ETP/STP norms, waste management
- Interest rate risk: floating rate loans, rate increases during early operations
- Utility tariff escalation: power and water cost increases
Mitigation measures include pre-leasing and anchor tenant MoUs, diversified tenant and industry mix, escrow of receivables, conservative capex contingencies, fixed-price EPC contracts where possible, adequate insurance and adoption of sustainable agricultural practices to access concessional credit. Robust legal documentation with long-term lease agreements, step-in rights for lenders and clear frameworks for tenant default handling is essential.
Bank Loan, Investor Funding and DPR Requirements
Banks, NBFCs and institutional investors evaluate agro processing park proposals through Detailed Project Reports (DPR), financial projections and CMA Data. Government grants and subsidies can lower the financial burden on agro-processing projects; under MoFPI’s Mega Food Park scheme, grants cover up to 50% of non-land cost capped at ₹50 crore.
A bankable DPR must contain: market demand assessment, catchment analysis including the role of smallholder farmers, detailed project cost, means of finance plan, implementation schedule, projected financial statements, DSCR and sensitivity analysis. Both public and private stakeholders require transparency in assumptions.
Funding structure considerations include typical debt-equity ratios of 70:30 or 80:20, use of sub-debt or quasi-equity, working capital lines for park operations and options for later refinancing. Common lender expectations cover minimum promoter contribution paid upfront, DSRA creation, maintenance of financial covenants, periodic reporting and independent monitor reports. Professional advisory is essential for navigating the complexities in agro-processing project financing.
Frequently Asked Questions
What DSCR do banks typically expect for an agro processing park project?
While exact thresholds vary by bank and risk profile, many lenders in India are comfortable when projected average DSCR falls in the range of 1.40x to 1.75x, with minimum DSCR generally not below 1.20x in any year. Parks with higher perceived risk (greenfield location, limited anchor tenants, single-commodity focus) may require stronger DSCR buffers or higher promoter equity. These are indicative references; each park’s DSCR expectation is negotiated based on sponsor strength, anchor tenant commitments and overall project risk.
How should government grants and capital subsidies be treated in financial projections?
Grants from central or state schemes should be modelled as non-debt funding, reducing effective project cost or debt requirement, but not counted as recurring operating income. Government subsidies play a vital role in enhancing the financial viability of agro-processing parks. Conservative timelines for grant receipt (often post-completion and verification) should be assumed, and a downside case where subsidy is delayed or only partially sanctioned must be tested so that DSCR and IRR remain acceptable even without immediate grant inflow.
Can security deposits and maintenance advances be considered part of project profitability?
Refundable security deposits from tenants are liabilities, not income. They strengthen short-term liquidity but should not be recognised as revenue in the Profit & Loss account. Advance maintenance collections should be recognised as income only as services are rendered (periodic amortisation). Financial projections must reflect this accounting treatment for credibility with lenders and auditors.
How do sustainable agricultural practices and smallholder farmers affect project feasibility?
Integrating sustainable agricultural practices in the catchment, along with organised collection from smallholder farmers, reduces raw material supply risk for processing units and makes the park more resilient. Such integration supports sustainable development goals and may enhance eligibility for green or blended finance, slightly improving cost of capital and long-term IRR profile. Parks that invest in technical assistance to farmer groups in the catchment typically report lower tenant attrition and more stable facility utilisation.
Over what project life should IRR be evaluated for an agro processing park?
Project IRR for a substantial agro processing park is usually evaluated over 20-25 years to reflect the long economic lifetime of infrastructure assets and long-term leases. Within this horizon, investors focus on the first 10-15 years of cash flows for DSCR, payback and near-term equity IRR, often including a potential refinancing or partial exit event assumption around stabilisation. Research into comparable infrastructure projects confirms that shorter evaluation periods can understate the full value creation of such assets.
Professional DPR and Financial Advisory by Project Report Bank
Large agro processing parks require customised, professionally validated financial models to secure bank finance and institutional investment. CA Manish Gugliya and Project Report Bank support promoters with preparation of project-specific DPRs, granular agro processing park financial projections, CMA Data for bank loans, DSCR and IRR analysis, scenario modelling and assistance in structuring term loans and working capital facilities. The practice draws on expertise across agro-processing, food parks, integrated grain complexes and industrial infrastructure projects.
Serious project promoters, state agencies, SPVs and investors planning agro processing parks in India should engage Project Report Bank early in the planning cycle. Contact us with your proposed location, land parcel details, tentative project cost and funding plan for a tailored discussion on financial viability, DSCR, IRR and profitability expectations.