Key Takeaways
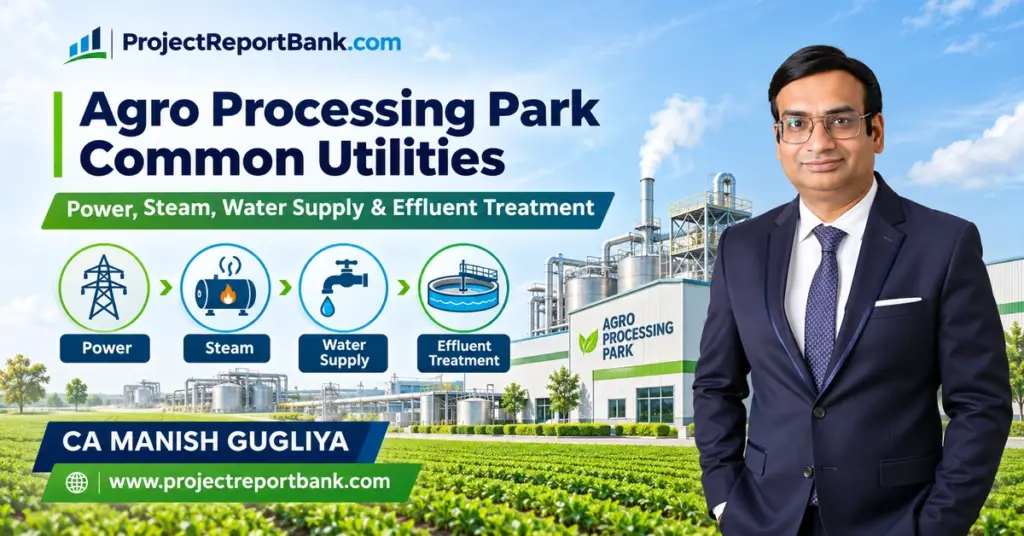
- Agro processing park common utilities – covering shared power distribution, steam generation, industrial water supply, cold storage support and centralised effluent treatment – form the core infrastructure that determines both the operational efficiency and bankability of food parks and agro processing clusters across India.
- Shared infrastructure for power, steam, water and effluent treatment can reduce project cost for individual food processing units by an estimated 20–30% compared to stand-alone plants, while improving regulatory compliance and operational reliability.
- Correct utility sizing, phased capacity planning and transparent cost-recovery mechanisms directly influence the financial feasibility of the park SPV, including DSCR stability, IRR and lender confidence during bank appraisal.
- Utilities must accommodate seasonal demand peaks inherent in agricultural processing – oversizing leads to idle capital, while undersizing constrains food production and damages tenant relationships.
- Project Report Bank, led by CA Manish Gugliya (FCA, DISA, 20+ years of experience), prepares customised detailed project reports, financial models and CMA data for agro processing clusters, food parks and utility SPVs, supporting promoters planning ₹5 crore and above projects.
Introduction – Why Common Utilities Matter in Agro Processing Parks
India’s food processing sector has expanded significantly since 2010–11, driven by rising domestic demand, export growth and sustained policy support from the Ministry of Food Processing Industries (MoFPI). Agro processing parks, food parks and agro processing clusters have emerged as policy instruments to create modern infrastructure that helps processing industries achieve scale, regulatory compliance and supply chain efficiency. The objective is straightforward: bring multiple food processing units together in a planned cluster with common facilities – so that individual businesses, especially MSMEs, do not each have to invest separately in substations, steam generation boilers, water treatment systems, effluent treatment plants and cold chain infrastructure.
Agro processing park common utilities typically include shared power distribution (HT connections, substations, internal electrical networks), centralised steam and thermal energy systems, industrial water supply and treatment, firewater systems, cold storage and pre cooling chambers, and centralised ETP and STP facilities. These common utilities also extend to quality testing laboratories, common office space, weigh bridges, packaging units and other common processing facilities. Agro-processing parks require specialized utility infrastructure for processing, cold chain management and compliance – without which individual units face prohibitive entry barriers.
Under the mega food park scheme launched in 2008 by MoFPI, the government provides a 50% capital grant on eligible project cost. As of June 2024, 41 mega food parks have been approved across India, creating over 1 lakh jobs. The first mega food park was established in Chittoor, Andhra Pradesh. Notable examples include Srini Mega Food Park and Patanjali Food & Herbal Park, each demonstrating different approaches to common infrastructure. Meanwhile, MoFPI has also approved 76 agro processing cluster projects under the PMKSY framework, with agro processing clusters requiring a minimum investment of Rs. 25 crores and each cluster including at least five food processing units. The scheme supports grants in aid of 35% to 50% of eligible project cost – with higher percentages applicable for north east states and state notified ITDP areas. These agro processing clusters aim to reduce post harvest losses by 80% through modern infrastructure, shared cold storage facilities, primary processing centres and a central processing centre linked to collection centres. Agro-processing clusters require basic enabling infrastructure like roads, water supply, drainage systems and electricity supply, all of which state governments are expected to facilitate alongside financial assistance from central scheme guidelines.
For detailed cluster-level planning, promoters may refer to the Agro Processing Cluster Project Report, DPR & Investment Guide, which covers DPR-level industry mix, site development, utility layout and financial structuring.
Shared Power Infrastructure in Agro Processing Parks
Reliable electricity supply is non-negotiable for food processing infrastructure – cold storage compressors, freezing lines, packaging machines, lighting and process controls all require uninterrupted power. In many Indian industrial areas, voltage dips, frequency fluctuations and unplanned outages remain common, making dedicated power infrastructure a critical planning element. Power and energy utilities need high-tension power supply and backup generation systems to ensure continuous operations.
Design Concepts and HT Connection Sizing
The design of a park’s electrical system begins with estimating connected load (the sum of all installed electrical loads in kW across all units), maximum demand (peak kVA drawn simultaneously, adjusted for diversity), and load factor. A diversity factor of 0.6–0.8 is commonly applied in multi-tenant food parks because not all units operate at full capacity simultaneously. These metrics determine the size of the HT connection (typically 11 kV or 33 kV feeder from the local DISCOM), transformer capacity and internal distribution architecture.
Standard arrangements include:
- Incoming 33 kV or 11 kV dedicated feeder from the nearest grid substation
- Park-level 33/11 kV or 11/0.433 kV step-down substation with ring main units (RMUs)
- LT distribution panels with individual metering for each processing unit
- SCADA or automated metering for smart utility management – digital infrastructure requires high-speed connectivity for monitoring consumption, peak demand and power quality across all units
Power Intensity by Industry Segment
Utility demand varies considerably across processing industries:
- Grain and cereal milling: 30–100 kWh per tonne (mainly motor loads)
- Oilseed solvent extraction and refining: moderate to high (motors, seed conditioning, refining auxiliaries)
- Dairy processing (liquid milk): 30–50 kWh per kilolitre for pasteurisation and pouch packing; higher for multiproduct lines (50–80 kWh/kL)
- IQF, frozen food and cold storage: very high continuous electrical load – compressors, evaporators, blast freezers – often 100–200 kWh per m³ of storage capacity annually
- Spice grinding, specialized packaging and packing facilities: moderate, largely motor-driven
For a detailed treatment of dairy-specific utility infrastructure, see Dairy Plant Utilities: Power, Water, Steam & ETP.
Power Backup and Solar Integration
DG backup is typically sized for 40–60% of peak load, covering essential cold chain, critical process lines and safety systems. Fuel storage norms, noise attenuation and emission compliance for DGs should be factored into both site layout and project cost.
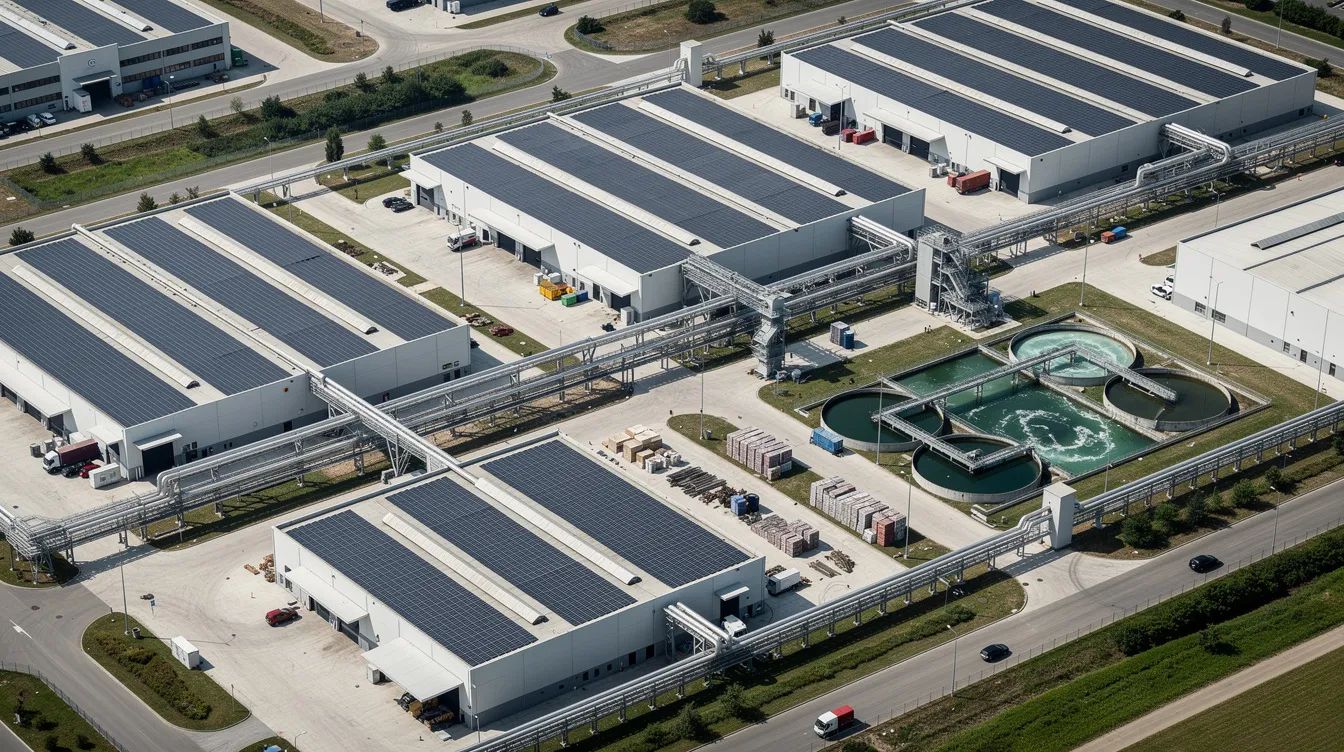
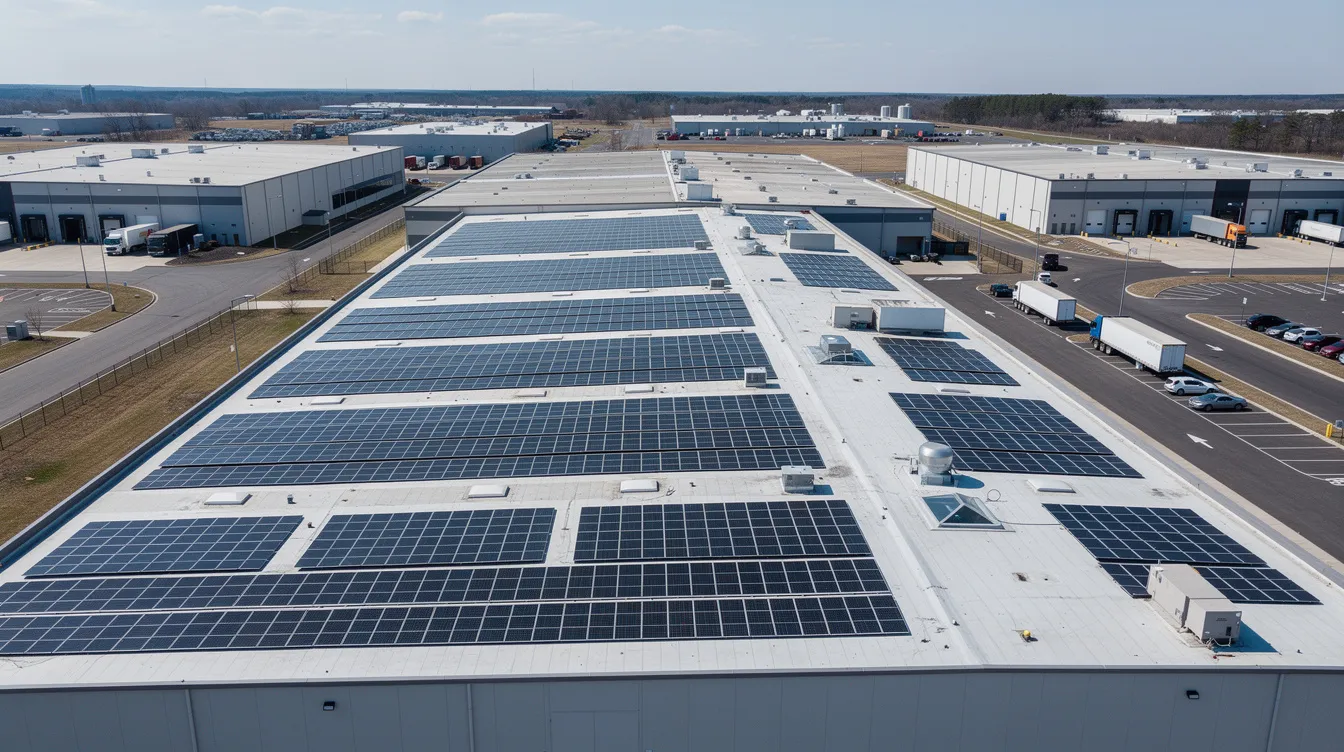
Renewable energy sources, such as solar installations, lower operational costs for agro-parks significantly. Rooftop solar on warehouses and processing sheds is increasingly viable – PEB roof installations cost approximately ₹2.2 crore per MW (ex-GST), generating roughly 15–16.5 lakh units per MW per year. A 25-acre park with adequate roof area can potentially install 1–3 MW of rooftop solar, reducing grid dependence and improving green branding. The payback period for MW-scale rooftop installations has dropped to 1.3–3 years in many Indian states, depending on HT tariff and accelerated depreciation benefits.
The power distribution commercial model – whether the developer owns the internal network with wheeling charges or individual units obtain direct DISCOM connections – affects tariffs, bankability and DPR structuring. For integrated grain-based parks where power layout is especially critical, promoters may review the Integrated Grain Industrial Complex Project Report.
Centralised Steam and Thermal Energy Systems
Steam is essential across a wide range of agro processing and food processing operations: blanching, pasteurisation, sterilisation, retorting, edible oil refining, CIP (clean-in-place) systems, dehydration and canning. Thermal and steam utilities include centralized high-pressure steam generation systems serving multiple tenants through insulated steam headers. Agro-processing involves heavy heating and cooling loads that parks can support collectively through centralised boiler houses rather than dozens of scattered small boilers.
Boiler Types and Capacity Selection
Centralised boiler houses typically deploy 5–20 TPH (tonnes per hour) packaged boilers – either fire tube or water tube – depending on the required steam pressure, fuel availability and local emission norms. Common fuel options include biomass (rice husk, bagasse, wood chips), coal (where permitted), natural gas/PNG (where pipeline gas is available) and furnace oil.
Indicative boiler equipment costs in 2024–25:
| Boiler Capacity (TPH) | Fuel Type | Indicative Equipment Cost (₹) |
|---|---|---|
| 1–3 TPH | Gas/Oil | ₹22–55 lakh |
| 5–10 TPH | Biomass/Coal/Gas | ₹85 lakh – ₹1.6 crore |
| 10–20 TPH | Biomass/Coal | ₹1.6 – ₹3 crore |
| 20–30 TPH | Biomass/Coal | ₹3 – ₹5 crore+ |
These figures cover boiler packages only. Add 20–40% for civil foundation, fuel handling and storage, chimney, emission control equipment (ESP, bag filters), water treatment and instrumentation.
Steam Pressure Levels and Distribution
Different processing lines require different steam conditions:
- Low pressure (1–3 bar saturated): blanching, hot water, CIP systems
- Medium pressure (5–10 bar): sterilisation, retorting, UHT processing
- High pressure (>15 bar): large dryers, turbine drives in anchor plants
A central system serves multiple pressure levels using steam headers and pressure reducing valves (PRVs). Condensate recovery – including flash steam recovery and returning hot condensate to the boiler – is critical for reducing fuel consumption by 10–15% and directly improves operating economics reflected in DPR financial projections.
When Centralised Steam Makes Sense
Centralised steam is financially justified when a minimum anchor load exists – for example, an oil refinery combined with a large ready-to-eat food plant, or a dairy processing anchor tenant. Below a threshold thermal load (roughly 3–5 TPH continuous demand), the economics of centralised piping, insulation losses and standby capacity may not justify the investment. In such cases, large tenants may install their own boilers while smaller units use electric heating or small gas-fired steam generators.
Risk factors include fuel price volatility, biomass availability (seasonal, moisture-dependent), local emission norms and the need for EPC performance guarantees – all of which banks scrutinise during project appraisal.
Industrial Water Supply, Treatment and Firewater Systems
Water is critical for agro processing operations: process water for washing, cooking and formulation; utility water for cooling towers and boiler feed; CIP system water; domestic water for staff; and dedicated firewater for safety systems. Water supply systems must include multiple sources and adequate treatment for food-grade quality to meet both FSSAI and operational requirements.
Raw Water Sourcing and Treatment
Typical raw water sources in Indian parks include groundwater via tube wells (where extraction permits are available), surface water from canals or rivers (requiring water drawal permission from the irrigation department), treated municipal supply or a combination. The choice of source influences the treatment train and operating costs significantly.
A standard treatment train comprises: raw water storage → aeration (for iron/manganese removal) → clarification and coagulation → filtration (sand/multimedia filters) → softening (ion exchange for boiler feed) → RO (where low TDS or high purity is required for food-grade applications) → separate distribution lines for process water, utility water and drinking water (IS 10500 compliance). Water source distance, elevation and pipeline routing should be integrated with overall park layout planning, as discussed in Agro Processing Park Land Requirement & Site Selection.
Water Consumption Benchmarks
Broad water consumption bands for initial feasibility:
| Industry Segment | Water Requirement (m³/tonne) | Key Water Uses |
|---|---|---|
| Dairy processing | 2–5 | CIP, washing, cooling, potable steam |
| Fruit & vegetable processing | 10–20 | Washing, peeling, blanching, CIP |
| Grain and cereal milling | 1–3 | Conditioning, cleaning |
| Cold storage & logistics | Limited | Cleaning, cooling tower make-up, domestic |
| Beverage processing | 2–5 | Formulation, CIP, washing |
These ranges are illustrative; actual demand depends on product mix, automation level and process technology.
Firewater and Fire Safety
Fire safety infrastructure is critical, including dedicated firewater storage and alarm systems. Norms typically require firewater storage sufficient for 2–3 hours at the design flow rate of the fire pump system. A park with design fire flow of 150 m³/hr would need dedicated storage of 300–450 m³, separate from process and domestic water systems. Hydrant networks, sprinkler connections for dry warehouse blocks, cold storage and processing sheds, and a fire alarm system are integral to obtaining the statutory fire NOC.
| Water Category | Quality Standard | Typical Users | Storage Norms |
|---|---|---|---|
| Process Water | FSSAI/IS 10500 potable | Food contact, CIP, formulation | Based on daily demand + buffer |
| Utility Water | Softened/treated, non-potable | Boiler feed, cooling towers | Linked to equipment specs |
| Firewater | No quality specification | Hydrants, sprinklers | 2–3 hours at design flow rate |
Common Effluent Treatment Plant (ETP), STP and Wastewater Recycling
Effluent treatment plants help manage waste from food processing units – this is both an environmental obligation and a condition for bank finance and long-term park viability. Effluent from food parks typically includes wash water, CIP discharges, process losses, oil and grease (from oilseed and dairy operations), high BOD/COD wastewater (especially dairy and meat processing) and domestic sewage from staff facilities.
ETP vs STP: Why Parks Need Both
An agro processing park usually requires both an effluent treatment plant (for industrial wastewater) and a sewage treatment plant (for domestic sewage from offices, canteens, hostels and sanitary blocks). Effluent treatment plants are essential for waste management in food parks, while STP handles domestic sewage to municipal discharge standards.
Treatment Process
A typical food park ETP treatment train includes: screening → oil and grease traps → equalisation (for flow and load balancing, pH correction) → physico-chemical treatment (coagulation/flocculation) → primary sedimentation → aerobic/anaerobic biological treatment (activated sludge, MBBR or SBR) → tertiary filtration and disinfection → sludge dewatering and handling. Solid waste management systems should be integrated for processing agricultural by-products, sludge and organic residues effectively.
Common ETP Operating Model
In a multi-tenant park, each unit installs basic pre-treatment (screens, oil traps, pH correction) before discharging into a common effluent collection network. The central ETP treats combined wastewater. Billing is based on flow volume and pollutant load – incentivising units to minimise wastewater generation and pre-treat adequately.
Treated Effluent Reuse and ZLD
Treated effluent can be reused for gardening, toilet flushing and cooling tower make-up (where quality permits), reducing fresh water draw. Zero Liquid Discharge (ZLD) is not always mandatory – it depends on the State Pollution Control Board’s requirements for the specific location. ZLD is more commonly mandated in water-stressed regions or for high-pollution categories. Adding ZLD can increase ETP CAPEX by 40–80% or more and significantly raises OPEX through additional energy, chemicals and membrane replacement costs.
Regulatory Compliance
Consent to Establish (CTE) and Consent to Operate (CTO) from the State Pollution Control Board are non-negotiable for any food park. Typical discharge norms require BOD <30 mg/L and COD <250 mg/L for surface water discharge, though stricter limits apply in ecologically sensitive zones. ETP capacity and technology selection must be based on a realistic industry mix and effluent characterisation – not generic assumptions.
Utility Demand Estimation for Different Agro Processing Industries
Correct sizing of agro processing park common utilities depends on the projected industry mix, production capacities and phasing plan – all of which form core elements of a professional DPR. Proximity to processing units is essential for common facilities like cold storage and processing lines, influencing both layout design and utility network routing.
Utility Demand Matrix
| Industry Segment | Power Intensity | Steam Requirement | Water Requirement | Effluent Load Nature |
|---|---|---|---|---|
| Grain & cereal milling | 30–100 kWh/tonne | Minimal (unless baking/germination) | 1–3 m³/tonne | Low BOD/COD; suspended solids |
| Oilseed processing | Moderate–high | 2–5 TPH for conditioning, refining | Moderate (cooling, scrubbers) | Oil & grease; high COD |
| Dairy (liquid milk) | 30–50 kWh/kL | 55–90 kg steam/kL | 2–5 m³/tonne | High BOD/COD; fats; variable pH |
| Fruit & vegetable | 50–150 kWh/tonne | Blanching, drying, sterilisation | 10–20 m³/tonne | High solids; sugar/organics |
| Cold storage & logistics | 100–200 kWh/m³/year | Minimal | Limited | Mainly cooling tower blowdown |
| RTE/RTC foods | Moderate–high | Sterilisation, retort, drying | 3–8 m³/tonne | Moderate–high BOD/COD |
Cold chain infrastructure involves temperature-controlled storage and specialized freezing facilities, while cold storage facilities are essential for preserving perishable produce. Parks in horticultural zones may also require ripening chambers and pre cooling chambers as common facilities, along with packing facilities for agricultural produce.
Values quoted must be treated as illustrative engineering assumptions for initial feasibility – actual requirements depend on product lines, automation level and climatic conditions. For integrated rice and grain-based parks, see the Integrated Rice Milling & Processing Project Report.
Promoters, along with consultants, should identify anchor tenants early and use their tentative capacity plans to anchor the first phase of utility sizing. For industry mix optimisation strategies, refer to Agro Processing Park Industry Mix & Value Chain Integration. The financial consequence of incorrect sizing is significant: oversizing utilities leads to idle capital and lower IRR, while undersizing leads to production constraints and tenant disputes.
Quality control laboratories ensure compliance with food safety standards – parks should plan for shared quality testing laboratories and a food testing laboratory as part of the common analytical and support infrastructure. Agro-processing clusters provide shared cold storage facilities and quality control laboratories available to all food processing parks tenants.
Centralised vs Individual Utilities – Financial and Operational Comparison
Two primary models exist for utility provision: fully centralised park utilities owned by an SPV (incorporated under the Companies Act), and individual utilities within each plot with minimal common services. Hybrid models – where core services like ETP and power distribution are centralised while steam and cold storage are tenant-specific – are increasingly common.
Key Comparison
| Aspect | Centralised Utilities | Individual Utilities |
|---|---|---|
| Capex per unit | Lower (shared investment) | Higher (each unit bears full cost) |
| Operating cost per unit | Cost-reflective tariffs; economies of scale | Varies; no scale benefit |
| Regulatory compliance | Single ETP/STP; centralised monitoring | Each unit responsible; harder to enforce |
| Reliability | Designed redundancy; professional O&M | Depends on individual unit’s investment |
| Expansion flexibility | Modular augmentation possible | Independent; no coordination needed |
| Billing complexity | Requires metering, agreements, tariff framework | Simple; each unit manages own bills |
Centralised utility management leads to better resource conservation and operational efficiency. Agro-processing parks rely on centralized utilities to lower individual processing costs – this is the fundamental economic rationale for the cluster model. Shared infrastructure is most advantageous in MSME-dominated parks with 10–50 processing units.
Illustrative Financial Comparison: Centralised vs Individual ETP
Consider a park needing 1 MLD (1,000 KLD) total effluent treatment capacity:
- One centralised 1 MLD ETP: indicative CAPEX ₹2–5 crore; annual O&M 8–12% of CAPEX
- Ten individual 100 KLD ETPs: indicative CAPEX ₹35–80 lakh each (total ₹3.5–8 crore); higher aggregate O&M, more manpower, less consistent compliance
The centralised approach typically reduces aggregate CAPEX by 25–40% and improves treatment consistency. Lenders prefer a well-structured central utility SPV with transparent tariff policy and strong anchor load, which supports better DSCR and lower perceived risk. For multi-tenant park structuring, see Multi-Tenant Agro Food Processing Park Project Report.
Indicative Capital Investment for Common Utilities
All figures in this section are broad, illustrative estimates based on the 2024–25 cost environment in India. They are not vendor quotations. Final numbers must emerge from project-specific detailed engineering, site assessment and commercial negotiation.
Illustrative Example: 25-Acre Park
Assumptions: connected load ~5 MW, boiler capacity ~8 TPH, water requirement ~500 KLD, ETP capacity ~200 KLD, with boundary wall, site development and utility buildings.
| Utility Component | Capacity Assumption | Illustrative Capex Range (₹ crore) |
|---|---|---|
| Power infrastructure (substation, DG, solar 1 MW, internal distribution) | 5 MW connected load | ₹4.0 – ₹6.5 |
| Steam/boiler system (8 TPH biomass, fuel handling, piping) | 8 TPH | ₹1.5 – ₹3.0 |
| Water supply & treatment (intake, WTP, storage, distribution, firewater) | 500 KLD | ₹1.5 – ₹2.5 |
| ETP/STP (200 KLD ETP + 50 KLD STP, sludge handling) | 250 KLD combined | ₹1.0 – ₹2.5 |
| Utility buildings, pipelines, roads, control room | Lump sum | ₹1.0 – ₹2.0 |
| Total indicative utility capex | ₹9.0 – ₹16.5 |
Common utilities include power supply and clean water access as the baseline. The total project cost – including land, civil works, industrial plots development, common processing facilities, dry warehouse, cold storage blocks, common office space and parking bay – will be significantly higher. Utility capex typically represents 20–35% of total park project cost, depending on design standard and automation level.
Land development for utility corridors, substations and common pump houses should be integrated with overall park civil works – the cost line item includes site development, internal roads, stormwater drainage and boundary wall construction.
Project Report Bank, under CA Manish Gugliya, approaches cost estimation through benchmarking against comparable projects, collecting vendor budgetary quotes and running sensitivity analysis around 10–15% cost escalation scenarios to test financial resilience.
Annual Operating Costs and Utility Cost-Recovery Mechanisms
Major operating cost heads for park utilities include power purchase from DISCOM, fuel for boilers and DG sets, raw water charges, treatment chemicals and consumables, manpower (operators, technicians, supervisory staff), repairs and maintenance, statutory testing fees and insurance.
These costs split into fixed components (demand charges, minimum staffing, insurance) and variable components (kWh consumed, tonnes of steam delivered, kilolitres of water treated, cubic metres of effluent processed). The park includes food testing laboratory and analytical support utilities whose operating costs also form part of common facility overheads.
Recommended Tariff and Recovery Models
- Metered billing for electricity (₹/kWh with demand charge allocation)
- Per-tonne steam charges (linked to fuel cost index for pass-through)
- Per-kilolitre water charges (tiered, based on quality – raw, softened, RO)
- Per-m³ effluent treatment charges (with polluter-pays surcharges for high-load units)
- Fixed facility charges to recover depreciation and interest on utility assets
An illustrative annual utility P&L for a 25-acre park SPV might show ₹6–10 crore in utility revenue against ₹4–7 crore in operating costs, yielding a gross margin of 30–40% that contributes directly to the park’s EBITDA and debt servicing capacity. The actual numbers depend entirely on occupancy, utilisation and tariff levels.
From a CA’s perspective, revenue recognition from utilities, GST applicability on utility services and allocation of common costs between real estate rentals and utility operations require careful structuring – both for financial reporting and for presenting clean financials to banks and investors.
Utility Planning for 10-Acre, 25-Acre and 50-Acre Agro Processing Parks
This section provides a practical planning framework using three park sizes as illustrative examples. Networking for logistical support – including internal roads, weigh bridges and parking areas for trucks – scales with park size and must be planned alongside utility corridors.
10-Acre Park
Typically MSME-dominated with 8–15 food processing units. Common utilities include a basic substation (1–2 MW), shared ETP/STP (50–100 KLD), water treatment system and power backup. Steam may be limited to individual electric or small gas-fired units. Scope exists for modular expansion as occupancy grows.
25-Acre Park
More comprehensive common utilities: larger substation (3–5 MW), centralised boilers (5–10 TPH), bigger ETP (150–300 KLD), dedicated cold storage and dry warehouse blocks, pre cooling chambers, ripening chambers and a well equipped supply chain infrastructure including weigh bridges and parking bay areas. Phasing can be done in two stages (e.g. 60:40) to match occupancy build-up. Industrial plots can accommodate both small MSMEs and mid-sized anchor tenants.
50-Acre Park
An ambitious hub for integrated value chains – multiple anchor tenants, parallel utility loops for reliability, separate utility blocks for high-load (oil refining, large dairy) and low-load (packaging units, grain milling) clusters. Common facilities may include a central processing centre, primary processing centres, collection centres, common office space, specialized packaging lines, a food testing laboratory and value addition processing areas across horticultural zones and food production segments.
| Park Size | Typical Units | Power Scale | Water & ETP Scale | Indicative Utility Capex |
|---|---|---|---|---|
| 10 acres | 8–15 | 1–2 MW | 50–100 KLD ETP | ₹3–6 crore |
| 25 acres | 15–30 | 3–5 MW | 150–300 KLD ETP | ₹9–16 crore |
| 50 acres | 25–50+ | 5–10 MW | 300–800 KLD ETP | ₹18–35 crore |
For grain-based mega park infrastructure, see Integrated Grain Complex Infrastructure, Layout & EPC Cost. These are illustrative engineering assumptions – serious promoters should commission a customised DPR before committing to layout or EPC contracts.
EPC Contracting, Implementation Phases and Performance Guarantees
Utilities in agro processing parks are best executed through experienced EPC contractors with domain expertise in food processing infrastructure, water treatment and industrial power systems. EPC packages are typically structured as separate contracts for power distribution, boilers and steam piping, water treatment and distribution, and ETP/STP – or as one integrated utility EPC with specialist sub-contractors.
Implementation should be phased to align with park occupancy: Phase 1 utilities sized for initial 40–60% of design capacity, with civil provisions and layout for Phase 2 augmentation. Key commercial clauses to negotiate include performance guarantees (boiler efficiency, specific fuel consumption, ETP treated water quality), defect liability periods (12–24 months), liquidated damages for delay and interface management between packages.
Indicative lead times:
- Packaged boilers (5–10 TPH): 4–6 months supply and installation
- Large boilers (20–30 TPH): 8–12 months
- ETP/STP (100–500 KLD): 6–10 months
- Solar EPC (MW-scale rooftop): 3–4 months
- Overall utility commissioning for a mid-sized park: 12–18 months from financial closure
Pre-commissioning checks, trial runs and performance tests must be documented – lenders and investors typically review these before final disbursement. An independent DPR consultant and owner’s engineer protect promoter and lender interests by reviewing EPC design assumptions, capex claims and change orders.
Financial Projections, DSCR, IRR and Bank-Financing Considerations
Common utilities significantly influence the financial structure of an agro processing park SPV – on the capex side (term loan quantum) and on the revenue side (utility charges contributing to operating income alongside plot rentals). Key project-finance metrics include DSCR, IRR, payback period and break-even occupancy level.
For a 25-acre park with ₹12 crore utility capex (financed 70:30 debt-equity), if utility operations generate ₹7–8 crore annual revenue at 75% occupancy with 35% EBITDA margin, the utility component alone may contribute ₹2.5–2.8 crore EBITDA annually. Over a 10–12 year loan tenure, this must be stress-tested for delayed occupancy (1–2 years), higher energy costs (10–15%) and potential tariff compression.
Lenders expect realistic capacity build-up curves, conservative revenue projections, demonstrated demand from potential tenants (signed MoUs/LOIs where possible) and a clear tariff policy for utilities. CMA Data must present robust financial modelling with sensitivity analysis to satisfy both banks and investors. For anchor tenant strategies that support bankable projections, refer to Agro Processing Park Anchor Tenant Selection & Plot Allotment.
Project Report Bank specialises in bankable DPRs, CMA data preparation, loan structuring, means-of-finance planning and investor-ready documentation for agro processing and food processing parks – ensuring that financial projections are defensible rather than merely attractive.
Environmental Permissions, Regulatory Approvals and Compliance
The main statutory approvals linked to common utilities include:
- Consent to Establish (CTE) and Consent to Operate (CTO) from the State Pollution Control Board
- Groundwater extraction permissions (from CGWB/state authority)
- Electrical safety clearances and power supply agreements with DISCOM
- Indian Boiler Regulations (IBR) registration for boilers above specified pressure/capacity thresholds
- Fire NOC from the local fire department
- Factory licences and EIA clearance (where park size or industry category crosses thresholds)
Environmental management plans must address solid waste (sludge, organic residues, packaging waste), air emissions from boilers (PM, SOx, NOx compliance) and stormwater management. A centralised ETP/STP simplifies monitoring and compliance, but also concentrates responsibility on the park SPV – requiring proper sampling, record-keeping and reporting to regulators. State governments and regulatory frameworks differ across states and evolve over time; DPRs and feasibility studies must be based on current circulars and consultations with local authorities.
Parks should also design for future regulatory tightening, climate resilience (flooding in low-lying areas, water scarcity in arid zones) and ESG expectations from institutional investors and large F&B tenants.
Risks, Utility Bottlenecks and Mitigation Strategies
Major risk categories include technical risks (faulty design, under/over sizing), financial risks (cost overrun, lower-than-expected occupancy), operational risks (inefficient O&M, breakdowns affecting food production continuity) and regulatory risks (stricter discharge norms, tariff changes by DISCOMs).
Common bottlenecks:
- Delayed HT connection from DISCOM – sometimes taking 6–12 months beyond expected timelines
- Poor raw water quality requiring more expensive treatment
- Biomass fuel supply disruptions (seasonal moisture, price spikes)
- High sludge disposal costs from ETP
- Tenant disputes over utility tariff escalation
Mitigation strategies include robust pre-project studies, conservative design margins (10–15% above estimated peak demand), modular and expandable utility systems, securing long-term fuel and water supply arrangements, selecting experienced O&M partners, and structuring utility service agreements with tenants that include minimum offtake commitments and clear tariff escalation formulas. A contingency provision of 5–10% in project cost, insurance coverage for key utilities and continuous performance monitoring further reduce wastage of capital and operational disruptions. These measures increase farmers income indirectly by ensuring that value addition infrastructure built to reduce post harvest losses and process agricultural produce operates reliably.
DPR, Feasibility Study and Financial Modelling Requirements
For any agro processing park with significant common utilities, a generic template is inadequate. A customised detailed project report and financial model are essential for investment decisions and bank finance. This is especially true for parks designed under the mega food park scheme or PMKSY agro processing clusters where financial assistance depends on demonstrating viable, well-planned projects.
Core DPR components from a utility perspective:
- Industry mix study and anchor tenant identification
- Detailed utility demand estimation across power, steam, water and effluent
- Block-wise infrastructure layout with utility corridors
- Technical specifications for all utility systems
- Phased capacity plan aligned with occupancy build-up
- Itemised capex and O&M estimates with clearly stated assumptions
- 10–15 year financial projections incorporating seasonal variability, tariff escalation assumptions and working capital requirements for utility operations
- Sensitivity analysis testing occupancy delays, higher energy costs and stricter ETP norms
Project Report Bank, led by CA Manish Gugliya, provides customised DPR preparation, CMA data for bank loans, detailed financial projections, investor-ready DPRs and advisory on means of finance for agro processing parks and agro processing clusters. Serious promoters planning projects of ₹5 crore and above are invited to engage for customised advisory rather than relying on off-the-shelf reports.
Conclusion – Building Bankable Agro Processing Park Common Utilities
Well-designed agro processing park common utilities underpin the technical viability, financial bankability and environmental compliance of food parks and agro processing clusters across India. Integrated planning across power, steam, water supply, cold storage support systems and effluent treatment is crucial to the competitiveness of India’s food processing sector – and to building a well equipped supply chain that can reduce wastage, increase farmers income and support value addition at scale.
Every park is unique. The industry mix, location, water availability, power context, regulatory framework and tenant pipeline differ from project to project. Professional DPRs, feasibility studies and financial modelling are essential before committing major capital – whether the investment is ₹5 crore for a small cluster or ₹50 crore for a large-scale food park with comprehensive common utilities.
Investors, developers, state agencies and entrepreneurs planning agro processing and food processing projects are welcome to contact Project Report Bank for customised DPR and project finance advisory services.
CA Manish Gugliya FCA, DISA (ICAI) More than 20 years of professional experience in project reports, financial projections, CMA data, project finance and business advisory.
Frequently Asked Questions (FAQs)
The following FAQs address practical queries that promoters frequently raise about common utilities in agro processing parks, beyond what is covered in the main sections above.
What is the minimum viable size for setting up common utilities in an agro processing park?
Even an 8–10 acre park can justify shared water treatment, ETP/STP and a basic electrical substation if multiple MSME food processing units are planned. However, centralised boilers and larger power distribution systems usually become more economical from around 20–25 acres upwards, depending on anchor load and industry mix. The key determinant is not just land area but the aggregate utility demand from confirmed or committed tenants. A park with three medium-sized processing units consuming 5 TPH steam collectively can justify a central boiler, whereas a park with 15 small dry-process units may not need one at all. Exact thresholds should be established through a project-specific feasibility study.
Should cold storage and refrigeration systems be centralised or left to individual units?
Common cold storage blocks and pre cooling chambers are often centralised for small tenants who cannot individually justify dedicated facilities. However, large integrated processors exporting frozen or chilled products typically require dedicated cold rooms and blast freezers within their own premises, with specific temperature zones and compliance protocols. The practical outcome in most parks is a mixed model – shared multi-chamber cold storage for MSMEs and small traders, with large tenants operating their own refrigeration systems. The detailed project report should model both scenarios and their respective capex and operating cost implications.
How long does it typically take to commission park-level utilities?
For a mid-sized park (20–30 acres), the typical timeline from financial closure to utility commissioning is 12–18 months, assuming timely land availability, statutory approvals and EPC execution. The critical-path items are usually the HT power connection (which depends on DISCOM infrastructure) and major water pipeline extensions. Boiler installation typically takes 4–8 months, ETP construction 6–12 months, and solar EPC 3–4 months. However, delays in land possession, environmental clearances or EPC mobilisation can extend timelines by 6–12 months beyond initial estimates.
How do banks treat revenue from utility charges in project appraisal?
Lenders consider utility revenue as part of the park SPV’s operating income, but they assess its robustness through signed utility service agreements, realistic utilisation assumptions and sensitivity analysis. Banks typically give more weight to contracted or recurring income from anchor tenants than to projected revenue from uncommitted future occupants. Utility charges must be demonstrated as cost-reflective and market-competitive – excessively high tariffs may deter tenants while very low tariffs may compromise debt servicing. The CMA data and financial model should present utility revenue as a separately identifiable stream with clear volume and pricing assumptions.
Can promoters depend on grants in aid before finalising utility design and financing?
While grants in aid under schemes like PMKSY and the mega food park scheme can significantly improve project viability, promoters should design utilities based on technical requirements and treat grants as upside rather than the foundation of the financial plan. Financing structures should remain workable even if grants are delayed, partly sanctioned or disbursed in tranches spread over 2–3 years. This conservatism should be explicitly reflected in the DPR and CMA data – and it is precisely the approach that strengthens the promoter’s credibility with both lenders and government agencies reviewing the project.