Key Takeaways
- Palm oil refinery financial projections must integrate processing capacity, refining margins, working capital requirements and DSCR into a single coherent model; standalone revenue estimates without cash flow and repayment analysis are insufficient for bank appraisal.
- Working capital for a palm oil refinery often constitutes 25–40% of total capital investment because imported crude palm oil inventory carries high per-MT values, and the operating cycle involves ocean freight, customs clearance and institutional credit periods.
- Structured CMA data, including projected balance sheet and maximum permissible bank finance calculations, becomes mandatory when bank asks for term loan plus cash credit limits above approximately ₹10 lakh for industrial borrowers.
- Refining margins per MT are thin (often ₹1,500–₹3,000 net spread), so even small changes in CPO landed cost, product realisations or capacity utilisation can shift annual EBITDA by ₹5–₹15 crore on a 300 TPD plant.
- Project Report Bank, led by CA Manish Gugliya (FCA, DISA – ICAI), prepares customised, bank-ready DPRs, CMA Data and financial models for palm oil refinery projects across India.
Introduction: Why Financial Projections Matter for Palm Oil Refinery Projects
Palm oil dominates India’s edible oil basket. The country imports roughly 75 lakh tonnes of palm oil annually, and the global palm oil market was valued at USD 59.15 billion in 2025, with projections reaching USD 80.05 billion by 2034. A 300 TPD refinery processing imported crude palm oil handles raw material worth ₹5–₹7 crore every single week. At these volumes, financial projections are not optional documentation; they are the foundation of every investment and financing decision.
Planning a palm oil refinery requires robust financial modelling that addresses profitability, cash flow and repayment capacity together. A projected turnover figure alone tells very little. What matters is whether the refinery generates enough cash, after paying for CPO imports, processing costs, interest and principal repayments, to remain solvent across commodity cycles.
Key risk drivers that every palm oil refinery financial projection must address:
- CPO price volatility: production cost in a palm oil refinery is heavily influenced by crude palm oil prices, which can swing 15–25% in a single quarter
- Import duty changes: India’s BCD on crude edible oils was reduced from 10% to 5% in September 2026; such shifts alter landed cost overnight
- Foreign exchange exposure: CPO is priced in US dollars; exchange rate fluctuations can affect the competitiveness of palm oil refiners
- Refining losses: feedstock quality (FFA, moisture, gums) determines actual yields
- Product-wise realisation: olein, stearin and PFAD each carry different prices
Palm oil refining is a margin business. Refining margins are calculated as the spread between refined products and the cost of crude palm oil. The palm oil industry operates on tight processing margins where volumes compensate for thin per-MT spreads. This article focuses specifically on palm oil refinery projects; promoters seeking a broader framework can refer to the edible oil refinery financial projections guide.
Understanding the Financial Structure of a Palm Oil Refinery
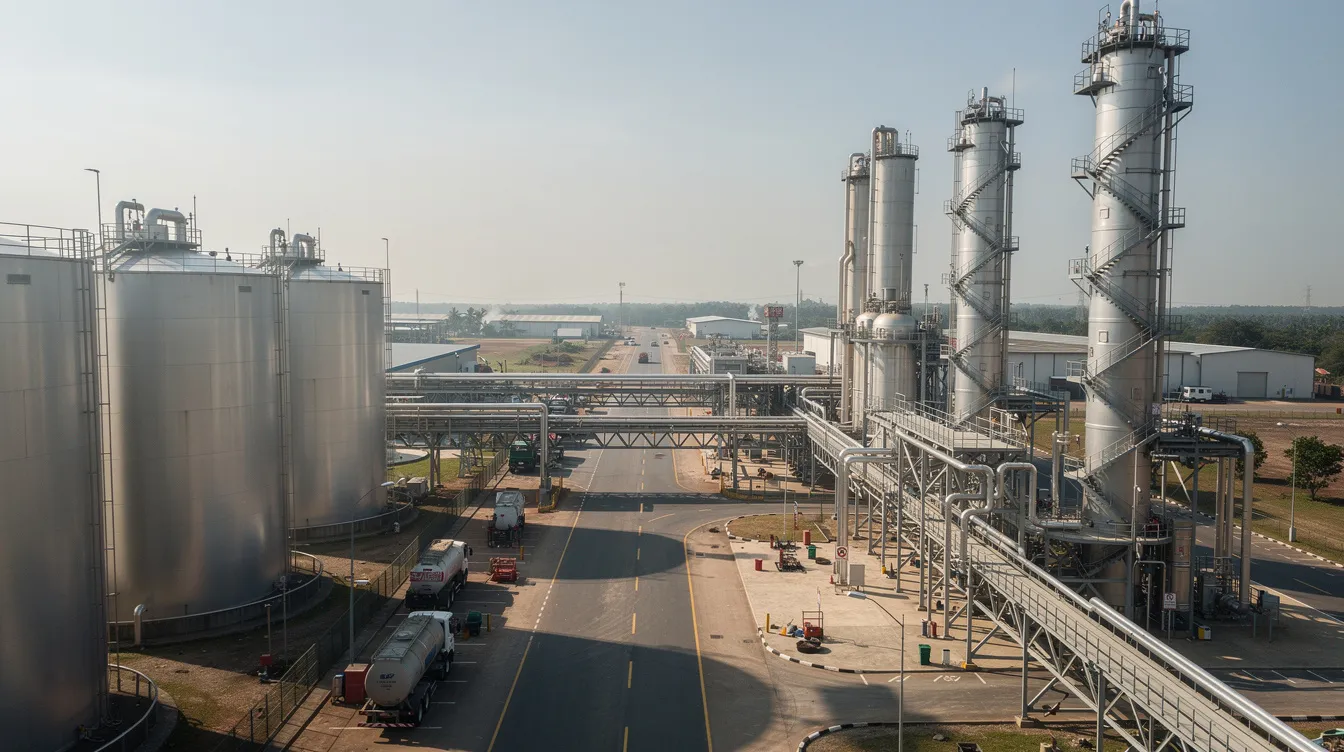
A palm oil refinery plant is a capital-intensive processing unit, distinct from palm plantations (which grow fresh fruit bunches in countries like Malaysia and Indonesia) and from oil trading operations. The financial structure depends on which value chain segment the promoter operates.
Four common business configurations and their financial implications:
- Standalone CPO to RBD palm oil refining: Lower capex, simpler product mix (bulk refined palm oil), limited value addition. Revenue depends on a single refined oil product. Working capital is dominated by CPO inventory.
- Refining plus fractionation (olein and stearin): Additional capex for crystallisation and filtration equipment, but the product mix splits into palm olein (higher value, larger volume) and palm stearin (lower value, used in soap, animal feed and specialty fats). An integrated fractionation line, as discussed in the palm olein fractionation plant project report, can improve gross margins by ₹500–₹1,500/MT over bulk RBD sales.
- Refining with bulk tanker/IBC sales: Minimal packaging investment, but realisations are lower and buyers are typically wholesale distributors or institutional users who expect 20–30 day credit terms.
- Refining plus consumer packaging: Adds packing material cost, branding, marketing and distribution expenses, but realisations per MT improve. Working capital expands to include finished packed goods and longer receivable cycles.
The material balance from crude palm oil to finished products typically follows this pattern: refined oil yield of approximately 94% from 100% CPO feed, by-product PFAD at roughly 5%, and refining losses around 1%. When fractionation is added, the refined product splits into approximately 80% olein and 20% stearin. Actual yields depend on the crude palm oil refining process design and feedstock quality.
Key Assumptions for Palm Oil Refinery Financial Projections
A detailed assumption sheet is the backbone of any palm oil refinery financial model that Indian promoters prepare for banks or investors. Every revenue, cost and cash flow number in the model should trace back to a stated assumption.
The following table illustrates the core assumptions for a 300 TPD refinery base case. All figures are illustrative and must be validated against current quotations and government notifications at the time of DPR preparation.
| Parameter | Unit | Illustrative Assumption | Comments |
|---|---|---|---|
| Installed capacity | TPD | 300 | Refining + fractionation |
| Working days per year | Days | 330 | Allows for maintenance shutdowns |
| Capacity utilisation, Year 1 | % | 60% | Ramp-up phase |
| Capacity utilisation, Year 2 | % | 75% | Market development |
| Capacity utilisation, Year 3 onward | % | 85–90% | Steady state |
| CPO to refined oil yield | % | 94% | Includes olein + stearin |
| PFAD yield | % | 5% | By-product credit |
| Refining losses | % | 1% | Gums, soapstock, handling |
| Olein : Stearin split | Ratio | 80 : 20 | Post-fractionation |
| CPO landed cost | ₹/MT | 78,000 | Illustrative; includes duty, freight |
| RBD palm oil selling price | ₹/MT | 85,000 | Bulk ex-factory |
| Palm olein selling price | ₹/MT | 83,000 | Bulk ex-factory |
| Palm stearin selling price | ₹/MT | 65,000 | Industrial grade |
| PFAD selling price | ₹/MT | 48,000 | By-product |
| Term loan interest | % p.a. | 11.5% | Floating; indicative |
| Term loan tenor | Years | 8 (incl. 1 yr moratorium) | Quarterly repayment |
| Depreciation | Method | SLM, 15-year useful life | As per Companies Act |
| Corporate tax rate | % | 25.17% | New regime assumption |
| Inventory holding (CPO) | Days | 30 | Import lead time + buffer |
| Debtor collection period | Days | 25 | Institutional buyers |
| Creditor payment period | Days | 20 | Supplier terms |
Palm oil processing plants have a capacity of 100,000–300,000 MT annually at the larger scale. For this 300 TPD model, annual capacity at 100% utilisation would be 99,000 MT, with actual throughput determined by the ramp-up schedule. Capacity utilisation rates greater than 80% are critical to profitability in palm oil refining because fixed costs (depreciation, interest, administrative overheads) must be absorbed across a sufficient production base.
Financial assumptions such as interest rates, tax rates and escalation percentages must be validated with current RBI benchmarks, Income Tax provisions and market intelligence at the time of DPR preparation.
Project Cost and Means of Finance
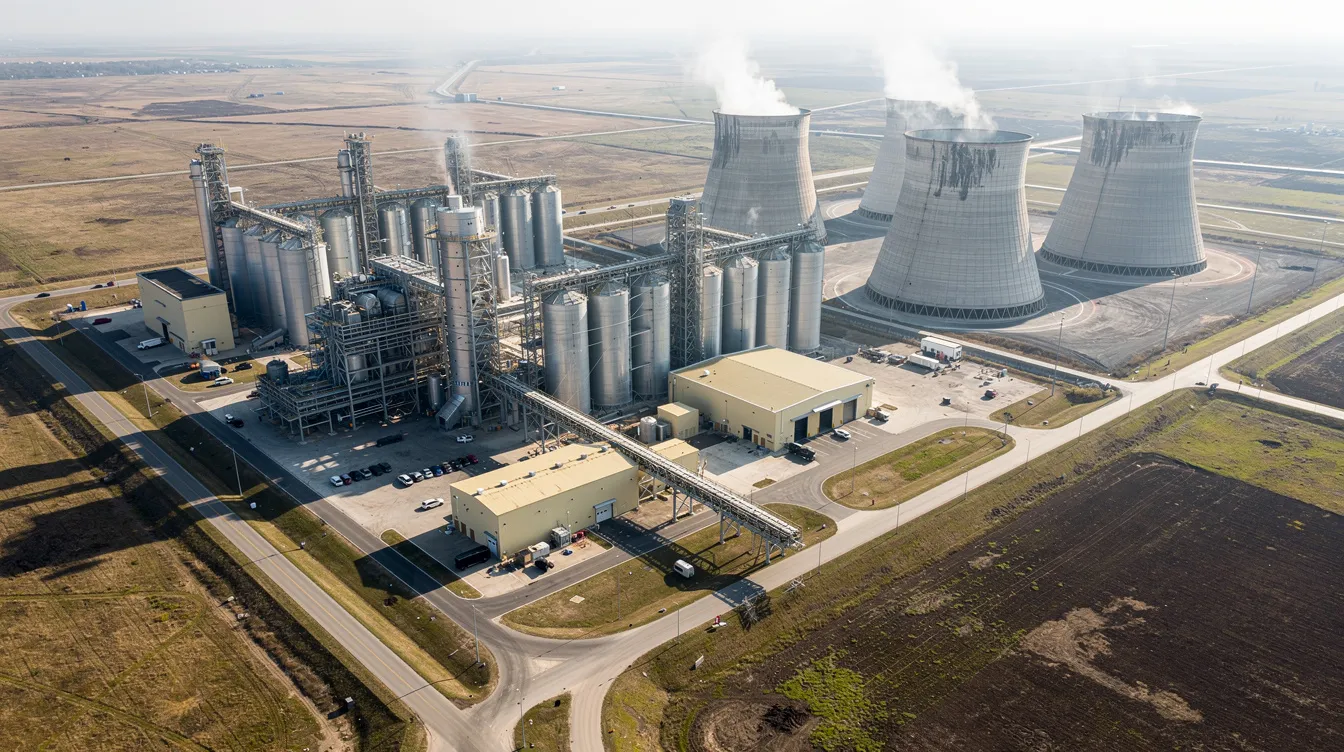
Palm oil refineries involve substantial fixed capital investment in land, tank farms, process equipment, boilers, chillers and effluent treatment, all separate from recurring working capital. Palm oil processing plant setup costs range based on capacity; a 300 TPD integrated refinery-plus-fractionation plant typically falls in the ₹80–₹180 crore range depending on technology, automation level and location.
Major heads of project cost:
- Land and site development (3–6% of project cost)
- Civil and structural works including tank foundations (12–16%)
- Plant and machinery: degumming, bleaching, deodorisation, fractionation equipment, heat exchanger systems (40–50%)
- Storage tanks for CPO, refined oil, olein and stearin
- Utilities: boilers, cooling towers, power distribution, water treatment (10–14%)
- Effluent treatment plant and environmental compliance infrastructure
- Laboratory and quality assurance equipment
- Preliminary and pre-operative expenses including licences, consultancy and trial runs
- Interest during construction period
- Contingency (typically 3–5%)
- Margin money for working capital
Capital investments for palm oil processing plants can vary widely based on technology. Environmental compliance costs can add to operating expenditures over time.
Illustrative Project Cost and Means of Finance: 300 TPD Refinery
| Component | ₹ Crore (Approx.) |
|---|---|
| Land and site development | 4.50 |
| Civil and structural works | 15.00 |
| Plant and machinery (refining + fractionation) | 52.00 |
| Storage tanks and material handling | 8.00 |
| Utilities (boilers, electrical, cooling) | 12.00 |
| ETP and environmental infrastructure | 3.50 |
| Lab and QA equipment | 1.00 |
| Preliminary and pre-operative expenses | 3.00 |
| Interest during construction | 4.00 |
| Contingency | 4.00 |
| Margin money for working capital | 8.00 |
| Total project cost | 115.00 |
| Means of Finance | ₹ Crore | % |
|---|---|---|
| Promoter equity | 40.00 | 35% |
| Term loan | 75.00 | 65% |
| Total | 115.00 | 100% |
The debt equity ratio in this illustration is approximately 1.88:1. Banks commonly evaluate ratios in the 1.5:1 to 2:1 range for industrial projects, though the actual acceptable ratio depends on cash generation and project risk. Promoters can cross-check preliminary capex estimates using the palm oil refinery setup cost and edible oil refinery project cost and investment guides.
Margin money for working capital is a capital investment item even though it relates to current assets. It also affects maximum permissible bank finance calculations later.
Palm Oil Refinery Revenue Projections
Revenue projections start from technical throughput and material balance, then translate into saleable products and prices. Financial projections must include detailed income and expenditure forecasts tied to physical production.
The core formula:
Annual processing quantity (MT) = Refinery capacity (TPD) × Working days × Capacity utilisation %
For a 300 TPD refinery at 330 days and 75% utilisation (Year 2):
- Annual CPO processed: 300 × 330 × 0.75 = 74,250 MT
- Refined oil output (94%): 69,795 MT, split into olein (80%) = 55,836 MT and stearin (20%) = 13,959 MT
- PFAD (5%): 3,713 MT
- Losses (1%): 743 MT
Product-wise Revenue Projection (Year 2, Illustrative)
| Product | Quantity (MT) | Price (₹/MT) | Revenue (₹ Crore) |
|---|---|---|---|
| Palm olein | 55,836 | 83,000 | 463.44 |
| Palm stearin | 13,959 | 65,000 | 90.73 |
| PFAD | 3,713 | 48,000 | 17.82 |
| Total | 73,508 | 571.99 |
Different customer segments affect realisations. Bulk industrial buyers (soap manufacturers, vanaspati plants, wholesale distributors) accept lower prices but offer volume consistency. Branded packed oil sales improve realisations but require marketing investment and longer credit periods. Revenue projections must be consistent with GST treatment and actual contract terms. The palm oil market for refined products in India is price-sensitive, and refinery profitability is sensitive to fluctuations in the selling prices of finished palm oil products.
Operating Cost and Refining Margin Analysis
In palm oil refining, raw materials account for 70–80% of total operating expenses. Crude palm oil typically constitutes 70–85% of total recurring expenses. This means the margin analysis must focus on spread per MT rather than percentage margins.
Operating cost components per MT:
- CPO landed cost (CIF plus customs duty at 5% BCD, Social Welfare Surcharge, port charges, CBIC tariff value assessments and inland freight)
- Process chemicals and bleaching earth
- Utilities: steam, electricity and cooling (energy and steam consumption are among the most material operational costs)
- Labour, repairs and maintenance
- Quality control and lab testing
- Packing and inland freight
- Administrative overheads and insurance
The edible oil refinery process flow and choice between physical vs chemical refining of edible oils affect both yield and operating cost structure. Utility sizing details are covered in the edible oil refinery utility requirements guide.
Per-MT Refining Economics (Illustrative)
| Item | ₹/MT of CPO processed |
|---|---|
| Blended product realisation (weighted average) | 79,500 |
| Less: CPO landed cost | (78,000) |
| Gross refining spread | 1,500 |
| Add: PFAD by-product credit (pro-rated) | 2,400 |
| Less: Processing cost (chemicals, utilities, labour, maintenance) | (1,800) |
| Net processing contribution | 2,100 |
| Less: Admin, selling, overheads | (500) |
| Indicative EBITDA per MT | 1,600 |
Gross profit margins for palm oil processing typically range from 20–30% when measured on value addition (not on total turnover). On a turnover basis, net profit margins may be as thin as 1–3% during ramp-up. A CRISIL-rated 300 TPD refinery in Andhra Pradesh (Coastal Refineries Private Limited) reported PAT margin of approximately 1.58% on operating income of ₹40.50 crore. Changes in spread of ₹300–₹500/MT can shift annual EBITDA on a 300 TPD plant by ₹5–₹15 crore. Effective cost management includes understanding variable and fixed operating expenses in palm oil refining. All ₹/MT figures shown above are illustrative and should not be treated as current market rates.
First-year operational costs include raw materials, utilities, and maintenance. Changes in export taxes or import duties can also affect the profitability and cash flow of palm oil refiners.
Palm Oil Refinery Working Capital Requirements
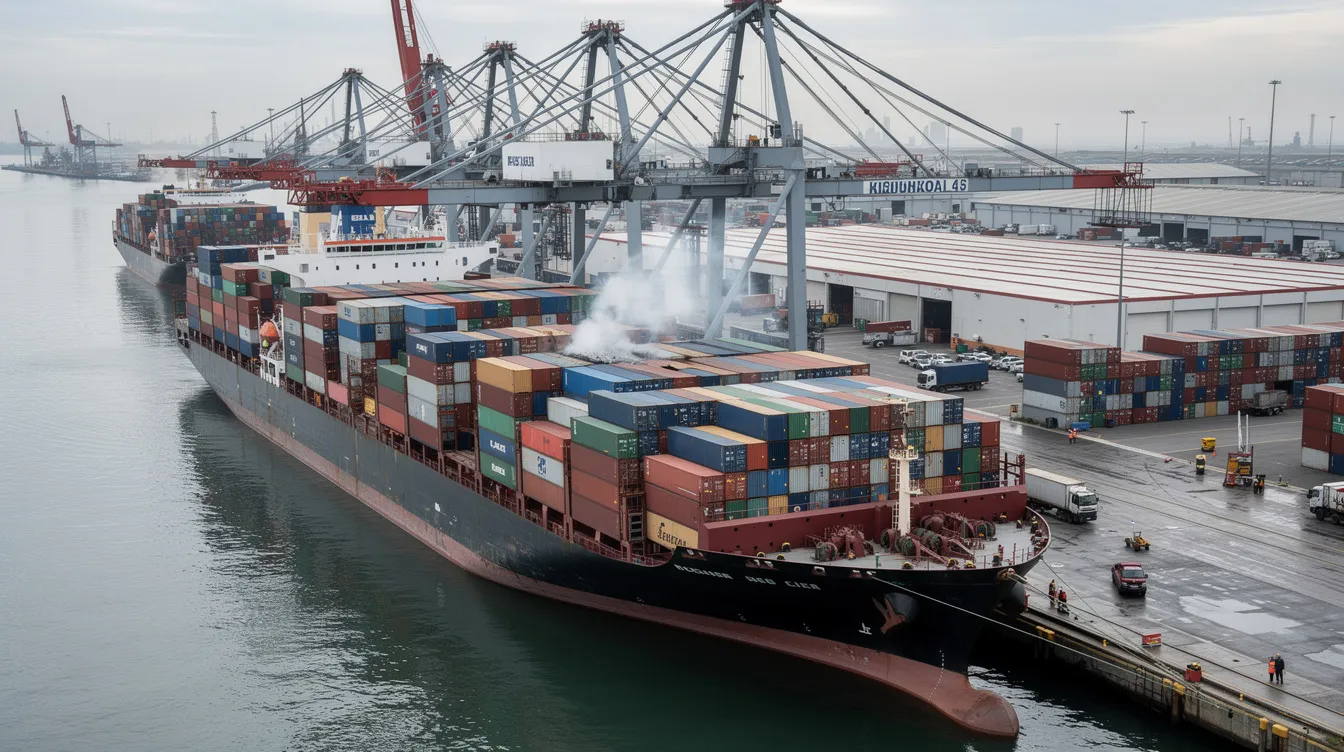
Working capital is often the most underestimated part of a palm oil refinery project. Working capital is vital as it supports the purchase of raw materials and inventory in palm oil refining. For an import-dependent CPO refinery, the combination of ocean freight (15–25 days), customs clearance (3–7 days), inland transport and buffer stock creates a raw material inventory holding of 30–45 days. At CPO prices of ₹78,000/MT and daily processing of 225 MT (75% of 300 TPD), even 30 days of CPO stock locks up approximately ₹52 crore.
Raw material inventory: 30 days of CPO stock is a common assumption. Voyage time from Malaysia or Indonesia, port clearance delays, and price volatility may require additional buffer. Palm oil production follows a seasonal biological cycle, necessitating adjustments for working capital during peak and lean months.
Work-in-progress: The processing cycle for refining and fractionation is typically 1–2 days. WIP value is small relative to raw material stock but must be included.
Finished goods stock: RBD palm oil, olein and stearin are typically stocked for 10–15 days. Actual holding depends on buyer order patterns and logistics. Palm oil traders typically hold 15–20 days of stock; refiners with integrated sales may hold slightly longer.
Trade receivables: Institutional buyers and wholesale distributors typically receive 20–30 day credit. Debtors typically take 30–45 days to pay in some segments of palm oil trading. Longer credit terms increase the working capital cycle.
Trade creditors: Supplier credit on chemicals, fuel and services may provide 15–20 days. LC-based CPO imports may have deferred payment terms.
Other current assets: Advances, GST receivables, deposits.
Import duties and tariffs impact the working capital requirements for palm oil refiners because duty payments at port add to the cash outflow before any product is sold.
The standard working capital formula:
- Net working capital = Current assets minus current liabilities eligible for set-off
- Working capital gap = Current assets minus current liabilities (excluding bank borrowing)
- Bank finance = Working capital gap minus promoter margin
Working capital is calculated as inventory plus debtors minus creditors at its simplest. Maximum permissible bank finance (MPBF) is one appraisal framework; some banks use turnover-based assessment. MPBF norms may vary by bank and policy. Banks fund 75% of the MPBF under standard assessment methods.
Palm oil refiners often use LCs for CPO imports. When an LC devolves (seller draws payment but buyer has not funded the account), it converts into a funded liability counted within working capital limits.
Working Capital Calculation for a 300 TPD Palm Oil Refinery
This section provides a concrete numerical example using round, clearly-assumed numbers in ₹ crore. The annual turnover assumed here (approximately ₹572 crore) corresponds to the Year 2 revenue projection derived earlier.
| Working Capital Component | Days | ₹ Crore |
|---|---|---|
| Current Assets | ||
| Raw material inventory (CPO) | 30 | 47.50 |
| Work-in-progress | 2 | 3.20 |
| Finished goods (olein, stearin, PFAD) | 12 | 18.80 |
| Trade receivables | 25 | 39.20 |
| Cash and bank balance | – | 2.00 |
| Other current assets (advances, deposits) | – | 3.00 |
| Total current assets (A) | 113.70 | |
| Current Liabilities | ||
| Trade creditors | 20 | 31.30 |
| Other current liabilities (statutory dues, expenses payable) | – | 5.00 |
| Total current liabilities (B) | 36.30 | |
| Net working capital (A – B) | 77.40 | |
| Working capital gap | 77.40 | |
| Promoter margin (25% of current assets) | 28.43 | |
| Assessed bank borrowing (indicative) | 48.97 |
Working capital requirement ranges can be large even for traders; a trader handling 40–100 MT/month needs ₹20–80 lakh in working capital. A 300 TPD refinery operates at a different scale entirely, with working capital requirements in the ₹50–₹80 crore range.
If CPO inventory is increased from 30 to 45 days, raw material stock rises by approximately ₹24 crore, directly increasing the working capital gap and interest cost on cash credit. Extending debtor days from 25 to 40 adds approximately ₹23 crore to receivables. These changes demonstrate why the palm oil refinery cash credit limit assessment must align with the projected monthly operating statement in CMA data, not be an isolated calculation.
CMA data helps determine working capital requirements with precision rather than estimation.
CMA Data Preparation for Palm Oil Refinery Bank Finance
CMA data is mandatory for loans above ₹10 lakh in India. For palm oil refinery projects seeking term loans of ₹50–₹100 crore alongside cash credit limits of ₹30–₹50 crore, CMA data preparation is one of the most scrutinised components of the bank loan proposal. CMA reports assess liquidity, profitability, and solvency across the projection period.
The key CMA forms applicable to palm oil refinery bank finance:
- Form I: Existing and proposed credit facilities (term loans, cash credit, LC, bank guarantee)
- Form II: Projected operating statement (year-wise revenue, cost, EBITDA, PAT)
- Form III: Projected balance sheet (assets, liabilities, net worth progression)
- Form IV: Current assets and current liabilities schedule (inventory, receivables, payables)
- Form V: MPBF calculation (assessed bank finance based on eligible current assets)
- Form VI: Fund flow statement (sources and applications of funds, working capital changes)
CMA formats may be adapted marginally by some banks, but the core structure remains consistent.
For palm oil refineries, banks scrutinise inventory levels (because CPO is high-value and price-volatile), refining margins (because spreads are thin), DSCR (because term loan repayments are substantial) and foreign-currency exposure (because CPO imports are US dollar-denominated). CMA data includes fund flow and MPBF calculations that must reconcile with the projected financial statements.
The projected balance sheet in CMA data must match project-cost and means-of-finance assumptions. If the DPR shows term loan drawdown of ₹75 crore, the Year 1 balance sheet must reflect that liability. If equity of ₹40 crore is committed, share capital must appear accordingly.
The projected operating statement in CMA data should align with the refinery’s 10-year financial projections and capacity utilisation ramp-up. Arbitrary sales figures that do not correspond to installed capacity and utilisation create inconsistencies that credit officers identify during appraisal. CMA reports require up-to-date financial statements for existing operations.
Palm oil promoters can refer to the edible oil refinery financial projections guide for a generic refinery CMA framework while using this article for palm-specific nuances.
Palm Oil Refinery Term Loan and Bank Finance Structure
Indian banks typically structure term loans for medium to large industrial refineries with tenors of 7–10 years including a moratorium period of 6–12 months during construction and commissioning. Actual terms depend on bank credit policy, project risk assessment and the borrower’s credit profile.
Standard components of a palm oil refinery bank finance package:
- Term loan for project cost (excluding working capital margin, which is funded from equity): 65–70% of project cost is common, with promoter contribution at 30–35%
- Working capital limits: Cash credit for day-to-day funding of inventory and receivables; LC facilities for CPO imports; buyer’s credit where applicable
- Non-fund-based facilities: Bank guarantees for customs, utilities or performance bonds
Promoter contribution in project finance is typically 25–33% of project cost. Banks evaluate the overall debt equity ratio, security (primary charge on plant and machinery, mortgage of land and buildings, hypothecation of current assets) and personal guarantees of promoters. No specific collateral-free structure should be assumed as universally available.
LC for CPO imports is usually backed by LC margin (5–15% of LC value) plus bank credit lines. Devolved LC amounts flow into cash credit or separate demand loan accounts, increasing funded exposure. Long term loans for project cost and working capital loans for operating needs serve different purposes and carry different repayment structures.
The ultimate loan structure is driven by assessed project viability, DSCR and risk perception. Professional DPR and CMA data improve clarity and demonstrate promoter preparedness, but they cannot substitute for genuine financial strength and project feasibility. A business loan for a palm oil refinery is evaluated on the basis of the company’s ability to pay its obligations from operating cash flows.
Ten-Year Palm Oil Refinery Financial Projections
An integrated 10-year palm oil refinery financial model combines the projected profit and loss account, balance sheet and cash flow statement into a single reconciling framework. Financial projections assess ROI and profitability based on realistic assumptions across the entire loan tenor and beyond.
Projected Profit and Loss: Year-wise sales growth from capacity ramp-up (60% → 75% → 85% → 90%), cost of CPO and other inputs escalating at assumed inflation rates, manufacturing overheads, EBITDA, depreciation, interest on term loan and cash credit, profit before tax, tax provision and profit after tax.
Projected Balance Sheet: Fixed assets net of accumulated depreciation, current assets (inventory, receivables, cash and bank balances), current liabilities (trade creditors, working capital borrowing), outstanding term loan balance declining each year, share capital and accumulated reserves.
Projected Cash Flow Statement: Operating cash flow including working capital changes, investing cash flow (initial capex and any replacement investments), financing cash flow (term loan drawdown, repayments, equity infusion).
Financial projections for palm oil refiners should include detailed monthly estimates for the first 2–3 years, shifting to annual projections thereafter.
Ten-Year Summary (Illustrative, 300 TPD Refinery)
| Year | Turnover (₹ Cr) | EBITDA (₹ Cr) | PAT (₹ Cr) | Net Worth (₹ Cr) | Term Loan Balance (₹ Cr) |
|---|---|---|---|---|---|
| 1 | 381 | 7.9 | 0.8 | 40.8 | 75.0 |
| 2 | 572 | 11.9 | 2.5 | 43.3 | 64.3 |
| 3 | 648 | 13.5 | 4.1 | 47.4 | 53.6 |
| 4 | 686 | 14.3 | 5.0 | 52.4 | 42.9 |
| 5 | 720 | 15.0 | 5.8 | 58.2 | 32.1 |
| 6 | 740 | 15.4 | 6.3 | 64.5 | 21.4 |
| 7 | 760 | 15.8 | 6.9 | 71.4 | 10.7 |
| 8 | 780 | 16.2 | 7.5 | 78.9 | 0.0 |
| 9 | 800 | 16.6 | 8.5 | 87.4 | 0.0 |
| 10 | 820 | 17.0 | 9.2 | 96.6 | 0.0 |
These figures are illustrative. Opening and closing balances must reconcile across all three statements. This integrated model forms the base for DSCR analysis, IRR calculations and sensitivity scenarios. Project Report Bank builds such models customised to each refinery configuration.
Palm Oil Refinery DSCR Calculation and Loan Repayment Capacity
Debt Service Coverage Ratio measures the ratio of cash accruals available for servicing debt to total debt service (interest plus scheduled principal repayment) over a period, typically one year. DSCR is crucial for palm oil loan applications because it tells the lender whether the project can pay its way.
The preferred DSCR formula for project appraisal:
DSCR = (Net profit after tax + Depreciation + Interest on term loan) ÷ (Interest on term loan + Principal repayment)
Some lenders use slightly adjusted definitions (e.g., adding back deferred tax or excluding non-cash income). The palm oil refinery DSCR calculation should be done year-wise for the entire loan tenor and an average DSCR computed for appraisal purposes.
Illustrative DSCR Calculation (Years 1–5)
| Year | PAT (₹ Cr) | Depreciation (₹ Cr) | Interest on TL (₹ Cr) | Cash Accrual (₹ Cr) | Principal Repayment (₹ Cr) | Total Debt Service (₹ Cr) | DSCR |
|---|---|---|---|---|---|---|---|
| 1 | 0.8 | 6.9 | 8.6 | 16.3 | 0.0 | 8.6 | 1.90 |
| 2 | 2.5 | 6.9 | 7.4 | 16.8 | 10.7 | 18.1 | 0.93 |
| 3 | 4.1 | 6.9 | 6.2 | 17.2 | 10.7 | 16.9 | 1.02 |
| 4 | 5.0 | 6.9 | 4.9 | 16.8 | 10.7 | 15.6 | 1.08 |
| 5 | 5.8 | 6.9 | 3.7 | 16.4 | 10.7 | 14.4 | 1.14 |
| Average | 1.21 |
In this illustration, the average DSCR of 1.21 is below the 1.25–1.50 range that many banks target. This signals that either the margin assumptions need improvement, the repayment schedule needs lengthening, or equity contribution needs to increase. A DSCR below 1.0 in any year indicates that the project cannot service its debt from operating cash flow in that period, which is a red flag for lenders.
Banks generally look for a comfortable average DSCR rather than one rigid mandatory number. Highly volatile DSCR across years also concerns lenders because it suggests exposure to cyclical risk. DSCR is a factor in maximum permissible bank finance decisions, especially for term loan quantum and repayment schedule finalisation.
Note: The illustrative DSCR above deliberately shows a tight scenario. In my experience evaluating industrial project finance proposals, a promoter who presents a model with weak DSCR alongside a clear plan for improvement (higher utilisation, better margins, longer repayment) demonstrates more credibility than one who inflates assumptions to force DSCR above 1.50.
Project Profitability, IRR, ROI and Payback Period
Lenders focus on DSCR and security. Promoters and investors also evaluate overall return on investment and internal rate of return. Both perspectives matter, especially in large palm oil refinery projects where capital investment can exceed ₹100 crore.
Key profitability metrics:
- Gross margin %: (Revenue minus CPO cost) ÷ Revenue. Gross profit margins for palm oil processing typically range from 20–30% when measured on value-added basis.
- EBITDA margin %: EBITDA ÷ Revenue. For palm oil refineries, this often falls in the 2–4% range on total turnover.
- Net profit margin %: PAT ÷ Revenue. May be under 1% in early years, improving to 1–2% at steady state on large turnover.
- ROCE and ROE: Return on capital employed and return on equity measure how efficiently deployed capital generates returns.
Project IRR vs Equity IRR: Project IRR is based on total project cash flows (before debt service), measuring the return on total capital investment. Equity IRR is based only on equity cash flows (after debt service), measuring the return to the promoter. In leveraged projects, equity IRR exceeds project IRR when the project earns above the cost of debt. Net present value and internal rate of return are key profitability metrics for financial projections.
A break-even analysis is crucial to determine the minimum production volume required to cover costs. For a 300 TPD refinery with the cost structure illustrated above, break-even capacity utilisation typically falls in the 55–65% range. Financial projections include ROI and NPV assessments for palm oil projects.
A detailed discussion on generic refinery feasibility, IRR and break-even can be found in the edible oil refinery feasibility study article; palm oil-specific margins and working capital should be recalibrated for each project. Strong IRR alone does not guarantee finance if DSCR or promoter contribution is weak, and vice versa.
Financial Sensitivity and Risk Analysis
Palm oil refining is exposed to multiple simultaneous risks: commodity price swings in the palm oil market, import duty changes (the government reduced BCD on crude edible oils to 5% in September 2026), forex movements, utilisation risk, and policy changes on vegetable oil imports.
Every palm oil refinery DPR should construct at least three scenarios:
- Base case: Assumptions as stated in the model
- Optimistic case: Better refining margins (+₹500/MT), faster ramp-up (85% Year 2), favourable exchange rates
- Conservative case: Lower spreads (-₹500/MT), delayed commissioning (Year 1 at 50%), rupee depreciation of 5%
Sensitivity analysis should test various scenarios impacting CPO prices, refining capacity utiland costs. Key factors to vary include CPO landed cost, selling price changes, refining loss percentages, capacity utilisation, debtor days, interest rates and rupee-dollar exchange rate.
Scenario Comparison (Year 3)
| Indicator | Base Case | Optimistic | Conservative |
|---|---|---|---|
| EBITDA (₹ Cr) | 13.5 | 18.2 | 8.8 |
| PAT (₹ Cr) | 4.1 | 7.5 | 1.2 |
| Average DSCR (Years 1–5) | 1.21 | 1.58 | 0.88 |
| Peak working capital (₹ Cr) | 77.4 | 72.0 | 92.0 |
In my professional experience, lenders look favourably at DPRs where sensitivity analysis is transparent and realistic rather than presenting only the best case. Advanced models can also check covenant compliance (minimum DSCR, maximum debt equity ratio) under stress scenarios, though such covenants are bank-specific. Price volatility in crude oil and CPO markets makes such stress testing essential.
Exchange rate fluctuations can affect the competitiveness of palm oil refiners operating with imported CPO.
Common Financial Modelling Mistakes in Palm Oil Refinery DPRs
Many otherwise sound technical projects struggle during bank appraisal because of modelling errors and unrealistic assumptions. Financial projections must be defensible, not decorative.
Frequent mistakes specific to palm oil refinery DPRs:
- Assuming unrealistic gross refining margins per MT (e.g., ₹5,000/MT spread when actual market spreads are ₹1,000–₹2,500)
- Overestimating capacity utilisation from Year 1 (assuming 90% when 60% is more realistic for a new plant)
- Not providing correctly for freight, port charges and import duties in CPO cost calculation
- Ignoring refining and handling losses (treating 100% of CPO input as saleable product)
- Double counting: showing olein and stearin volumes on top of RBD oil rather than as fractions of it
Additional issues:
- Working capital underestimation: assuming too few inventory or receivable days
- Inconsistent projected balance sheet where total assets do not match total liabilities
- Interest calculated on closing loan balance rather than average balance
- Tax applied to accounting profit without considering depreciation allowances correctly
- Copy-pasting generic financial projections without adapting to project-specific technology, location, raw material sourcing and financing terms
Banks notice these inconsistencies when reviewing CMA data, fund-flow statements and MPBF schedules. Such errors can delay or derail loan approval. Engaging a professional Chartered Accountant familiar with industrial appraisals reduces these errors and improves the credibility of the proposal.
Documents Required for Palm Oil Refinery Bank Finance and CMA Data
A serious palm oil refinery bank loan proposal requires both technical and financial documentation, structured to support independent appraisal by the bank’s credit team.
Promoter and business documents:
- KYC (PAN, Aadhaar), company or LLP incorporation documents, partnership deed or sole proprietorship declaration
- Shareholding pattern, promoter net worth statements
- Past financial statements and income-tax returns (for existing businesses)
Project-specific documents:
- Detailed project report (DPR) with technical and financial analysis
- Machinery quotations for refinery, fractionation, utilities
- Land documents, building plans and construction estimates
- Quotations for storage tanks, ETP and lab equipment
Finance-specific documents:
- Projected P&L, cash flow and balance sheet for 7–10 years
- CMA data forms (I through VI)
- Working capital assessment note
- DSCR statement and means-of-finance chart
- A DPR must include a business and promoter profile
Regulatory and compliance documents:
- Pollution control board consents
- Factory licence plan
- FSSAI-related permissions for edible oil production
- Import-Export Code if importing CPO
Existing bank facilities, latest sanction letters and account conduct statements should also be included if the applicant already has limits with any bank. A DPR should document revenue and margin models clearly, and financial projections in a DPR must show cash flow repayment ability.
Why a Professionally Prepared Bankable DPR Matters
A generic template spreadsheet with arbitrary numbers is not a bankable DPR. A customised palm oil refinery DPR integrates plant capacity, technology choice, material balance, operating cost, project cost, means of finance, working capital cycle, DSCR and IRR into one consistent report.
- Bank credit officers rely on such DPRs, alongside their own appraisal, to understand refining margins, demand and supply factors, risk factors and mitigation strategies.
- A well-prepared DPR links technical production data to financial statements, ensuring that every revenue and cost line traces back to a physical quantity and a stated assumption.
- Promoters who present a large-scale edible oil refinery project report with integrated analysis demonstrate preparedness that can improve lender confidence, though no document guarantees loan sanction.
- Project Report Bank develops palm oil refinery bankable DPRs based on actual machinery quotations, realistic capacity utilisation paths and practical working capital policies, not generic spreadsheets.
Integration with Capacity Planning, Technology and Utilities
Financial projections must align with realistic capacity and technology choices. A 1,000 TPD continuous refinery model cannot be based on batch-process assumptions, and a 100 TPD semi continuous plant cannot assume the same per-MT cost structure as a large-scale automated facility.
- Capacity choice (100–1,000 TPD) should be informed by raw material availability, market access and edible oil refinery capacity planning analysis. Annual production capacity for processing plants ranges from 100,000 to 300,000 MT at the upper end of this scale.
- Technology selection (batch vs semi continuous vs continuous, physical vs chemical refining) affects yields, utility consumption and manpower. Edible oil refinery machinery and EPC selection decisions drive a substantial portion of capex and operating cost.
- Utility sizing (steam boilers, power systems, chillers) and related costs must be consistent with refinery capacity. Key players in plant and machinery supply such as Wilmar International (who operate large-scale integrated refineries) set efficiency benchmarks that smaller refiners should study.
Indicative Utility Requirements by Capacity
| Capacity (TPD) | Power Load (kW) | Steam (MT/hr) | Cooling (TR) |
|---|---|---|---|
| 100 | 400–600 | 3–5 | 80–120 |
| 300 | 1,000–1,500 | 8–12 | 200–300 |
| 500 | 1,500–2,200 | 12–18 | 300–450 |
| 1,000 | 2,500–4,000 | 20–30 | 500–800 |
Integrated fractionation and winterisation (as detailed in the edible oil fractionation and winterisation plant article) should be captured as separate capex and revenue streams in the financial model. The different types of unit operations in refining and fractionation affect both the materials processed and the efficiency of conversion.
Professional Palm Oil Refinery DPR, CMA Data & Bank Finance Advisory by CA Manish Gugliya
CA Manish Gugliya, FCA, DISA (ICAI), is a practising Chartered Accountant with over 20 years of professional experience in DPRs, CMA data preparation, financial projections and project finance advisory. He is the founder of Project Report Bank, a professional advisory platform that serves industrial project promoters across India.
Specialised services relevant to palm oil refinery promoters:
- Customised bankable Detailed Project Reports with integrated technical and financial analysis
- Palm oil refinery financial projections and 10-year models
- Palm oil refinery CMA data preparation (Forms I through VI)
- Working capital and MPBF analysis calibrated to CPO import cycles
- DSCR and repayment profiling across base and stress scenarios
- Project feasibility, sensitivity analysis and ratio analysis
- Equity fundraising documents and investor-ready models for large integrated palm oil projects
- Professional financial projections and financial modelling services for all scale categories
Serious promoters planning new palm oil refinery projects or existing processors seeking to expand their processing capacity are invited to share details including proposed capacity, project location, estimated project cost, existing vs new project status, required term loan and working capital limits via the ProjectReportBank.com WhatsApp or website contact. Financing approval remains at the discretion of lenders based on their independent appraisal.
Conclusion: Using Financial Projections as a Decision Tool, Not Just a Loan Requirement
Palm oil refinery financial projections, working capital assessments and DSCR calculations are tools for evaluating viability, not only for satisfying bank documentation requirements. A model that integrates capacity, margins, working capital and debt service gives the promoter a financial roadmap for the business, not merely a form to attach to a loan application.
The core elements of a sound palm oil refinery finance blueprint:
- Realistic capacity utilisation path and yields validated against the chosen refining technology
- Transparent refining margins based on current market intelligence, not inflated spreads
- Adequate working capital provision accounting for CPO import cycles and credit terms
- Structured CMA data with internally consistent financial statements
- Sustainable DSCR across the loan tenor, tested under conservative scenarios
- Clear sensitivity analysis that identifies the scale of risk rather than hiding it
Integrating technical, commercial and financing assumptions into a robust model helps promoters avoid undercapitalisation and liquidity stress after commissioning. Investors evaluating palm oil refinery projects should demand the same rigour.
Long-term refinery success depends on disciplined financial planning and continuous monitoring as much as on technology and demand. For project-specific palm oil refinery financial modelling, DPR preparation and bank loan advisory tailored to Indian market conditions, contact Project Report Bank.
Frequently Asked Questions
How are financial projections for a palm oil refinery different from those for a palm oil trading business?
Refinery projections are capacity-driven and process-driven. They start from TPD capacity, pass through material balance (CPO to RBD oil, olein, stearin, PFAD), account for refining losses, and build up to product-wise revenue. Trading projections are volume-and-margin-driven without manufacturing processes, depreciation on process equipment, or utility costs. Bank appraisal for a refinery pays more attention to term loan structure, DSCR and capex-related security, whereas a trading business loan appraisal focuses on stock audit, debtor management and turnover efficiency. Palm kernel oil trading, for instance, involves different financial dynamics from refining CPO.
What is a realistic time frame to prepare a complete palm oil refinery DPR and CMA data?
For a serious project (300–500 TPD) with machinery quotations and basic technical configuration available, a professional firm typically needs 2–4 weeks to prepare a detailed bankable DPR and CMA data. Additional time may be required for iterative discussions on assumptions, alignment with specific bank formats and sensitivity scenarios. Promoters should factor this lead time into their overall project implementation and bank-application schedule. The expected timeline lengthens if machinery quotations or land details are incomplete.
Can I use the same financial model if I later add palm olein and stearin fractionation to my refinery?
The base refinery model can be extended, but fractionation changes the product mix, yields, capital cost and working capital. A separate module or revised model is recommended. Integrated modelling should show additional revenue and margin from olein and stearin while updating utilities, maintenance costs and new loan requirements for added capex. Promoters should plan the expansion as a phased project in the financial model, with clear Stage 1 (refining) and Stage 2 (fractionation) assumptions.
How often should I update palm oil refinery financial projections once the plant is operational?
At least an annual update of 5–7 year forward-looking projections is recommended, aligned with budget cycles and working capital renewal timelines. More frequent reviews are needed whenever CPO prices, import duty structures or interest rates move sharply. Updated projections help in renewal of credit limits, restructuring discussions and planning for capacity expansion or debottlenecking. Comparing actual performance against original projections also improves the quality of subsequent investment decisions and lender communication.
Is it necessary to prepare a separate model for lenders and for internal decision-making?
The core financial model should be the same, but presentation may differ. Banks typically require CMA formats, DSCR sheets and conservative scenarios, whereas internal models may include more aggressive growth plans, expansion scenarios, and additional KPIs relevant to production and scale. Numbers shared with banks must remain consistent with internal models to maintain credibility; only the level of detail and scenario range may vary. Project Report Bank can help design one robust model that feeds both bank-facing and internal decision-support outputs.