Key Takeaways
An integrated rice products revenue model earns from multiple streams – milled rice, poha, puffed rice, snacks, ready-to-cook items and by-products – rather than depending on commodity rice margins alone. Profitability hinges on realistic assumptions for capacity utilisation, yield recovery, net price realisation, packaging costs and working capital cycle, not just installed tonnage.
Compared to a standalone rice mill, an integrated rice processing business model can potentially improve value realisation per tonne of raw paddy by converting it into a diverse range of rice based products while monetising by-products like bran and husk. By-product revenue alone can contribute 15–25% of gross realisation when managed well.
Actual integrated rice products profitability varies with product mix, market strategy, interest cost, brand investments and production efficiency. A detailed, project-specific DPR with CMA data is essential before approaching any bank or financial institution for term-loan or working-capital finance.
ProjectReportBank.com, led by CA Manish Gugliya, prepares integrated rice products project reports, financial projections and bankable DPRs tailored for MSME loans and term-loan proposals. This article walks you step by step through revenue streams, market strategy, pricing, cost structure, break-even and sensitivity analysis for an integrated value added rice products business.
Introduction: Why Capacity Alone Does Not Guarantee Profitability
Simply increasing rice milling capacity or setting up a larger plant does not automatically translate into higher profit. What matters is the economics of each product line within the integrated rice products revenue model – how much value you extract from every tonne of paddy, and at what cost.
A conventional rice mill earns mainly from commodity rice margins, competing on price with every other mill in the district. An integrated rice products manufacturing plant, in contrast, converts the same paddy into premium rice, poha, puffed rice, snacks and ready-to-cook items – each with distinct margin profiles and market channels. Diversified revenue streams improve utilisation of infrastructure and by-products, providing resilience against price volatility.
The variables that determine the rice processing plant profit margin are interconnected: product mix, net realisation, value addition per kg, capacity utilisation, the working capital cycle and financing cost. This article, written from the perspective of CA Manish Gugliya at ProjectReportBank.com, focuses on project finance, DPR preparation and practical profitability analysis rather than theoretical food technology.
Understanding the Integrated Rice Products Business Model
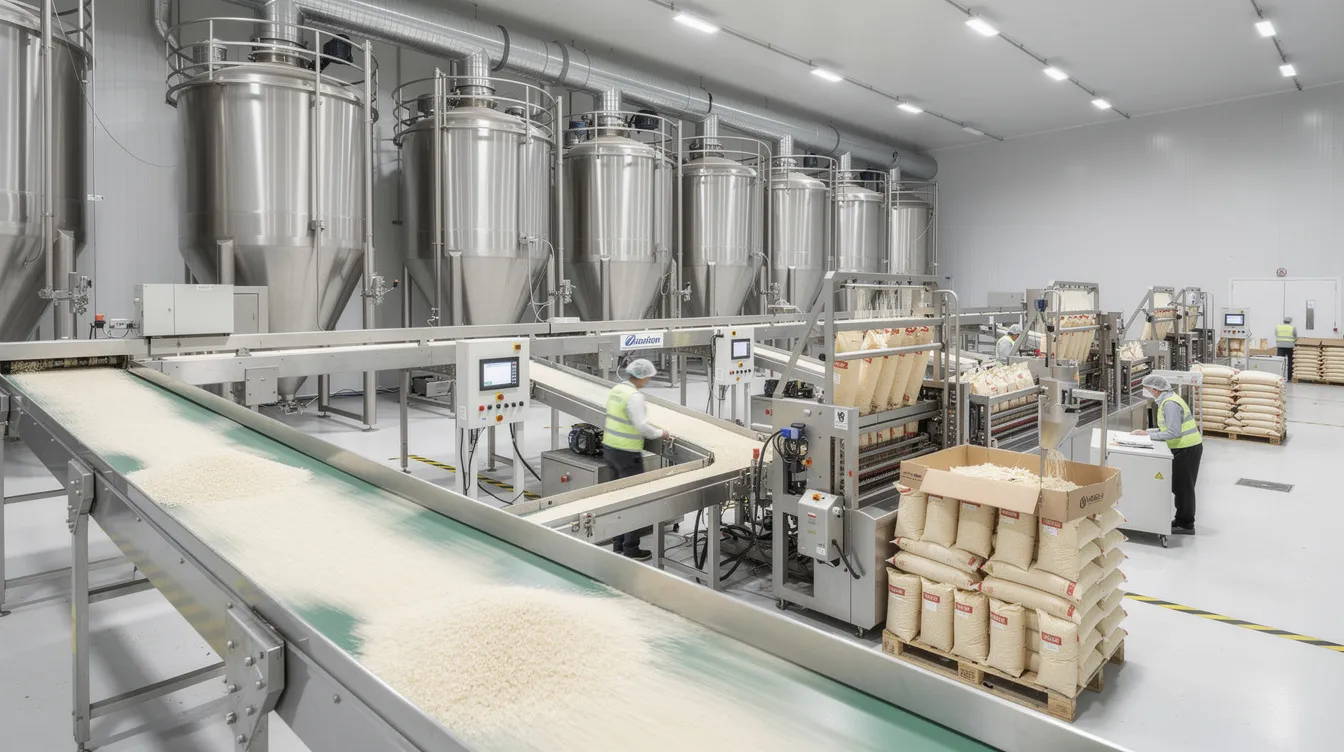
An integrated rice products facility houses rice milling, rice flakes (poha), puffed rice (murmura), rice flour, snacks and ready-to-cook lines under one roof, sharing common utilities, storage and infrastructure. Integrated processing of rice involves multiple stages like cleaning, destoning, husking, milling, grading, polishing and further conversion into value-added formats. Integrated rice mills achieve economies of scale through high production volumes distributed across multiple product lines.
Concrete products from such a facility include conventional milled rice, parboiled rice, premium branded packaged rice, rice flakes and poha, instant poha, puffed rice, chivda and namkeen, ready-to-cook breakfast mixes, cup poha, rice flour, broken rice-based products, rice bran and husk-based outputs. Value-added products include fortified rice and rice flour, where fortified rice is enriched with micronutrients like iron and vitamins to serve food security and nutrition objectives. Milling operations create opportunities for value-added services that go well beyond simple grain polishing.
Common facilities – dryers, storage silos, cleaning and grading lines, packaging machines, boilers and power distribution – are shared across product lines, improving asset utilisation and lowering per-unit overheads. For detailed infrastructure planning, refer to the guides on integrated value-added rice plant machinery and equipment cost, integrated rice processing plant land, building and layout and utilities, warehousing, packaging and material handling for integrated rice plant.
The Broader Case for Integration: Lessons from Integrated Rice Farming
The principle of integration has proven transformative not only in rice processing but even at the farm level. Globally, integrated rice-fish farming improves living conditions for farmers by combining rice cultivation with aquaculture sectors, creating additional income and food sources from the same land. China’s integrated rice-aquaculture area reached 2.86 million hectares in 2022, reflecting the scale at which developing countries are adopting this approach.
Research shows that 68.29% of farmers saw increased income from integrated farming, with the average income from integrated farming increased by 7,431 USD/ha. Rice-crayfish farming yields 7,516 USD/ha in profit, and integrated rice-fish farming can increase profits by 6.6 times compared to monoculture rice farming. Rice-fish co-culture can yield up to 13,493.3 kg of rice per hectare, demonstrating increased yields through ecological synergy rather than simply applying more chemical fertilizers.
The social benefit index for integrated farming is 0.45, indicating meaningful impact on rural development and local communities. Integrated farming creates new industries supporting local communities while promoting agricultural innovation and skill improvement and capacity building among smallholder farmers and small farmers. It also delivers environmental benefits: integrated farming reduces nitrogen fertilizer use by 45% compared to monoculture, rice-aquaculture systems cut nitrogen fertilizer use to 64.36 kg/ha, phosphorus fertilizer application decreases to 38.12 kg/ha in integrated systems, and integrated rice-aquaculture systems reduce pesticide use by 74–87%.
The integrated rice-aquaculture system promotes biodiversity and ecological balance, as aquatic species in rice fields enhance nutrient cycling and energy flow. Integrated systems improve biodiversity and ecological balance in farming, while aquaculture reduces greenhouse gas emissions compared to traditional farming. Integrated farming reduces reliance on chemical inputs, lowering production costs, improving soil fertility and preventing soil degradation – all of which align with sustainable farming practices and sustainable agriculture principles.
These outcomes provide empirical evidence that integration – whether at the farm or the factory – unlocks value that siloed operations cannot. The same logic applies when a rice mill integrates food processing lines: shared resources, circular by-product flows and diversified income streams collectively improve farmer income, support food security and drive sustainable growth. Whether looking at global rice production trends, organic farming innovations or rice production statistics from Tamil Nadu and West Bengal – India’s largest producer states – the direction is clear: integration creates resilience and long term sustainability.
Integrated Rice Products Revenue Model
Integrated rice companies create multiple revenue streams from paddy. Instead of selling only milled rice to traders, the plant generates income from core rice, value-added SKUs, convenience products, branded packs and by-products. The integrated rice products revenue model works as a combination of these streams, each with different margins, volumes and market strategies.
Integrated rice products rely on a circular value chain where every output – including what would otherwise be waste – finds a revenue home. While value added rice products profitability can be higher per kilogram, the requirements for quality control, packaging, marketing and working capital also increase. All financial figures discussed below should be customised for plant size, geography and market positioning in the integrated rice products project report.
Revenue from Core Rice Products
Rice milling typically yields 68% to 72% milled rice from paddy. Head rice yield constitutes roughly 65% to 70% of total output, with the balance being broken rice and by-products. Revenue from conventional and premium milled rice – raw rice, parboiled rice, Sona Masuri, basmati-type and regional traditional rice varieties including pigmented rice and brown rice – forms the volume backbone of the revenue model.
Revenue is calculated as quantity of paddy milled multiplied by rice recovery percentage multiplied by net selling price. The rice crop quality, moisture content and farming practices at the procurement stage directly affect this calculation. Procurement of raw paddy directly from farmers helps control costs, and primary consumer packaged goods sales include whole grains sold to retail and wholesale channels. Premium branded packaged rice can fetch significantly higher realisation than bulk unbranded rice sold to traders, directly lifting the rice products gross profit margin. For more detail on conventional milling economics, see the guide on rice mill revenue model and product mix.
Revenue from Poha and Rice Flakes
Poha manufacturing uses specific grades of rice or broken rice, integrating naturally with the core mill’s output. Revenue channels include loose poha to wholesalers, packaged poha under an own brand, institutional supplies to snacks manufacturers, hotels and caterers. In studies of the rice industry, poha net margins range from approximately 8–11% for wholesale to 24–32% for export-grade products, making it a high-volume, moderate-margin contributor in the integrated rice product mix revenue analysis.
For detailed production process and DPR guidance, see the integrated poha, puffed rice and rice snacks manufacturing process and the instant poha manufacturing plant project report and DPR.
Revenue from Puffed Rice and Murmura
Puffed rice is a low-weight, high-volume product used extensively in local snacks, chivda, street food and packaged namkeen, produced in both small scale units and integrated plants. Revenue models include bulk sacks to traders and namkeen units, small branded pouches for retail and institutional packaging contracts for private labels. Illustrative data suggests EBITDA margins around 25% and PBT around 20% for puffed rice manufacturing at scale, where fuel efficiency, yield and consistent demand through high utilisation are critical. Even thin per-kg margins become attractive when volumes and working-capital rotation are strong, contributing meaningfully to the rice processing plant turnover potential.
Revenue from Rice Snacks and Chivda
Value-added snacks – chivda mixes, flavoured murmura, masala poha, extruded rice snacks and baked rice-based namkeen – represent a higher-margin extension of the base product lines. These products add seasoning, frying or baking and sophisticated packaging, increasing selling price but also adding cost for ingredients, oil, packaging and marketing spend.
In the integrated rice products revenue model, snacks often contribute disproportionately to profit despite forming a smaller share of total volume. This is a rice snacks manufacturing business where branding, distribution strategy and shelf life management play a pivotal role.
Revenue from Ready-to-Cook and Breakfast Products
Instant poha, ready-to-cook rice upma, breakfast mixes and cup poha target the growing demand from urban and working consumers seeking convenience. Revenue drivers include higher MRP, multiple SKUs, modern trade and e-commerce presence and sometimes export potential to Indian diaspora in international markets.
These products require stringent food safety, shelf life testing and packaging standards. Refer to ready-to-cook rice breakfast mixes manufacturing, cup poha manufacturing, packaging and business model and instant poha packaging, shelf life and food safety for detailed guidance. These niche products can significantly lift integrated rice products profitability if supported by a strong marketing strategy and adequate working capital.
Revenue from Packaged and Branded Products
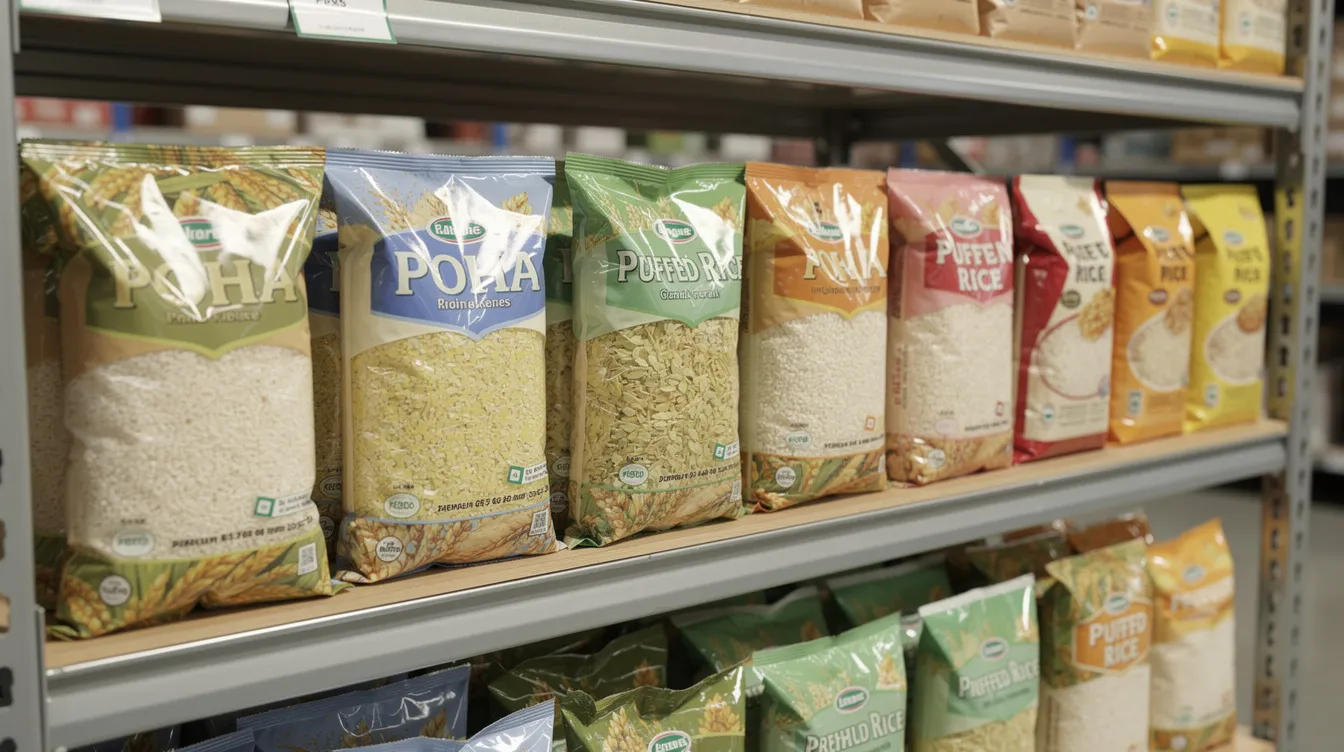
There is a fundamental difference between commodity sales – rice sold by weight to traders – and branded FMCG-style products with printed pouches, MRPs and consumer marketing. Companies utilize branding to command higher prices in retail markets, and businesses sell packaged rice directly to consumers for higher profit margins. However, net realisation to the manufacturer is calculated after deducting distributor margins, retailer margins, schemes, freight and GST from MRP. The rice products sales model for a B2C-focused strategy must account for these deductions honestly.
Revenue from Rice By-Products
Rice husk accounts for about 20% of paddy weight. Broken rice typically accounts for 10% to 15% of output. Rice bran is sold for oil extraction and animal feed, while defatted rice bran is used for livestock feed. Rice bran oil extraction is a well-established industry in its own right. Rice husk can be used as biomass fuel or processed for silica, and utilities like steam can be generated from burning rice husk in in-house boilers, reducing external energy purchases.
Byproduct utilization improves overall revenue and margins. By-product sales supplement income and help minimize raw material dependency, making the rice processing plant EBITDA more resilient. The integrated rice products DPR should include realistic by-product realisation assumptions. For conventional cost benchmarks, see rice mill operating cost and cost of production.
Integrated Rice Products and Revenue Streams – Overview Table
The following table provides a snapshot of the integrated rice products revenue model for promoters and consultants. Values should be customised in the project-specific DPR.
| Product | Target Market | Revenue Model | Margin Characteristic | Strategic Importance |
|---|---|---|---|---|
| Core milled rice | Traders, retailers, wholesale | Commodity / branded retail | Low to medium | Volume driver |
| Premium packaged rice | Retail, modern trade, export | Branded retail, export | Medium to high | Margin and brand driver |
| Poha / rice flakes | Wholesale, retail, institutional | Commodity + branded | Medium | Volume and margin driver |
| Instant poha | Modern trade, e-commerce, export | Branded retail | High | Margin and brand driver |
| Puffed rice / murmura | Traders, namkeen units, retail | Bulk + branded | Medium | Volume driver |
| Chivda / snacks | Retail, modern trade | Branded retail | High | Margin driver |
| Ready-to-cook mixes | Modern trade, e-commerce | Branded retail | High | Innovation and margin driver |
| Rice flour | B2B food manufacturers, retail | Commodity + branded | Low to medium | Utilisation driver |
| Rice bran | Oil extraction plants, feed | Commodity B2B | Low | By-product utilisation |
| Rice husk | Boiler fuel (internal), industrial | Internal use / commodity | Cost saving | Resource efficiency |
| Broken rice products | Feed, flour, low-cost food | Commodity B2B | Low | By-product utilisation |
Export markets can provide higher margins for specialty rice and branded convenience products, but require quality certifications and logistics investment.
Product Mix Planning and Revenue Optimisation
Promoters must go beyond selecting products with the highest selling price. The decision should weigh contribution margin per kg, market depth, shelf life, production complexity, raw material compatibility, packaging cost, distribution margin, inventory days, working capital intensity and market acceptance.
Products can be categorised into volume drivers (core rice, poha, murmura), margin drivers (snacks, instant products, breakfast mixes) and strategic products (by-product utilisation, health-oriented SKUs). A balanced integrated rice product mix ensures the plant earns a stable base through volume while extracting premium value from selected lines.
| Product | Capacity Share (%) | Indicative Net Realisation (₹/kg) | Margin Potential | Market Segment | Strategic Role |
|---|---|---|---|---|---|
| Milled rice | 50–60 | 30–45 | Low–medium | B2B / B2C | Volume driver |
| Poha | 15–20 | 28–42 | Medium | B2B / B2C | Volume + margin |
| Puffed rice | 8–12 | 35–55 | Medium | B2B / B2C | Volume driver |
| Snacks / chivda | 5–8 | 80–150 | High | B2C / retail | Margin driver |
| Instant / RTC | 3–5 | 120–200 | High | B2C / export | Innovation driver |
| By-products | Balance | 5–18 | Low | B2B | Utilisation driver |
All figures are illustrative only. For detailed capacity and mix planning, refer to the guide on integrated rice processing capacity and product mix.
Capacity Utilisation and Revenue Potential
Installed capacity, achievable utilisation and ramp-up schedule determine rice processing plant turnover potential far more than nameplate capacity alone. Realistic DPRs for a new integrated plant assume utilisation ramping from around 50–60% in Year 1 to 75–85% by Years 3–4 rather than 100% from the start.
| Utilisation (%) | Revenue Index | Fixed Cost per Tonne | Operating Margin Impact |
|---|---|---|---|
| 50% | Base | Highest | Thin / break-even zone |
| 60% | +20% | Lower | Modest positive |
| 70% | +40% | Moderate | Stable profit zone |
| 80% | +60% | Low | Strong profitability |
| 90% | +80% | Lowest | Optimal zone |
Higher utilisation spreads fixed costs – labour, depreciation, minimum utility charges – and improves the rice processing plant operating margin. However, it requires stronger market linkages and more working capital. See working capital requirement for rice mill for the linkage between utilisation and inventory planning.
Rice Products Market Strategy
The rice products market strategy must align with the chosen business model and the integrated rice products revenue model. Strong market linkages are essential for translating plant capacity into cash flows and achieving projected rice products manufacturing profitability. The following sub-sections outline B2B, B2C, institutional and export channels.
B2B Market Strategy
Key B2B customers include snack manufacturers, hotel and catering units, institutional kitchens, wholesalers, private-label brand owners and food processors. B2B rice products marketing focuses on reliability, consistent grain quality, competitive pricing and shorter credit cycles rather than heavy consumer advertising. B2B sales can stabilise base volumes for poha, puffed rice, rice flour and core rice, contributing a predictable rice processing business revenue stream. Margins are usually thinner than branded retail but require less marketing spend and can improve rice processing plant ROI through high throughput.
B2C Market Strategy
B2C channels include kirana stores, supermarkets, modern trade chains, e-commerce platforms and quick-commerce apps. Sales of packaged rice, snacks, instant poha and breakfast mixes depend heavily on branding, packaging appeal, MRP strategy and consumer promotions. A B2C rice products branding strategy yields higher unit margins but increases marketing and working-capital requirements. For a focused example of product-level go-to-market, see instant poha market, pricing and distribution strategy.
Institutional Market Strategy
Institutional buyers – government-hostel kitchens, schools, hospitals, corporate cafeterias and defence suppliers – operate under tender and procurement norms. Institutional supplies are price-sensitive with strict quality and delivery conditions but can anchor steady volumes. DPRs should realistically assess qualification criteria and payment terms; long credit periods in institutional contracts affect cash flows and must be factored into rice products financial projections.
Export Market Strategy
Export potential exists for premium basmati-type rice, speciality regional rice, branded poha, puffed rice snacks and instant convenience products, especially to the Middle East, Europe, North America and Africa. Exporters need reliable logistics, documentation, buyer relationships and food safety certifications including FSSAI compliance. Promotion costs and payment risk must be considered in the rice processing plant financial feasibility. Treat exports cautiously in early projections, beginning with pilot shipments rather than assuming large volumes from Year 1.
Pricing Strategy for Integrated Rice Products
Pricing must balance cost recovery, market-competitive rates and desired positioning for each product in the rice based products portfolio. Key pricing methods include cost-plus pricing, competitor-based pricing, channel-driven pricing for B2B and B2C, private-label price negotiations and export pricing with forex considerations.
A simplified pricing waterfall illustrates how net realisation differs from MRP:
- MRP (printed on pack)
- Minus GST (where applicable)
- Minus retailer margin (typically 8–15%)
- Minus distributor margin (typically 6–12%)
- Minus trade schemes, incentives and introductory discounts
- Minus logistics and freight
- Minus returns, damages and promotional expenditure
- = Net realisation to manufacturer
Rice products financial projections in the DPR must use net realisation, not consumer MRP, to calculate the rice products gross profit margin and contribution. For an example of product-specific pricing and projection methodology, see instant poha profitability, financial projections and working capital.
Distribution Strategy and Channel Economics
Typical FMCG-style distribution for packaged rice and snacks follows the chain: company → super-stockist → distributor → retailer → consumer. Combined channel margins of 25–30% plus trade schemes can significantly reduce net realisation from MRP. Sales incentives, introductory discounts, consumer schemes, freight, warehousing and sales team expenses all erode the actual rice processing plant operating margin.
Faster-moving SKUs and shorter credit periods support better cash conversion cycles. Aggressive geographical expansion without planning, however, can strain working capital and dilute management attention. The consistent demand for staple rice products helps, but even staples carry credit risk when distribution is over-extended.
Branding Strategy for Value-Added Rice Products
The decision to sell as a commodity, use an own brand, manufacture for private labels or pursue a mixed approach depends on the promoter’s capital, market access and long term success goals. Own-brand B2C models should include a separate marketing and brand-building budget line covering artwork, trademark registration, product photography, digital marketing, in-store promotions, sampling and e-commerce marketplace commissions.
Private-label manufacturing can be a lower-risk avenue to utilise capacity with limited marketing cost, though at negotiated lower margins. Entrepreneurs should phase branding investments: start in local and regional markets before attempting a national-level rice snacks market strategy. The world’s population of health-conscious urban consumers is growing, and brands that invest early in health benefits messaging and trust can build durable advantages.
Cost Structure of an Integrated Rice Products Plant
Costs are divided into variable costs (paddy and rice procurement, ingredients and seasonings, edible oil, packaging material, fuel and power linked to production, freight outward, sales incentives) and fixed costs (salaries, supervision, rent, insurance, minimum power demand charges, admin overheads, depreciation).
Major cost heads include:
- Paddy / rice procurement (typically 50–60% of total cost)
- Spices, seasonings and edible oil
- Packaging material (pouches, cartons, labels)
- Power and boiler fuel (including husk)
- Labour and supervision
- Repairs and maintenance
- Quality control and food safety compliance
- Warehousing and freight
- Sales and distribution expenses
- Admin, insurance, interest on term loan and working capital, depreciation
Paddy cost and packaging cost are usually the most sensitive items after sales realisation in the rice products cost and profitability analysis. Operational efficiency is crucial for profitability in rice milling and across all value-added lines. Utilities like steam generated from burning rice husk in-house can improve efficiency and reduce external fuel dependence.
Gross Margin, Contribution and EBITDA
Understanding the difference between financial metrics is critical for sound decision-making:
- Gross margin: Net sales minus raw material and direct manufacturing cost
- Contribution: Sales minus all variable costs
- EBITDA: Earnings before interest, tax, depreciation and amortisation
- PBT / PAT: Profit before and after tax
Promoters should focus on contribution per kg or per tonne by product rather than overall gross margin percentage. A product with 40% gross margin but heavy packaging and marketing cost may yield lower EBITDA than a product with 25% gross margin sold in bulk with minimal overheads. Banks and investors frequently analyse EBITDA margin trends and DSCR, not just turnover and PAT, when evaluating rice processing plant financial feasibility.
Illustrative Revenue and Profitability Model
The following table presents a hypothetical annual model for an integrated rice products plant processing approximately 5,000 tonnes of paddy per year at 70% capacity utilisation. All figures are illustrative only and must be derived from project-specific assumptions in the DPR.
| Particulars | Amount (₹ Lakh) |
|---|---|
| Revenue | |
| Core milled rice | 85.0 |
| Poha / rice flakes | 28.0 |
| Puffed rice | 18.0 |
| Snacks / chivda | 12.0 |
| Ready-to-cook / instant products | 8.0 |
| By-products (bran, husk, broken rice) | 14.0 |
| Total Revenue | 165.0 |
| Expenses | |
| Raw material (paddy, ingredients) | 88.0 |
| Packaging material | 12.0 |
| Manufacturing expenses (power, fuel, consumables) | 10.0 |
| Employee cost | 8.0 |
| Selling and distribution expenses | 10.0 |
| Administrative expenses | 4.0 |
| Total Operating Expenses | 132.0 |
| EBITDA | 33.0 |
| Interest (term loan + working capital) | 7.0 |
| Depreciation | 6.0 |
| Profit Before Tax | 20.0 |
These figures are for illustration purposes only. Do not use them as industry benchmarks. Actual values depend on location, scale, product mix and market conditions. For project-cost structuring, see integrated value-added rice plant project cost and means of finance.
Break-Even Analysis for Integrated Rice Products
The core formula is straightforward:
Break-Even Sales = Fixed Costs ÷ Contribution Margin Ratio
If fixed costs (salaries, depreciation, interest, admin, insurance) total ₹25 lakh per year and the weighted average contribution margin ratio across all products is 30%, the break-even sales value is approximately ₹83 lakh. Studies indicate that break-even for a poha unit occurs at roughly 50–55% capacity utilisation, and similar thresholds apply to integrated plants depending on product mix.
The margin of safety – actual sales minus break-even sales – indicates how much room the business has to absorb cost increases or price drops. A healthy margin of safety is important for rice processing business profit resilience. For deeper concepts applied to conventional milling, see rice mill profitability and break-even analysis.
Working Capital Impact on Profitability
A business can show accounting profit yet face cash-flow stress due to high inventory, long receivables and limited supplier credit. Key working capital components include raw material stock (paddy and inputs), packaging stock, finished-goods inventory across product lines, trade receivables and cash balances, net of trade creditors.
The cash conversion cycle in an integrated rice processing business runs from purchase of paddy through processing, storage, sales, credit period and collection. Branded snacks and instant products typically have longer receivables and higher finished-goods inventory than commodity rice. Every extra day in the cycle raises interest costs and erodes net profitability. See working capital requirement for rice mill for baseline calculations and then layer on the impact of value-added lines.
Key Profitability Drivers in an Integrated Rice Products Business
| Factor | Impact on Profitability | Management Action |
|---|---|---|
| Paddy procurement cost | Highest single cost; directly affects contribution | Contract with farmers, seasonal buying, quality control |
| Recovery / yield percentage | Even 1–2% improvement lifts margins significantly | Modern milling, sorting and grading equipment |
| Product mix | Higher share of value-added products improves average realisation | Phased addition of snack and instant lines |
| Packaging cost | Can be 7–15% of revenue; volatile | Standardise SKUs, negotiate bulk rates |
| Net selling price | Drives top-line and contribution | Balanced pricing strategy, avoid excessive discounting |
| Capacity utilisation | Spreads fixed cost, improves operating margin | Build market before building capacity |
| Energy efficiency | Fuel and power are significant cost heads | Use husk as boiler fuel, improve efficiency |
| Labour productivity | Affects cost per unit, especially in snacks and packaging | Training, automation where feasible |
| Distribution margin | Channel costs directly reduce net realisation | Optimise number of intermediaries |
| Working capital cycle | Interest cost on WC erodes PAT | Reduce receivable days, manage inventory tightly |
A systematic focus on these drivers, backed by monthly MIS and variance analysis, is essential for sustaining integrated rice products profitability. Small improvements in multiple areas compound into meaningful margin gains at scale, supported by the value chain’s inherent efficiencies.
Sensitivity Analysis and Risk Assessment
Banks look for resilience in projections, not just best-case scenarios. Sensitivity analysis tests how changes in key variables affect the project’s ability to service debt.
| Scenario | Revenue Impact | EBITDA Impact | DSCR Impact | Suggested Management Response |
|---|---|---|---|---|
| Selling price drops 5% | –₹8.25 lakh | –₹8.25 lakh | Falls | Adjust product mix towards higher-margin SKUs |
| Raw material cost rises 5% | Nil on revenue | –₹4.40 lakh | Falls | Renegotiate procurement, improve recovery |
| Utilisation 10% lower | –₹16.50 lakh | –₹11.55 lakh | Falls significantly | Strengthen marketing, consider private-label contracts |
| Packaging cost rises 10% | Nil | –₹1.20 lakh | Marginal | Review pack sizes, negotiate supplier rates |
| Interest rate rises 1% | Nil | Nil (hits PBT) | Falls | Prepay selectively, improve cash cycle |
| Marketing spend +20% | Nil immediately | –₹2.00 lakh | Falls | Phase brand spend, measure ROI per channel |
Figures based on the illustrative model above. For sensitivity methodology applied to conventional rice milling, see rice mill ROI, IRR, payback and sensitivity analysis.
Revenue Strategy for Different Rice Products Business Models
A promoter may start with one model and evolve as capacity, capital and market experience grow. Revenue composition, margin structure, risk profile and working-capital needs differ sharply among models.
Commodity-Oriented Model
Focused on bulk rice, poha and puffed rice sales to traders with minimal packaging and branding. Offers lower margins but faster stock rotation, simpler operations and limited compliance burden. Suits promoters with limited capital or those upgrading from a traditional rice milling background.
B2B Value-Added Model
The plant supplies poha, puffed rice, rice flour and semi-processed snacks to institutional buyers, snacks companies and other food manufacturers. Offers moderate margins, stable offtake and uses the plant as a reliable backend. Requires QA consistency and logistics reliability.
Own-Brand Retail Model
Focuses on branded packaged rice, poha, instant poha, breakfast mixes and snacks under the promoter’s own brand. Can significantly enhance the value added rice products revenue model and brand equity but demands substantial investment in marketing, trade schemes and working capital.
Private-Label Manufacturing Model
The plant manufactures for other brands and retailers under their labels, focusing on operational efficiency and quality. Lower selling prices but reduced marketing expenses and potentially stable utilisation. Attractive for plants near major FMCG hubs or modern trade warehouses.
Integrated Hybrid Model
A blended strategy with commodities, B2B, private-label and a limited own-brand range. This diversification balances risk, improves utilisation and creates multiple rice products revenue streams, though it adds management complexity. Promoters should stage this evolution, starting simpler and adding channels as systems mature.
Market Development Strategy – Phase-Wise Approach
An integrated rice processing business should expand its sales footprint in line with capacity ramp-up and financial strength. Too-rapid expansion strains finances and execution.
Phase 1 – Local and Regional Market
Start with nearby districts and regional wholesale markets for rice, poha and puffed rice. Low logistics cost and easier quality-feedback loops are advantages. Build relationships with local industries and establish consistent quality reputation.
Phase 2 – Distributor Expansion
Appoint distributors or super-stockists in neighbouring states for packaged products once local demand is stabilised. Structure trade terms, margins and service-level expectations clearly.
Phase 3 – Institutional and B2B Sales
Target hotels, caterers, snack manufacturers and institutional kitchens with customised pack sizes and pricing. Institutional contracts provide base-load volumes for stable production planning.
Phase 4 – Branded Retail Expansion
Enter regional supermarket chains, modern trade and organised retail with select high-margin, high-visibility SKUs. This is where the rice products branding strategy begins yielding returns.
Phase 5 – E-Commerce and Quick Commerce
List on major e-commerce marketplaces and quick-commerce platforms with bundles and subscription packs, especially for health-oriented rice-based breakfast products. Account for platform commissions, shipping and returns in the rice products pricing strategy.
Phase 6 – Export Opportunities
Consider exports after establishing domestic operations. Start with pilot consignments of premium rice, poha and snacks to export markets with Indian diaspora. Documentation, quality certifications and regulatory compliance – including FSSAI licence, labelling and regulatory compliance for instant poha – are prerequisites.
Common Mistakes in Revenue and Profitability Planning
Frequent errors by promoters include:
- Assuming 100% capacity utilisation from Day 1
- Basing projections on MRP instead of net realisation
- Underestimating packaging, logistics and marketing costs
- Ignoring distributor and retailer margins in revenue calculations
- Overestimating premium-product demand without market validation
- Ignoring product-wise recovery percentages and wastage
- Applying the same profit margin assumption to every SKU
- Neglecting credit-period impact on working capital
- Overlooking by-product revenue or overestimating it
- Ignoring interest cost during the ramp-up phase
Such mistakes produce optimistic DPRs that fail bank scrutiny or do not match actual cash-flow realities. Cross-check assumptions with local market data, supplier quotations and past industry experience – or work with an experienced project consultant. The rice processing business has raised concerns among lenders when promoters present projections disconnected from ground reality.

Financial Feasibility and Bankability of an Integrated Rice Products Project
A bankable integrated rice products DPR should contain: promoter background, industry and market overview, detailed product mix, installed capacity, capacity utilisation plan, the complete production process, machinery details, land and building, utilities, manpower, project cost and means of finance. Financial sections must include working capital assessment, revenue assumptions, cost of production, projected P&L, balance sheet, cash-flow statement, DSCR, break-even, ROI, IRR, payback and sensitivity analysis.
Banks evaluate repayment capacity and debt-servicing ability, not only projected turnover. They will examine the reasonableness of assumptions for selling price, raw material cost and utilisation. For related references, see rice mill financial projections for DPR, DSCR and loan repayment capacity for rice mill and bank finance, DSCR, ROI and feasibility for instant poha plant.
A high-turnover project does not necessarily mean a highly profitable project. A low-margin B2B product may still be commercially attractive when volumes are high and the working-capital cycle is short. Promoters should evaluate product-wise contribution rather than relying only on consolidated gross margin.
DPR, CMA Data and Professional Support from ProjectReportBank.com
Customised detailed project reports, CMA data and financial projections help entrepreneurs present a credible case to banks and investors for integrated value added rice products projects. ProjectReportBank.com, under CA Manish Gugliya, offers bankable project reports, integrated rice products DPR, CMA data for working capital, sensitivity analysis, DSCR and ROI calculations and guidance on assumptions.
While projections are prepared professionally, no guarantee can be given regarding loan sanction or profitability – outcomes depend on market conditions and promoter execution. Entrepreneurs should consult early in the planning phase so that plant capacity, product mix, layout and financing structure can be aligned with realistic revenue and profit expectations. A principal scientist or industry consultant may supplement technical inputs, but the financial architecture must be sound.
Conclusion: Building a Sustainable, Profitable Integrated Rice Products Business
The success of an integrated rice products revenue model depends not only on technical capacity but on optimised product mix, realistic pricing, tight cost control, effective distribution and disciplined working-capital management. Each product line – core rice, poha, puffed rice, snacks, ready-to-cook and by-products – must be evaluated separately for contribution and risk before finalising investments.
Integrated plants can support broader goals: food security, value addition at source, rural employment and environmental benefits through efficient resource use and sustainable growth in local communities. Whether the focus is on agriculture-linked raw material sourcing, improve productivity through better milling technology, or improve efficiency through shared infrastructure, the integrated approach rewards systematic planning.
The rice processing industry continues to evolve. Consumer demand is shifting toward convenience, health outcomes and branded quality. Promoters who combine manufacturing capability with sound financial planning and phased market development will be best positioned for long term success.
For detailed project reports, CMA data preparation, profitability analysis, DSCR and ROI evaluation for integrated rice processing projects, reach out to CA Manish Gugliya at ProjectReportBank.com.
FAQs on Integrated Rice Products Revenue Model and Profitability
Is an integrated rice products business always more profitable than a simple rice mill?
Not necessarily. Integrated plants can potentially be more profitable due to multiple revenue streams and better utilisation of by-products, but they also involve higher complexity, investment, and working-capital needs. Benefit-to-cost ratios for flaked rice mills are approximately 1.40–1.50 and for puffed rice mills 1.30–1.40, indicating favourable returns at adequate scale. Profitability ultimately depends on execution, product mix, market strategy and finance cost.
How important is by-product revenue (bran, husk, broken rice) in the overall revenue model?
By-products may form a relatively modest share of turnover – typically 8–15% – but they can meaningfully impact net profit when monetised properly. Bran sold to rice bran oil extraction plants, husk used as in-house boiler fuel (saving external fuel cost) and broken rice processed into flour or sold as animal feed all contribute. In the illustrative model above, by-product revenue of ₹14 lakh on a ₹165 lakh turnover represents roughly 8.5% of revenue but directly improves EBITDA. These must be carefully estimated in the DPR.
Can a small-scale entrepreneur start with only poha and puffed rice and later integrate more products?
Yes, a phased approach is practical and often advisable. Begin with core lines like poha and puffed rice using locally available raw material, establish market linkages and stabilise cash flow. As financial and managerial capacity improve, add snacks, instant products or branded lines. This approach reduces initial capital risk and allows the promoter to learn the production process before scaling. Many successful integrated plants in agriculture-intensive regions of India evolved this way.
What capacity utilisation should a new plant assume in Year 1 for its DPR?
Conservative and bank-credible DPRs typically assume 50–60% utilisation in Year 1, ramping to 75–85% by Years 3–4. Assuming 100% utilisation from the start is unrealistic and raises concerns during bank appraisal. Lower initial utilisation means higher per-unit fixed costs, so the projected break-even and DSCR must demonstrate viability even at reduced throughput. Sensitivity analysis should test scenarios at 10% below planned utilisation.
Do banks prefer commodity rice projects or integrated value-added rice projects?
Banks are primarily concerned with repayment capacity and risk, not with product type per se. A well-prepared integrated rice products DPR with realistic assumptions, clear marketing strategy, proper collateral and adequate promoter contribution can be favourably considered. Conversely, an overly optimistic plan – whether commodity or integrated – will face scrutiny. The quality of the financial projections, the promoter’s track record and the project’s DSCR under stress scenarios matter more than whether the plant produces only rice or a full range of value-added products.