Key Takeaways
- Rice mill ROI analysis, IRR, payback period and sensitivity analysis must be evaluated together; no single metric establishes project feasibility.
- Actual rice mill investment returns depend on paddy procurement cost (65-75% of operational costs), rice recovery percentage, capacity utilisation, working capital and debt structure, not just profit margin on paper.
- A bankable DPR must include rice mill IRR calculation, NPV, payback period calculation, DSCR and scenario-based sensitivity analysis to satisfy lenders.
- In my experience of preparing DPRs, even a profitable rice mill can face cash flow stress and weak DSCR if working capital, interest cost and repayment obligations are not realistically modelled.
- This article uses illustrative Indian-rupee examples (₹ lakh / ₹ crore) to explain how to calculate ROI, IRR, payback and run sensitivity analysis for a rice mill project.
Introduction: Why Ratios Beyond Simple Profit Percentage Matter
Rice milling is a high-volume, low-margin food processing business. Rice milling machines convert paddy into consumable rice, and milled white rice sales are the primary revenue source. A simple “profit margin” figure does not capture whether the initial investment is recovered in time, whether loan EMIs are comfortably serviced, or whether the project survives a bad paddy season.
Rice mill financial analysis uses complementary tools: Return on Investment (ROI) gauges investment efficiency, Internal Rate of Return (IRR) captures time value of money, Net Present Value (NPV) indicates whether a project adds value over time, payback period shows speed of capital recovery, and sensitivity analysis tests downside risk. Rice milling projects are sensitive to paddy procurement cost, rice recovery ratio, capacity utilisation, selling prices, by-product realisation (rice bran, husk, broken rice), electricity costs, working capital cycle and interest rates. A professional DPR for bank loan proposals must interpret these ratios together; the detailed project cost and financing structure of a rice mill forms the foundation for all such analysis.
Understanding Investment Returns in a Rice Mill Project
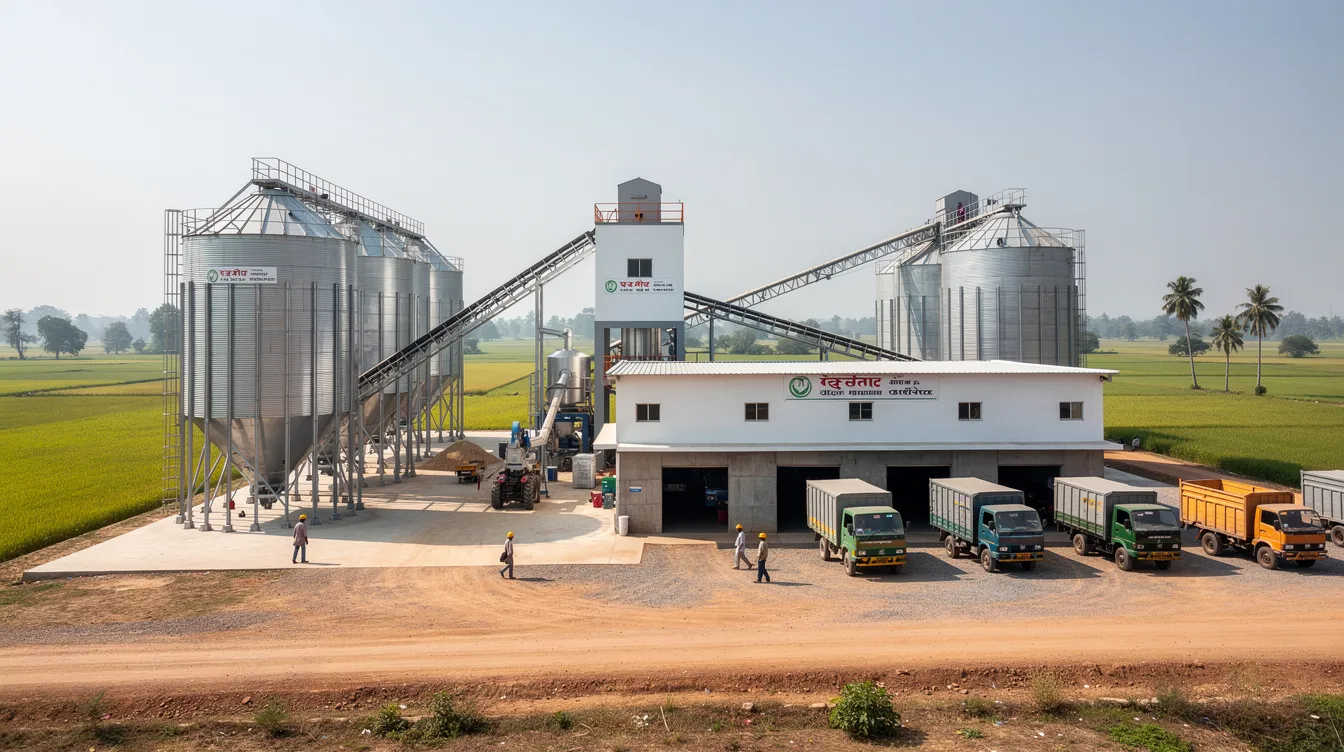
Rice mill investment feasibility starts from total project cost: land, building, machinery, paddy storage, utilities and pre-operative expenses. Initial investment for a rice mill varies by scale and technology. A medium scale 4 TPH plant may require ₹10-12 crore, split between promoter equity (30-40%), term loan and working capital limits. Annual sales are built from production capacity, operating days per year (which directly influence profit margins), capacity utilisation and selling prices of milled rice and by-products. Operating expenses must include costs for raw paddy, energy, labor and maintenance. Head rice prices range from $350-600 per tonne globally, while custom milling fees range from $15-40 per tonne processed.
EBITDA is not equal to project cash flow. Depreciation, loan principal repayment, tax and incremental working capital requirement for rice mill operations must all be deducted to arrive at true cash available. Working capital is critical for securing raw paddy and funding operations. A 4 TPH mill at ₹12 crore project cost with 70% utilisation can show book profit yet face tight monthly cash flows if repayment tenor is too short or paddy inventory holding exceeds working capital lines.
What is ROI in a Rice Mill Project?
To conduct an ROI analysis for a rice mill, calculate net profit as a percentage of total investment cost. The formula: ROI = (Annual Return / Total Investment) x 100. “Annual Return” can mean Profit After Tax (PAT) or Cash Profit (PAT + Depreciation), and the DPR should state the basis clearly. Net profit margins for rice mills range from 8% to 28% depending on scale, product mix and procurement efficiency. ROI is intuitive but does not capture timing of cash flows or inflation; that is where IRR and NPV come in. Gross and net profit margins reveal overall profitability relative to sales, but a bankable Rice Mill DPR Financial Analysis presents ROI alongside IRR, NPV, DSCR and break-even.
Illustrative Rice Mill ROI Calculation
All figures below are hypothetical and illustrative only.
| Item | ₹ Lakh |
|---|---|
| Total Project Cost | 1,050 |
| Promoter Equity | 350 |
| Term Loan | 700 |
| Annual Sales (rice + by-products) | 1,800 |
| Paddy Procurement Cost | 1,260 |
| Operating Costs (power, labor, repairs) | 250 |
| EBITDA | 290 |
| Depreciation | 65 |
| Interest | 77 |
| PBT | 148 |
| Tax (25%) | 37 |
| PAT | 111 |
| Cash Profit (PAT + Depreciation) | 176 |
Illustrative ROI on total project cost: 176 / 1,050 = 16.8%. ROI on promoter equity: 176 / 350 = 50.3%. Modern rice milling machines improve efficiency and reduce labor costs, directly improving these margins. Paddy procurement accounts for 65-75% of operational costs; a 5% increase in paddy price would compress EBITDA from ₹290 lakh to roughly ₹227 lakh, dropping ROI sharply. Fixed costs include labor, which is the highest expense, while variable costs include energy, parts and maintenance expenses.
What is IRR and NPV in a Rice Mill Project?
IRR (Internal Rate of Return) is the discount rate at which the NPV of all project cash flows becomes zero. IRR helps compare the profitability of investments and is more comprehensive than accounting ROI because it considers the entire cash flow pattern over 8-10 years. If a rice mill project IRR is, say, 22% against a borrowing cost of 10.5%, the project creates value. NPV at a 14% discount rate being positive confirms the same conclusion. Both metrics are core to any Rice Mill Feasibility Study & Project Viability assessment.
Project IRR vs Equity IRR in Rice Mill Investment Returns
Project IRR uses total project cost and pre-financing cash flows to judge overall attractiveness. Equity IRR uses only the promoter’s equity and post-debt-service cash flows, reflecting returns actually felt by owners. With moderate leverage, a 4 TPH plant might show Project IRR of 18-20% while Equity IRR reaches 22-25% (illustrative). Equity IRR can fall sharply if utilisation weakens or interest rates rise. A 500 TPD modern mill DPR showed Project IRR of 17.48% and Equity IRR of 24.72%, demonstrating how leverage amplifies returns.
IRR Calculation for a Rice Mill: Illustrative Cash Flow Schedule
Hypothetical example for understanding. All numbers in ₹ lakh.
| Year | CapEx | Net Cash Flow | Cumulative |
|---|---|---|---|
| 0 | -1,050 | -1,050 | -1,050 |
| 1 | – | 120 | -930 |
| 2 | – | 155 | -775 |
| 3 | – | 180 | -595 |
| 4 | – | 185 | -410 |
| 5 | – | 190 | -220 |
| 6 | – | 195 | -25 |
| 7 | – | 198 | 173 |
| 8 | – | 200 | 373 |
Capacity utilisation ramp-up (60% Year 1, 70% Year 2, 80% Year 3 onward) explains the increasing cash flows. Capacity utilization needs to be at least 70% to 80% for profitability. Equipment and capacity utilization rates affect operational efficiency and ROI. The IRR here is approximately 19-20% (computed via spreadsheet XIRR). These projections must be consistent with P&L and cash flow schedules in the Rice Mill Financial Projections for DPR. High-quality milling machines produce a higher percentage of whole grains, directly supporting these cash flows.
Payback Period of a Rice Mill Project
Payback period measures time to recover initial investment from net cash inflows. Simple formula for uniform flows: Payback Period = Initial Investment / Average Annual Net Cash Inflow. The break-even point is the volume of paddy processed to cover costs. Payback periods for rice mills typically range from 2.5 to 6 years. From the table above, cumulative cash flow turns positive between Year 6 and Year 7 (approximately 6 years and 2 months). The discounted payback period, applying a 12% discount rate, would be longer. A rice mill should monitor both financial and operational metrics monthly to track whether actual payback aligns with projections. Detailed Rice Mill Profitability & Break-Even Analysis helps verify projected volumes.
What is Sensitivity Analysis in a Rice Mill Project?
Sensitivity analysis tests how changes in key factors affect ROI, IRR, DSCR and payback. All rice mill financial projections rest on assumptions; sensitivity analysis reveals which assumptions matter most. In my experience of preparing rice mill DPRs, lenders increasingly require scenario tables showing impacts of changes in paddy procurement cost, milled rice selling price, capacity utilisation, rice recovery percentage and energy costs.
Key Variables for Rice Mill Sensitivity Analysis
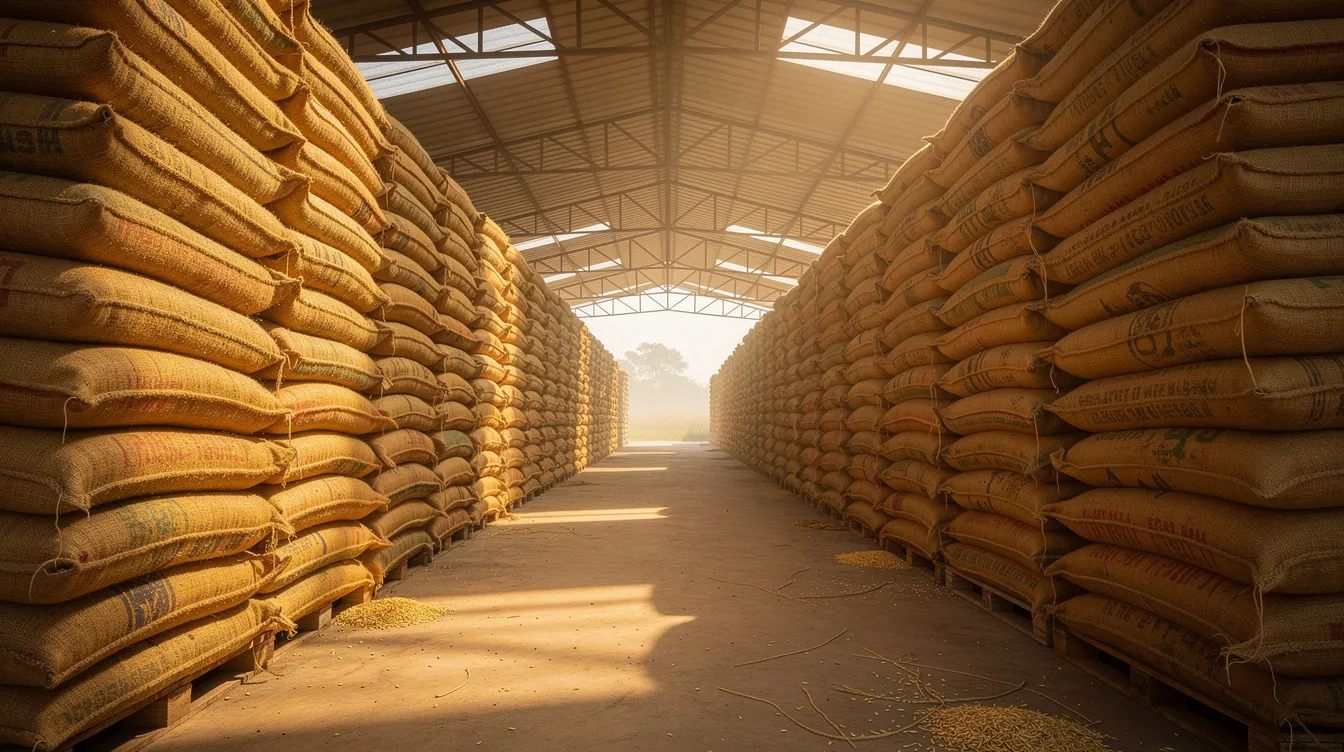
Paddy procurement cost normally accounts for 65-75% of total cost. Paddy procurement price affects operational costs directly; a $10/tonne reduction in paddy price saves $75,000 annually at 25 TPD capacity. Paddy market prices can influence financial outcomes for mills across seasons. Effective Paddy Procurement & Raw Material Planning for Rice Mill reduces this risk.
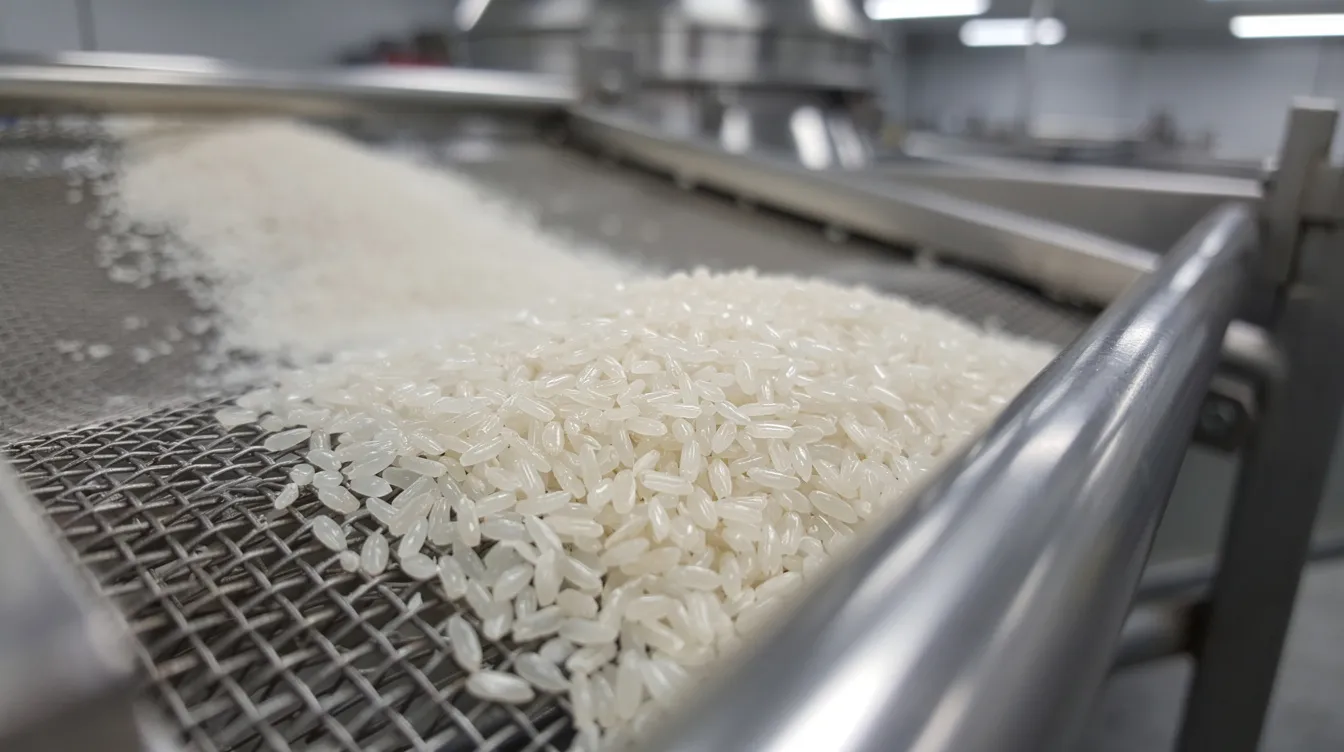
Milled rice selling price movements compress or expand margins. Higher head rice recovery rates increase market prices and revenue. Head rice yield impacts revenue; a 25 TPD mill can lose $220 daily from low head rice yield alone. The milling recovery rate typically ranges between 65% and 72%. Higher milling yields result in lower costs per unit and higher profits. Milling yield defines the amount of rice obtained from paddy as a percentage, and proper adherence to the Rice Milling Process Flow Chart & Production Process stabilises recovery.
By-product revenue can contribute 10-25% of total gross revenue. Estimate annual revenue from sales of head rice, broken rice and by-products. By-product sales contribute 15-25% of total gross revenue, and a 25 TPD rice mill can generate $204,900 from by-product sales yearly ($500-700 daily). Traditional rice milling machines are suitable for small-scale operations, while mobile rice milling units allow for on-site milling operations. The Rice Mill Revenue Model & Product Mix page covers product-mix modelling in detail.
Electricity costs and fuel are material for energy consumption in modern automated mills. Working capital cycle length affects equity cash flows and Equity IRR through interest cost on inventory and receivables. Interest rate increases of 1-2% raise finance cost, weakening DSCR & Loan Repayment Capacity for Rice Mill Project.
Rice Mill Sensitivity Analysis: Illustrative Scenario Table
Illustrative only. Base Case from earlier example.
| Scenario | EBITDA (₹L) | PAT (₹L) | Avg DSCR | Project IRR | Payback (Yrs) |
|---|---|---|---|---|---|
| Base Case | 290 | 111 | 1.85 | 19.5% | 6.1 |
| Paddy Cost +5% | 227 | 64 | 1.45 | 15.2% | 7.4 |
| Rice Price -5% | 200 | 43 | 1.30 | 13.1% | 8.0 |
| Utilisation -10% | 240 | 73 | 1.55 | 16.0% | 7.0 |
| Recovery -2% | 254 | 85 | 1.65 | 17.0% | 6.8 |
| Power/Fuel +10% | 275 | 101 | 1.78 | 18.7% | 6.3 |
| Interest +1.5% | 290 | 96 | 1.60 | 19.5% | 6.4 |
Paddy cost and rice selling price are the two variables that stress rice mill investment returns most. Such scenario tables are frequently attached to Bank Loan & Project Finance for Rice Mill Plant proposals.
Best Case, Base Case and Stress Case Modelling
| Parameter | Best Case | Base Case | Stress Case |
|---|---|---|---|
| Capacity Utilisation | 85% | 75% | 60% |
| EBITDA Margin | 18% | 16% | 11% |
| Project IRR | 24% | 19.5% | 12% |
| Avg DSCR | 2.40 | 1.85 | 1.15 |
| Payback (Yrs) | 4.5 | 6.1 | 8.5+ |
The Base Case must remain realistic, not deliberately optimistic. From a lender’s perspective, the Stress Case must show DSCR above 1.0 for the project to be considered financeable.
How Capacity Utilisation Affects Rice Mill ROI and IRR
Installed capacity (say, 4 TPH x 18 hours x 250 days = ~18,000 MT/year) sets the ceiling. At 50% utilisation, fixed cost per tonne is double that at full capacity, compressing EBITDA and extending payback. Rice production economics improve as throughput rises, spreading fixed costs. Appropriate Rice Mill Plant Capacity Planning & Production Capacity aligned with assured paddy availability prevents oversizing.
Effect of Paddy Price and Procurement Strategy on Investment Returns
Paddy procurement cost drives rice mill project economics. A ₹50/quintal saving across 30,000 MT/year adds ₹1.5 crore to gross margin annually (illustrative). Strategic planning around seasonal buying, adequate Paddy Storage, Warehouse & Silo Requirements for Rice Mill and moisture management can materially improve margins. However, over-aggressive stocking without sales visibility strains working capital and weakens Equity IRR. Small scale farmers benefit from rice mills that procure reliably, creating stable supply chains. Increase selling prices through rice quality improvements and branding rather than speculative paddy holding.
Impact of Product Mix and By-Products on Rice Mill Returns
A rice mill business profitable enough to attract investment must capture the full revenue model. Value added products (branded rice, rice flour) and by-products (bran, husk, broken rice) together can account for 15-25% of revenue. By-product revenue can reach approximately $205,000 per year for a 25 TPD milling plant. Securing stable buyers for bran (feed mills, extraction plants) and husk (biomass energy, brick kilns) reduces risk and improves rice mill financial performance. For small scale rice mills and large scale operations alike, by-product monetisation often makes the difference between marginal and comfortable EBITDA.
Impact of Debt Financing on Equity IRR and DSCR
When project operating returns exceed borrowing cost, financial leverage enhances Equity IRR. A rice mill with 70:30 debt-equity might show Equity IRR of 24% versus 18% at 50:50, but the higher-leverage structure also carries weaker DSCR and greater risk in stress scenarios. A Term Loan Assessment for Rice Milling Project should model both structures. High debt or short repayment tenor can produce weak DSCR even when accounting profitability looks adequate.
Relationship Between ROI, IRR, NPV, Payback, DSCR and Break-Even
| Metric | What It Measures | Typical User | Limitation |
|---|---|---|---|
| ROI | Investment efficiency | Promoter | Ignores time value |
| Project IRR | Overall project returns (time-adjusted) | Investor/Banker | Assumes reinvestment at IRR |
| Equity IRR | Promoter returns after debt | Promoter | Sensitive to leverage |
| NPV | Value creation at discount rate | Investor | Discount rate is subjective |
| Payback | Capital recovery speed | Promoter/Banker | Ignores post-payback flows |
| DSCR | Loan repayment capacity | Banker | Does not measure profitability |
| Break-Even | Minimum viable volume | All | Static, single-period |
No single metric establishes rice mill financial feasibility. From a lender’s perspective, DSCR and loan repayment capacity are often more critical than Equity IRR.
ROI and IRR in a Rice Mill DPR and Bank Finance Proposal
A bankable DPR includes projected P&L (7-10 years), balance sheet, cash flow statement, term-loan amortisation, working capital assessment, break-even analysis, ROI, IRR, NPV, payback and sensitivity analysis. All assumptions (paddy prices, rice prices, utilisation, recovery, tax rates) must be consistent across schedules. Banks primarily focus on DSCR, cash accrual and promoter contribution; a high IRR does not compensate for weak debt servicing capacity. Rice mill investment appraisal for project report preparation is covered on Bank Loan & Project Finance for Rice Mill Plant.
Common Mistakes in Rice Mill ROI, IRR and Payback Calculations
Assuming full capacity utilisation from Year 1 is the most frequent error; realistic ramp-up takes 2-3 years. Underestimating paddy cost relative to MSP and local market rates inflates projected margins. Overstating rice recovery percentages (using 70% when actual milling process delivers 65-66%) creates phantom revenue. Ignoring by-product revenue understates returns, while overstating it without buyer contracts creates the opposite problem. Using accounting profit instead of cash flow for IRR calculation, mixing Project IRR and Equity IRR, and not performing sensitivity analysis are structural errors that weaken any rice mill project evaluation. Initial investment costs must include interest during construction where applicable.
How to Improve the Financial Viability of a Rice Mill Project
Select appropriate plant capacity matched to paddy availability rather than aspirational throughput. Rice Mill Machinery & Equipment Cost choices directly affect recovery rates and energy consumption. Regular maintenance of milling equipment keeps recovery stable. Technology advances in energy efficient motors and husk-based boilers reduce electricity costs. Maximise by-product revenue through long-term contracts. Maintain balanced debt-equity ratios and choose repayment tenures keeping DSCR above 1.3. Managing the working capital cycle (inventory holding, receivable period) protects equity cash flows. An Integrated Rice Mill Plant Setup Cost in India analysis helps promoters size investment correctly. A rice mill business is a profitable venture when cost savings and higher efficiency are pursued systematically across procurement, processing and sales.
Rice Mill Investment Evaluation Checklist
- Total project cost (land, building, machinery, storage, utilities)
- Means of finance (equity, term loan, subsidy)
- Plant capacity and processing type (raw / parboiled / integrated)
- Capacity utilisation ramp-up and operating days
- Paddy availability and procurement price range
- Rice recovery % and by-product yields
- Product mix and market prices for rice and by-products
- EBITDA margin and contribution per tonne
- Working capital requirement and banking limits
- Projected DSCR, break-even quantity
- ROI, Project IRR, Equity IRR, NPV
- Simple and discounted payback period
- Sensitivity analysis (paddy cost, price, utilisation, recovery, interest)
Using this checklist alongside guidance from ProjectReportBank.com improves the quality of rice mill financial analysis and strengthens discussions with bankers and investors.
Frequently Asked Questions
What is a reasonable IRR for a rice mill project in India?
There is no fixed “correct” IRR. For MSME rice mills, a Project IRR meaningfully above the blended cost of capital (typically 12-15% considering term loan interest and expected equity return) is desirable. DPRs from actual Indian projects show IRR ranging from 17% to 28% depending on scale and leverage. Lenders focus more on DSCR and realistic assumptions than on a fixed IRR threshold. Any IRR in a DPR is an estimate, not a guaranteed return.
Can a rice mill have good ROI but poor DSCR?
Yes. ROI on total capital may look attractive while DSCR remains weak if debt levels are high, repayment is aggressive or working capital is under-financed. This is common in small scale operations with thin equity bases. Promoters should review ROI, Equity IRR, Project IRR and DSCR together to ensure both investor returns and loan repayment capacity are satisfactory under base and stress cases.
How often should rice mill financial projections and sensitivity analysis be updated?
While projections are prepared at the project-approval stage for 7-10 years, they should be revisited at least annually after commissioning. Compare actual paddy cost, selling price, utilisation and margins against the DPR. Updating sensitivity analysis each year reveals whether market shifts are temporary or structural, and whether adjustments in procurement, product mix or debt structure are needed to protect rice mill investment returns. Several factors change between DPR preparation and actual operations; regular maintenance of projections is as important as regular maintenance of machinery.
Do banks in India rely on IRR alone to sanction rice mill loans?
Banks and financial institutions focus primarily on DSCR, cash accrual, promoter contribution, project cost reasonableness, security and overall feasibility. IRR is useful context, not a sanction criterion. A DPR submitted for term loan assessment should emphasise realistic cash flow, DSCR profiles and sensitivity outcomes, with IRR and ROI included as part of balanced rice mill project evaluation. Required licenses, compliance and promoter track record also weigh in bank appraisals.
Conclusion
Evaluating a rice mill project purely on expected profit percentage or per-tonne margin is incomplete. A robust rice mill project investment analysis integrates ROI, Project IRR, Equity IRR, NPV, Payback Period, DSCR and sensitivity analysis. ROI captures investment efficiency. IRR reflects the time value of project cash flows across the project’s life. NPV indicates value creation at a chosen discount rate. Payback period shows capital recovery speed. DSCR measures loan repayment strength. Sensitivity analysis tests resilience when paddy prices, demand, rice prices and utilisation move against projections.
A professionally prepared Rice Mill DPR, aligned with realistic technical, operating and market assumptions, helps promoters, investors and lenders make informed decisions. The resources and analytical frameworks on ProjectReportBank.com support this process. CA Manish Gugliya specialises in preparing DPRs, CMA Data and project finance documentation for MSME and industrial projects; while such analysis strengthens proposals and decision-making, it does not constitute a guarantee of loan approval or future profitability.