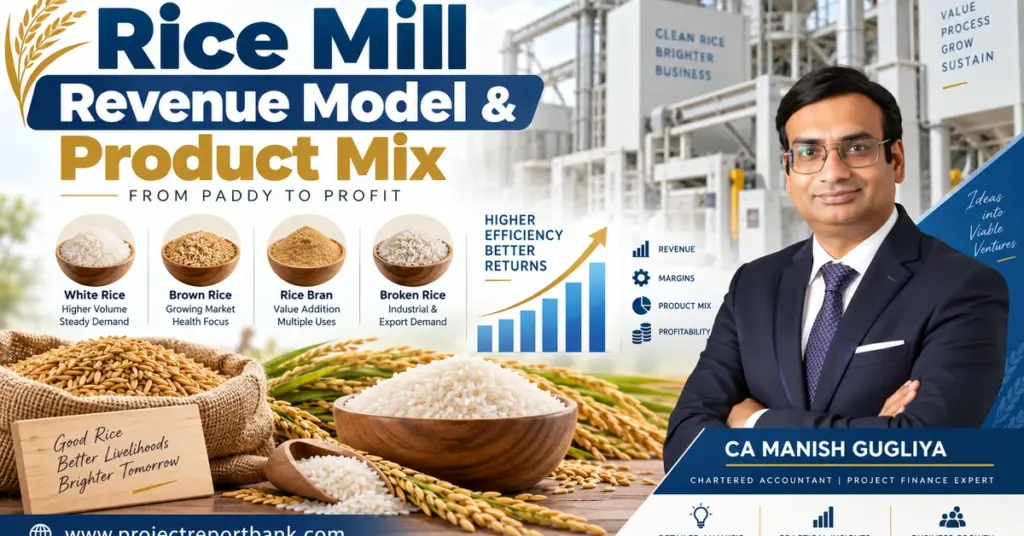
Key Takeaways
- Total rice mill revenue comes from head rice, broken rice, rice bran, rice husk and any value-added or branded products – not just milled rice alone. By-product revenue can contribute 10–25% of total gross revenue.
- Recovery percentages, product mix (raw, parboiled, basmati, non-basmati) and capacity utilisation are the key factors determining rice mill profitability and revenue per tonne of paddy processed.
- In a professionally prepared rice mill DPR, revenue must be calculated product-wise based on paddy procurement volume, milling recovery, selling prices and operating days – never using a single average selling price.
- Proper rice mill revenue analysis is critical for bank finance appraisal, DSCR, IRR and working capital assessment in medium scale and large scale operations across India.
- CA Manish Gugliya and ProjectReportBank.com assist promoters in building realistic rice mill financial projections and revenue models aligned with ground realities and lender expectations.
Introduction: How a Rice Mill Actually Earns Money
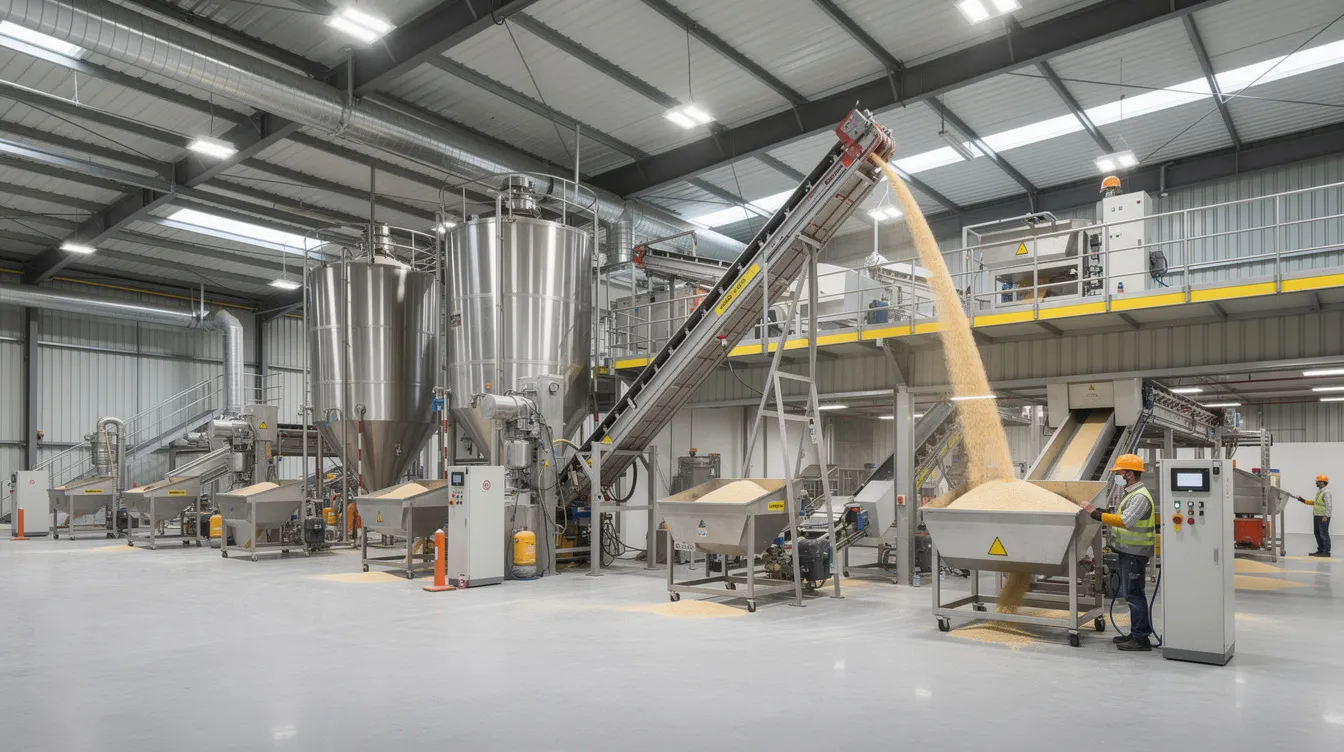
A rice mill is fundamentally a conversion business in India. It purchases paddy as raw material and converts it into multiple finished products and by-products. Rice mills operate on a multi-tiered revenue framework that goes well beyond simply husking paddy – they generate income by processing raw paddy into polished rice, broken rice, rice bran and rice husk, each sold through distinct market channels.
For a 4–5 TPH medium scale unit or an 8–12 TPH large scale plant, even a 1–2% improvement in recovery can shift annual turnover by several crores. Milling recovery directly dictates top-line returns, which is why product mix and recovery percentages must be carefully modelled in every rice mill business plan.
In my practice as a Chartered Accountant preparing rice mill DPRs, CMA data and project reports for bank loans, I consistently find that promoters who understand the link between paddy procurement, production capacity, product mix and selling prices build more bankable and profitable ventures than those who focus only on installed capacity.
What Is the Revenue Model of a Rice Mill?
The rice mill revenue model is the structured framework through which a rice mill converts paddy throughput into product-wise sales revenue over a year. The core formula is straightforward:
Total Rice Mill Revenue = Revenue from Head Rice + Broken Rice Revenue + Rice Bran Revenue + Rice Husk Revenue + Other By-Product or Value-Added Revenue
For realistic rice mill revenue calculation in India, projections must incorporate:
- Annual paddy processed (in MT)
- Recovery percentages for each output
- Product-wise selling prices
- Capacity utilisation (realistic ramp-up, not 100%)
- Number of operating days (typically 270–300 days)
A professional rice mill project report estimates quantity and revenue for each product separately. This product-wise model forms the base for rice mill annual turnover estimation, revenue per tonne calculations and sales projections submitted to banks.
Major Revenue Streams in a Rice Mill
A well-planned rice mill business model monetises all key outputs. In my DPR work, a rice mill’s by-product revenue can contribute 10–20% of total income in medium scale mills and large scale operations. By-product monetization can genuinely make the difference between profit and loss in milling. Below, each revenue stream is covered with its typical recovery behaviour and market relevance.
Revenue from Head Rice
Head rice – full-length, unbroken grains – is the primary revenue source. Head rice sales represent the largest volume and highest-value output, typically forming 58–66% of paddy weight in well-configured plants. Higher head rice recovery yields premium pricing for rice mills.
Revenue depends on variety (basmati vs non-basmati), grain length, polish level, broken percentage and whether the rice is sold as bulk rice or through a branded rice business model. Common segments include raw rice production, parboiled rice production, basmati rice production and non-basmati rice production, each with distinct realisations, customer profiles and target market characteristics.
Revenue from Broken Rice
Broken rice is a planned output, not waste, typically 2–12% of paddy depending on paddy quality, variety and machinery. Broken rice is sold at a discount to various industries including breweries, pet food manufacturers, rice flour units, cattle and animal feed processors and bulk food processing buyers.
- Broken rice selling price is usually 40–70% of head rice price depending on grade and region
- Current mandi averages hover around ₹2,024 per quintal
- Ignoring broken rice revenue understates rice mill income calculation by 5–10%
Revenue from Rice Bran
Rice bran is the nutrient-rich brownish outer layer removed during whitening, usually 7–12% of paddy weight. It serves as a key raw material for rice bran oil extraction and animal feed industries. Bran is sold to solvent extraction plants, feed manufacturers or integrated oil units.
Accurate bran recovery and rice bran sale income assumptions are important for the rice mill projected profit and loss. Moisture content, de-oiling value and cleanliness influence bran realisation – these must be captured in rice mill selling price analysis, not clubbed into generic “other income.”
Revenue from Rice Husk
Rice husk accounts for roughly 20% of the grain’s weight. It is used as boiler fuel, biomass, briquettes and for power generation in integrated rice mill plants. Rice husk revenue arises either through direct sale or through cost savings when husk displaces purchased coal or other fuels internally.
A DPR should treat husk value either as rice husk sale income or as a reduction in the fuel cost line – consistently, never double-counting. This by-product utilisation planning can materially affect rice mill cash flow and DSCR where electricity costs and fuel form a large cost component.
Other By-Product and Value-Added Revenue
Additional outputs may include rice polish, minor screenings, rice flour and branded processed products. Some integrated rice mills in India also earn from custom milling fees – typically ranging from $15–40 per tonne of paddy processed – or from rental income by storing paddy for third-party traders. By-product revenue can reach approximately $205,000 per year in well-run facilities. In a professionally prepared DPR, ancillary income should appear in separate revenue lines to keep the core rice mill revenue analysis transparent.
Understanding Rice Mill Product Mix
Rice mill product mix refers to the combination of all finished products and by-products the plant produces and sells: raw rice, parboiled, basmati, non-basmati, broken rice, bran, husk, plus bulk and packaged formats. Product mix planning directly affects rice mill revenue per tonne, contribution margin and working capital cycle.
Factors influencing product mix include local paddy availability, target market (domestic vs export), installed machinery, processing technology, promoter marketing strategy and working capital capacity. A medium scale unit in Eastern India may focus on parboiled non-basmati bulk sales, while a basmati-focused unit in Haryana may target premium rice and packaged products. Initial investment for small rice mills ranges from ₹10 to ₹25 lakhs, scaling upward for medium scale mills and large scale operations.
Raw Rice vs Parboiled Rice: Revenue and Product Mix Considerations
Raw rice production and parboiled rice production differ in process flow, recovery behaviour, capex and market demand. Parboiling adds boilers, steaming equipment and energy costs but can improve head rice recovery and reduce broken percentage for certain varieties, impacting rice mill profit margin positively.
Consumer preference for raw vs parboiled varies across India – Eastern and Southern states lean toward parboiled, while Northern markets prefer raw. A DPR should run alternate scenarios comparing revenue per tonne and EBITDA margin under each product mix. There is no universal answer on which is more profitable; economics depend on paddy type, fuel cost, local demand and parboiling technology efficiency.
Basmati vs Non-Basmati Product Mix Planning
Basmati projects follow a fundamentally different rice mill business model. Basmati paddy procurement costs can be 2–3 times non-basmati, and aging stock may be held 6–12 months, stretching working capital significantly. Basmati rice production involves a premium rice product mix with better margins per kg, stronger branding and a packaged rice business focus – but lower inventory turnover and higher marketing costs.
Non-basmati operations are volume-driven with bulk rice sales, shorter inventory cycles, lower per-kg margins and simpler packaging. From a project finance perspective, banks scrutinise basmati projects’ cash flow and DSCR carefully due to the long working capital cycle. Rice mill financial projections must capture this distinction clearly.
Bulk Rice vs Branded Packaged Rice Revenue Models
The same production can be sold as bulk/loose rice or as branded consumer packs – each with different revenue and cost structures.
Bulk / Commodity Sales Model
Most output is sold in 25–50 kg bags to wholesalers, traders and institutional buyers. Key characteristics: lower packaging cost, lower selling price per kg, minimal marketing spend, but dependence on market prices and price-sensitive buyers. This suits mills focused on high production volume, stable cash flow and lower complexity.
Branded Packaged Rice Model
Branded models sell smaller packs (1–10 kg) under a brand. Though selling price per kg may be 15–40% higher, additional costs include packaging, distributor margins, advertising and higher working capital. Sustainable practices in rice milling can unlock premium markets and procurement incentives in this segment. A DPR should never assume higher MRP automatically means higher rice mill net profit – contribution per kg must be calculated after all expenses. Many integrated mills use a hybrid rice mill product portfolio, selling majority in bulk while growing branded share for better margins.
Rice Recovery and Its Impact on Revenue
Milling recovery – the distribution of paddy into head rice, broken rice, bran, husk and losses – forms the basis of rice mill production and sales analysis. According to IRRI and FAO data, milling typically converts roughly 65–70% of paddy into milled rice. Processing 300 tons of paddy yields about 195 tons of milled rice under standard conditions.
Illustrative split per 1,000 kg paddy (modern non-basmati mill):
| Output | Indicative % | Quantity (kg) |
|---|---|---|
| Head Rice | 65% | 650 |
| Broken Rice | 3% | 30 |
| Rice Bran | 7% | 70 |
| Rice Husk | 22% | 220 |
| Losses | 3% | 30 |
Moisture levels and impurity rates affect the final output quality and acquisition cost. Operational efficiency heavily influences profitability – even a 1% recovery improvement across 30,000 MT/year can add crores to annual revenue. Quality and rejection losses can significantly decrease revenue if not managed.
Product-Wise Revenue Calculation: An Illustrative Example
Consider a medium scale rice mill plant processing 30,000 MT paddy annually (illustrative only):
| Product | Recovery | Quantity (MT) | Price (₹/MT) | Revenue (₹ Lakhs) |
|---|---|---|---|---|
| Head Rice | 65% | 19,500 | 35,000 | 6,825 |
| Broken Rice | 3% | 900 | 20,000 | 180 |
| Rice Bran | 7% | 2,100 | 18,000 | 378 |
| Rice Husk | 22% | 6,600 | 3,000 | 198 |
| Total Revenue | 7,581 |
Revenue per tonne of paddy = ₹7,581 lakhs ÷ 30,000 = approximately ₹25,270 per tonne. Research on Indian rice mills confirms gross returns of ₹2,088 per quintal in modern units versus ₹1,846 in conventional setups. All assumptions in real DPRs must reflect local market data – not generic industry numbers.
Installed Capacity, Capacity Utilisation and Revenue
Installed capacity only indicates maximum technical output. Actual revenue depends on realistic capacity utilisation and operating days. Typical DPR patterns: Year 1 at 50–60%, Year 2 at 65–75%, Year 3+ at 80–90%. A 25 TPD rice mill can achieve payback in 2.8 years with disciplined ramp-up, while a well-run rice mill can achieve a payback period of 2.5–4 years depending on scale.
Mills can improve profitability by increasing capacity utilization without proportionately increasing fixed costs. Assuming 100% utilisation from Year 1 is a common mistake in rice mill revenue projection for bank loan proposals. For detailed guidance, refer to Rice Mill Plant Capacity Planning & Production Capacity.
Seasonal Paddy Procurement, Storage and Revenue Implications
Paddy procurement in India is seasonal (kharif and rabi), but milling is planned for 10–12 months, creating inventory build-up needs. Procurement strategy – buying during harvest versus staggered purchases – affects raw material cost and rice mill profit margins. A $10/tonne improvement in paddy price can save $75,000 annually at scale. Detailed procurement models are covered in Paddy Procurement & Raw Material Planning for Rice Mill.
Adequate warehouse and silo capacity allows mills to buy paddy at favourable harvest prices and operate longer. For storage design considerations, see Paddy Storage, Warehouse & Silo Requirements for Rice Mill.
Process, Machinery and Layout: How They Influence Revenue Realisation
Process configuration – cleaning, destoning, dehusking, whitening, polishing, grading, colour sorters and packaging – directly affects rice yield, rice quality, reduced wastage and revenue. Modern machinery with higher efficiency can lower broken percentage and improve head rice recovery. Rice mill machinery costs can range from ₹2–3 lakhs for semi automatic machines in small scale mills to crores for fully automatic large scale setups. Understanding the Rice Milling Process Flow Chart & Production Process helps promoters connect process choices with product mix and recovery outcomes. Equipment investment details are covered in Rice Mill Machinery & Equipment Cost. Plant layout affecting material flow and storage losses is addressed in Rice Mill Land, Building & Plant Layout Requirements.
Selling Price Estimation and Revenue Projections in a Rice Mill DPR
Selling prices must be based on current market analysis, historical trends and realistic assumptions – not inflated to show higher IRR. Key factors: variety, grading, packaging, wholesale vs retail, institutional contracts and regional variations. Annual escalation of 3–5% may be used where justified, but banks question aggressive escalation without support.
Sample 5-Year Revenue Projection Structure (Illustrative):
| Particulars | Year 1 | Year 2 | Year 3 | Year 4 | Year 5 |
|---|---|---|---|---|---|
| Paddy Processed (MT) | 22,500 | 27,000 | 33,000 | 36,000 | 36,000 |
| Head Rice Sales (₹ L) | 5,119 | 6,320 | 7,936 | 8,883 | 9,327 |
| Broken Rice Sales (₹ L) | 135 | 167 | 215 | 247 | 259 |
| Bran Sales (₹ L) | 284 | 350 | 440 | 504 | 529 |
| Husk Sales (₹ L) | 149 | 178 | 218 | 237 | 249 |
| Total Revenue (₹ L) | 5,687 | 7,015 | 8,809 | 9,871 | 10,364 |
Variable costs scale directly with the volume of paddy processed, while fixed costs including labour remain relatively stable.
From Revenue to Profit: Cost Structure and Contribution Analysis
High rice mill annual turnover does not guarantee strong net profit. Paddy procurement typically accounts for 65–75% of operational costs – this is the single largest expense in any rice mill business in India. Other key costs include labour (the highest fixed cost), power, fuel, packaging, transportation, repairs, administrative salaries and finance cost. Electricity and fuel costs consume a major chunk of operational expenses.
Net profit margins for rice mills generally range from 8% to 15%. Well-run rice mills with strategic planning, premium rice focus and efficient operations can achieve margins of 18% to 28% – substantially above industry average. Contribution margin analysis by product (premium rice, standard rice, broken rice, bran) helps determine the optimal product mix. Rice mill break even analysis should consider both fixed and variable expenses alongside IRR, NPV and DSCR in a complete rice mill feasibility report. Several factors including procurement costs, processing capacity and marketing strategy influence long term profitability.
Working Capital and Cash Flow Impact of the Revenue Model
A rice mill revenue model is incomplete without analysing working capital for paddy stock, finished rice inventory, by-products, packaging material and receivables from customers. Basmati and branded packaged rice models require substantially higher working capital due to longer holding periods. Rice mill CMA data for bank limits should align with planned revenue and capacity utilisation. For understanding how term loan and working capital must match overall project cost, see Rice Mill Project Cost & Means of Finance.
Risk, Sensitivity and Bank Appraisal of Rice Mill Revenue Models
Lenders focus on risks affecting revenue: paddy price volatility, lower recovery, fewer operating days, market competition and selling price changes. A robust DPR includes sensitivity analysis testing higher raw material cost, lower selling prices, reduced recovery and lower capacity utilisation against EBITDA, cash accrual and DSCR.
Banks examine installed capacity, utilisation ramp-up, paddy availability, product-wise recovery, market linkages, working capital adequacy and projected cash flows. Internally consistent assumptions – for example, paddy quality versus expected selling prices – are critical for credible bank finance proposals. Promoters should study resources like Integrated Rice Mill Plant Setup Cost in India and obtain all necessary licenses and required licenses before approaching lenders. Government policy changes can also impact viability assumptions.
How CA Manish Gugliya and ProjectReportBank.com Can Assist
CA Manish Gugliya assists entrepreneurs with preparation of rice mill DPRs, bank finance DPRs, CMA data, financial projections, project cost estimation, means of finance structuring, DSCR analysis, break-even analysis and sensitivity modelling. The role is to prepare, analyse and advise – not to guarantee profits or assured bank sanction.
ProjectReportBank.com hosts detailed articles on capacity planning, machinery selection, storage, land and building requirements and setup cost estimation. Serious entrepreneurs and consultants planning medium to large scale rice milling projects should seek professional support when preparing rice mill revenue projections and business plans. The milling business demands strategic planning backed by accurate financial information.
Frequently Asked Questions
These FAQs address practical questions rice mill promoters in India frequently raise about the rice mill revenue model, product mix and profitability.
How does a rice mill earn money in practical terms?
A rice mill earns by purchasing paddy, processing it and selling multiple outputs: head rice (the primary and highest-value product), broken rice, rice bran and rice husk. Additional income may come from custom milling fees, storage rental income for third-party farmers, or branded and packaged rice products. Milled white rice is the primary revenue stream, but by-product sales contribute 15–25% of total gross revenue in well-managed operations. India depends heavily on rice as a staple food, ensuring consistent market demand.
What is revenue per tonne of paddy and why is it important?
Revenue per tonne equals total sales realisation divided by total paddy processed. It is a critical metric for comparing product mix options, evaluating milling efficiency and conducting sensitivity analysis during rice mill financial projections. This metric helps promoters understand whether a profitable business is achievable at their planned scale of operations and whether the initial investment delivers adequate returns within the target payback period.
Is broken rice really an important revenue source?
Yes. Broken rice production contributes meaningfully to total revenue with steady demand from feed industries, food processing units, breweries and flour manufacturers. Ignoring it can understate total revenue by 5–10%. At current market prices averaging around ₹2,024 per quintal, even a small rice mill generating 2–3% broken rice from its throughput can add several lakhs annually to its total revenue.
Which is usually more profitable: raw rice or parboiled rice?
Neither is automatically more profitable. Profitability depends on local consumer preferences, paddy type, fuel and power costs, selling prices and plant efficiency. Parboiled rice often shows better rice yield with lower broken percentage but requires higher energy investment. Each project should evaluate both models using traditional methods and modern machinery comparisons before finalising its product mix.
Why should I get professional help for my rice mill revenue projections?
Rice mill revenue analysis involves multiple interlinked assumptions – paddy procurement price, recovery percentages, product mix, selling prices, operating days and working capital. Professionally prepared DPRs and CMA data improve credibility with banks and investors, reduce the risk of overestimating profitability and ensure the project stands up to rigorous market analysis and bank appraisal. This is especially important for larger integrated projects where the investment runs into crores and better margins depend on getting every assumption right.