Key Takeaways
Realistic rice mill financial projections for DPR originate from plant capacity and technical assumptions – not from arbitrary percentage growth rates pasted into spreadsheets. Every assumption, from paddy procurement volumes to recovery percentages, must flow logically from the installed milling capacity, operating hours and capacity utilisation schedule specific to the proposed project.
- A bankable rice mill project report DPR must integrate production capacity, paddy procurement, recovery ratios, operating costs, project cost, term loan, working capital and DSCR into one coherent rice mill financial model.
- I, CA Manish Gugliya, prepare rice mill financial projections for DPR, CMA data and bank loan proposals based on practical project-finance experience across India.
- All figures and ratios in this article are illustrative examples only. Actual rice mill financial feasibility depends on location, capacity, product mix, finance terms and market conditions.
- Financial projections should cover at least three years, and most lenders require five to ten years for term loan assessment.
- The financial health of a rice mill business is intricately tied to its capacity utilization and recovery rates – getting these assumptions wrong can render the entire DPR unreliable.
Introduction to Rice Mill Financial Projections for DPR
Financial projections in a rice mill project report DPR are not decorative appendices. They are the projected profit and loss statement, projected balance sheet and rice mill cash flow projection prepared over five to eight years that demonstrate whether the project can generate adequate returns and repay its debt obligations.
The global rice market was valued at USD 316.58 billion in 2025 and is expected to reach USD 384.74 billion by 2034, with the rice processing industry growing at a CAGR of 2.2% from 2026 to 2034. A well-structured business plan is crucial for success in rice milling, and a feasibility study that assesses market demand and operational costs forms the foundation before any financial analysis begins. A rice milling business plan should include market analysis to understand the competitive landscape and future demand.
There is a critical distinction between technical feasibility – plant capacity, machinery, layout, the rice milling process – and financial feasibility covering profitability, cash flow, DSCR, ROI, IRR and payback. Banks and investors demand detailed rice mill financial projections for DPR because they need to verify whether the project can service debt, sustain working capital and deliver returns over the loan tenor. Every assumption must be technically linked, not guessed.
Financial Projections Start from Plant Capacity and Technical Parameters
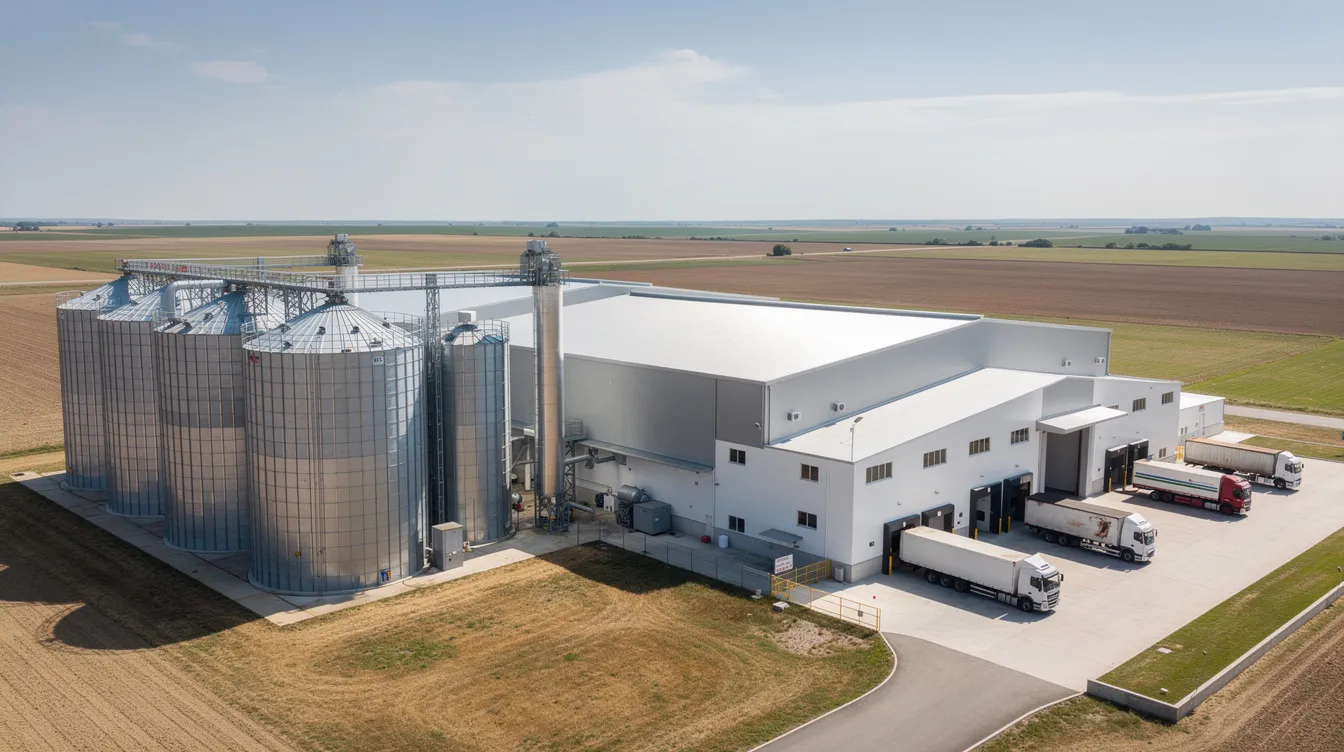
Every realistic rice mill financial projection format for bank loan must begin from technical capacity. The starting point is installed milling capacity in tonnes per hour (TPH), working hours per day (typically 16–20 hours), working days per year (280–330 days) and projected capacity utilisation.
Annual Paddy Processing (MT) = Rated Capacity (TPH) × Operating Hours per Day × Working Days per Year × Capacity Utilisation % ÷ 100
For example, a 5 TPH rice mill running 18 hours per day, 300 working days at 60% utilisation processes approximately 16,200 MT of paddy annually. Rice processing plants can achieve economies of scale with capacities ranging from 50,000 to 100,000 MT, and larger integrated plants in India fall within this range. Capacity utilisation typically starts lower in Year 1 and scales up over several years – the ramp-up depends on market demand, procurement network and management strength. For a detailed understanding of how to arrive at these numbers, refer to rice mill plant capacity planning and production capacity guidelines.
Production, Recovery and Yield Assumptions
Rice mill revenue projection and profitability projection are highly sensitive to recovery and yield percentages. The standard milling recovery rate is approximately 65% to 70% white rice from raw paddy, meaning every 100 kg of raw paddy yields approximately 65–70 kg of finished rice. Modern processing techniques reduce post-harvest losses significantly compared to older Engelberg hullers.
Main outputs from paddy milling include:
- Head rice (premium whole kernels)
- Broken rice
- Rice bran (used for rice bran oil and animal feed)
- Husk (used for fuel, power generation)
Even a 1–2% improvement in head rice recovery on annual input of 60,000 MT can add hundreds of tonnes of premium polished rice, materially changing profit and DSCR. Key considerations for financial projections include capital expenditure and recovery rate – both directly shape the rice mill financial model. Understanding the rice milling process flow chart and production process steps helps trace where technical recoveries originate.
Paddy Procurement and Raw Material Cost Projections
Paddy rice accounts for 80–85% of operating expenses in a rice mill, making it the single most critical assumption in rice mill expense projection and financial feasibility. Annual paddy requirement is derived from planned production quantities and recovery ratios, then translated into monthly procurement plans aligned with Kharif and Rabi crop seasons.
Key procurement assumptions include:
- Purchase price (market price or MSP where relevant)
- Procurement channels – building reliable relationships with local farmers can secure better procurement prices for paddy
- Transportation, handling, commission and quality grading costs
- Incoming moisture content and procurement losses
- Annual paddy price escalation (3–10% depending on region and inflation)
Paddy procurement forms a large part of ongoing operational expenditures. Underestimating paddy prices merely to show higher margins is a common mistake that experienced credit officers immediately identify. For structured planning, review paddy procurement and raw material planning for a rice mill.
Paddy Storage, Inventory and Working Capital Implications
Seasonal procurement often requires stocking paddy for three to six months, directly impacting rice mill working capital projection and interest cost. Working capital is critical in rice milling due to the need to purchase bulk raw paddy well ahead of processing.
Practical assumptions must cover warehouse or silo capacity, average inventory holding period, storage losses, fumigation, insurance and security expenses. Higher paddy inventory raises current assets, increases working capital borrowing and consequently increases interest in the cash flow projection and DSCR calculation. Seasonal procurement is crucial to secure enough working capital for rice milling operations. Inventory days for paddy, finished goods and by-products should reflect local procurement patterns rather than being copied from another project. Review paddy storage, warehouse and silo planning for a rice mill for detailed guidance.
Projected Revenue and Product-Wise Sales Projections
Rice mill revenue projection should be product-wise rather than a single consolidated number. Revenue from by-products like bran and husk significantly contributes to profitability in rice mills and should never be ignored. Urban populations are increasing demand for packaged rice products, and processed rice exports are supported by improvements in milling technology.
Revenue for each product = Quantity Sold (MT) × Average Realisation (₹/MT)
Key revenue lines include premium long grain rice, brown rice, regular rice, broken rice, rice bran, and husk. Assumptions on product mix, domestic versus institutional sales, packing sizes, credit terms and annual selling price escalation must remain commercially reasonable and consistent with rice market growth trends. For deeper planning, refer to the rice mill revenue model and optimal product mix.
Operating Cost, Power and Efficiency Assumptions
After raw materials, the rice mill expense projection covers power, fuel, labour, salaries, packaging machines and packing material, repairs, consumables, transport, quality assurance costs, administration and selling overheads. Operating costs are primarily driven by raw material consumption, but electricity and labor constitute a substantial portion of operational costs. Utility costs are a significant part of operational expenses in rice milling.
Essential equipment includes huskers, polishers and graders, while larger mills require sophisticated machinery like paddy separators and color sorters. Machinery selection – automatic versus semi-automatic, type of dryer, presence of a parboiling unit – directly affects power consumption, labour required and recovery percentages. A realistic rice mill financial model should use actual quotations and power ratings from shortlisted rice mill machinery and equipment in India. Annual escalation percentages should be applied to major expense headings to reflect inflation and wage growth across the projection period.
Land, Building, Layout and Project Cost Structure
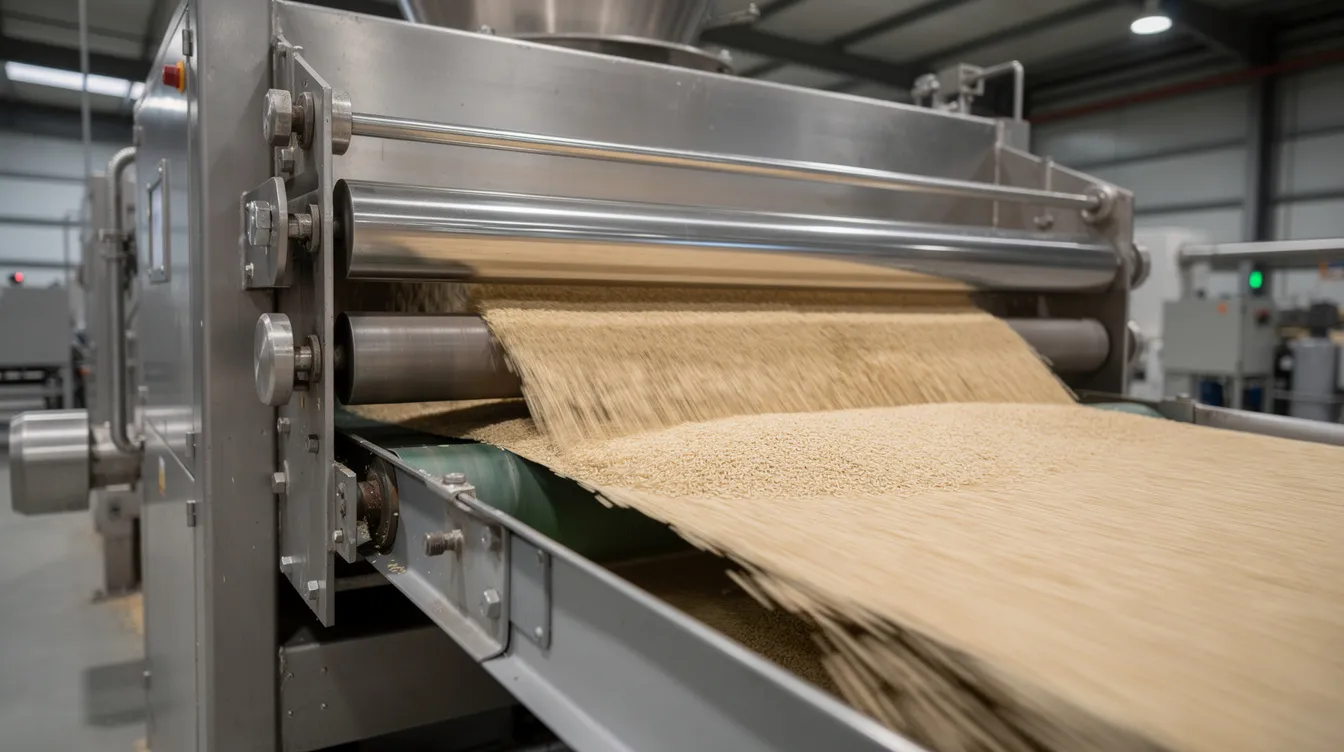
Land, building and plant layout decisions influence not only civil cost but also material handling efficiency, internal logistics and future expansion potential of the rice mill business. Major capital expenditure heads include land, site development, main mill building, paddy storage godowns or silos, finished goods warehouse, administrative block, weighbridge and effluent treatment plant.
Accurate layout planning feeds directly into rice mill project cost and financial projections through depreciation and interest during construction. Review the rice mill land, building and plant layout requirements for detailed planning. Integrated plants with parboiling, packaging and power generation typically require higher CapEx – for such projects, cross-reference the integrated rice mill plant setup cost in India.
Total Project Cost, Means of Finance and Capital Structure
Every rice mill project report financial projection must tie back to a clearly defined project cost and means of finance statement. A rice mill typically requires high upfront investment for machinery and storage. Government support programs can provide significant financial assistance – notably, 92,393 projects received funding under India’s Agriculture Infrastructure Fund.
Typical project cost components include land, buildings, plant and machinery, electrical works, utilities, preliminary and pre-operative expenses, contingencies, interest during construction and margin money for working capital. For medium-to-large integrated mills in India, total capital investment can range from ₹18 crore to ₹45 crore including fixed assets and initial working capital.
Means of finance typically comprise:
- Promoter’s equity (20–30%)
- Term loan from banks (70–80%)
- Subsidies or grants where applicable
The rice mill term loan projection should align with eligible debt as per bank norms. For a detailed breakdown, see rice mill project cost and means of finance structure.
Projected Profit and Loss Statement for Rice Mill
The rice mill profit and loss projection summarises yearly performance over at least five projection years. A practical financial projection for a rice mill should include capital expenditures and operational costs mapped clearly.
| Line Item | Description |
|---|---|
| Revenue | Product-wise sales of rice, broken rice, bran, husk |
| Raw Material | Paddy consumption cost |
| Manufacturing Expenses | Power, fuel, packing, labour, repairs |
| Overheads | Admin, selling, quality control expenses |
| EBITDA | Revenue minus all operating costs |
| Depreciation | Non-cash charge on fixed assets |
| Interest | On term loan and working capital |
| PBT / PAT | Profit before and after tax |
| Cash Accrual | PAT + Depreciation |
Gross profit margins for rice mills typically range from 15–25%, while gross margins in rice milling can range from 10% to 25% depending on scale and efficiency. Net profit margins in commercial rice mills generally range from 5% to 12%. Cash accrual (PAT + depreciation) is more relevant than PAT alone for assessing rice mill loan repayment capacity. In my professional experience, banks focus on the trend of EBITDA margin and cash accrual when testing rice mill project viability.
Depreciation Projection and Its Impact
Rice mill depreciation calculation reduces accounting profit without involving cash outflow, affecting profitability ratios and tax without directly reducing cash accrual. Major asset groups – buildings, plant and machinery, electrical installations, furniture and vehicles – each carry different useful life and depreciation rates under the Income Tax Act or Companies Act.
Higher depreciation in initial years lowers profit before tax but can reduce tax liability, improving project cash flow and DSCR in early years. The DPR should clearly state whether straight-line or written-down value method is used, consistent with lender expectations.
Term Loan, Interest and Loan Repayment Schedule
Accurate rice mill term loan projection and loan repayment projection are central to assessing DSCR and financial viability. A typical structure involves a moratorium period of 6–12 months, repayment tenor of 7–9 years and interest linked to current bank lending rates.
Interest is computed on the opening outstanding balance and reduces every year as principal is repaid. This schedule must feed into projected interest expense in the P&L, term loan balances in the projected balance sheet and debt servicing in the rice mill cash flow statement for bank finance.
Working Capital Projection and Operating Cycle
Working capital is often underestimated in rice mill business plans. Current assets include paddy inventory, finished rice stocks, by-product inventory, trade receivables and minimum cash balances. Current liabilities include trade creditors, wages payable and statutory dues.
Working Capital Requirement = Total Current Assets – Total Current Liabilities (excluding bank borrowing)
Part of this requirement is funded by promoter margin and the balance by working capital limits such as cash credit or packing credit facilities from banks. Using a blanket percentage of turnover misrepresents the rice mill working capital projection – assumptions should reflect actual stocking and credit policies for the specific project and its business requirements.
Projected Balance Sheet and Cash Flow Statement
The rice mill projected balance sheet brings together net fixed assets, inventories, receivables, cash, term loans, working capital borrowings, equity and reserves for each projected year – and must always tally. The rice mill projected cash flow statement separates cash from operations, investing activities (CapEx) and financing activities (loan disbursement, repayment, interest, equity infusion).
A project can show accounting profit but negative cash flow in certain years due to loan repayments or high inventory build-up. Banks closely analyse this before sanctioning a rice mill DPR for bank loan.
Capacity Utilisation Ramp-Up and Multi-Year Projections
Rice mill financial projections for DPR should recognise that the plant normally ramps up over two to four years. Capacity utilization typically starts lower and scales up over several years in rice milling operations. DPRs in India commonly prepare at least five-year financial projections, and some lenders require seven to ten years for large projects. Operating costs are expected to increase significantly by the fifth year due to inflation and volume growth. Annual changes in selling prices, raw material prices, wages and interest should be reflected across all projection years to show how industry trends affect the present status of profitability and DSCR.
Break-Even Analysis and Contribution
Rice mill break even projection identifies the minimum sales or capacity utilisation needed to cover all costs. Fixed costs include salaries, administrative overheads and interest. Variable costs include paddy, packing, power and transport.
Break-even Sales (₹) = Annual Fixed Costs ÷ Contribution Margin Ratio
Better by-product revenue and higher recovery improve contribution margin and reduce break-even capacity, strengthening rice mill project viability. For the complete analytical framework, review the rice mill profitability and break-even analysis.
DSCR and Debt Repayment Capacity Analysis
DSCR is one of the most critical indicators in rice mill DPR financial analysis. In simple terms:
DSCR = Cash Available for Debt Service ÷ Total Debt Service (Interest + Principal)
Banks examine both annual DSCR and average DSCR. Sample DPRs for smaller rice mills have shown average DSCR of approximately 2.558 and IRR of around 19%. A healthy DSCR trend under realistic stress scenarios gives comfort to lenders – though no single DSCR level guarantees sanction, as each bank applies its own policies.
Profitability, ROI, IRR and Payback for Rice Mill Project
Key profitability metrics – gross profit, EBITDA margin, net profit margin and cash accrual – are driven by paddy prices, rice and by-product realisations, capacity utilisation and cost control. Financial metrics in rice milling include initial investment, gross margins and payback periods.
Return on investment compares net profit to total capital employed. Internal rate of return is the discount rate at which the net present value of project cash flows equals zero – many investors and banks look at IRR alongside DSCR for rice mill project finance DPR appraisal. Payback period indicates how long cumulative cash flows take to recover the capital investment. These indicators are estimates based on realistic assumptions; actual performance varies with market growth, efficiency and access to reliable source markets.
Sensitivity Analysis and Risk Assessment in Rice Mill Financial Model
A robust rice mill financial model must include sensitivity analysis to test viability under adverse conditions. Sensitivity analyses should assess the financial impact of fluctuations in raw material prices, and sensitivity analysis in financial modeling allows for understanding the impact of price changes on profits.
Key variables to stress-test:
- Paddy purchase price increase (+5–10%)
- Rice selling price decline (–5–10%)
- Capacity utilisation 10% below base case
- Lower head rice recovery
- Higher power, fuel or interest costs
- Project implementation delays
A modest 5% increase in paddy cost combined with a 5% drop in rice realisation can turn a marginally viable project unviable. In my DPR work, this analysis often helps promoters refine procurement strategy and financing structure before committing large capital to a rice mill project in agriculture-intensive states like West Bengal or Punjab.
Key Financial Ratios and How Banks Review Rice Mill DPRs
Lenders use a comprehensive set of ratios when reviewing rice mill financial projections for bank loan and CMA data:
| Ratio | What It Measures |
|---|---|
| Current Ratio | Liquidity |
| Debt–Equity / TOL-TNW | Leverage |
| DSCR | Debt-servicing comfort |
| Interest Coverage | Ability to service interest |
| EBITDA Margin | Operating profitability |
| Net Profit Margin | Bottom-line efficiency |
| Break-even Capacity | Risk level |
A bank credit officer checks project cost reasonableness, promoter contribution, capacity assumptions, paddy availability, marketability in the rice market, profitability, working capital cycle, security and projected DSCR under both base and stressed cases. Approval depends on multiple factors – borrower track record, collateral, internal policy and sectoral exposure. A well-structured rice mill bankable project report with consistent data across all accounts significantly improves appraisal clarity.
Integrated Financial Model, Documentation and Professional Support
A complete rice mill project finance DPR links all modules: plant capacity → production → paddy requirement → recovery and sales → operating cost → profit and loss → working capital → cash flow → loan repayment → projected balance sheet → DSCR and financial ratios. A change in one assumption, such as paddy price or capacity utilisation, should automatically flow through the entire model.
Key documents needed to prepare a detailed project report with customised financial projections include machinery quotations, land and building details, proposed plant capacity, paddy procurement plan, expected recoveries, product mix and prices, labour and power estimates, term loan and working capital requirements, and implementation timeline.
As CA Manish Gugliya, I assist promoters with DPR preparation, rice mill CMA data and financial projections, sensitivity analysis and bank loan documentation through my services at ProjectReportBank.com. All projections are estimates based on assumptions and not guaranteed outcomes. Actual performance can differ due to market, climatic, policy and operational factors, and loan sanction remains subject to the lender’s independent appraisal.
Illustrative Five-Year Financial Projection Snapshot (Example Only)
The following table presents hypothetical numbers for a mid-sized rice mill (approximately 4–8 TPH) to demonstrate how a projection summary might appear. These figures are for illustration only and should not be used directly for any bank application.
| Parameter | Year 1 | Year 2 | Year 3 | Year 4 | Year 5 |
|---|---|---|---|---|---|
| Capacity Utilisation (%) | 55% | 70% | 80% | 85% | 88% |
| Total Revenue (₹ crore) | 38.50 | 49.00 | 56.00 | 59.50 | 61.60 |
| EBITDA (₹ crore) | 3.08 | 4.90 | 6.16 | 6.85 | 7.39 |
| Profit After Tax (₹ crore) | 0.62 | 1.75 | 2.80 | 3.35 | 3.90 |
| Cash Accrual (₹ crore) | 1.82 | 2.95 | 3.95 | 4.45 | 4.95 |
| Term Loan Outstanding (₹ crore) | 12.80 | 10.90 | 8.80 | 6.50 | 4.00 |
| DSCR | 1.25 | 1.65 | 2.10 | 2.45 | 2.85 |
Illustrative Example – Not a Standard Projection. Actual figures depend on plant capacity, location, technology, paddy variety, product mix, financing terms and market conditions.

Conclusion – Building Bankable Rice Mill Financial Projections
High-quality rice mill financial projections for DPR begin with technical capacity and realistic assumptions on paddy procurement, recovery, product mix, costs, term loan and working capital. A consistent rice mill financial model connects all projected statements – profit and loss, projected balance sheet, projected cash flow statement, working capital assessment, loan amortisation, DSCR, break-even and IRR – so that promoters and lenders see the complete financial picture.
Projections are estimates that must be revisited during project implementation and initial operating years as actual performance data becomes available. With structured financial planning and realistic assumptions, a modern rice milling business in India can better demonstrate financial viability, withstand market volatility and meet its long-term debt obligations. The quality of a DPR ultimately depends on the quality and consistency of the assumptions behind every number in the report.
Frequently Asked Questions (FAQ)
How many years of financial projections are ideal for a rice mill DPR in India?
Most rice mill project reports for bank term loans include at least five years of projections. Some lenders or large integrated projects may require seven to ten years. The projection horizon should ideally cover the full term-loan repayment period so that DSCR and cash flow sufficiency can be assessed for every repayment year.
What is the difference between Rice Mill Profit and Loss Projection and Cash Flow Projection?
The profit and loss projection records income and expenses on an accrual basis, while the cash flow projection tracks actual cash inflows and outflows – including loan disbursements, repayments and CapEx. A project may show profit in the P&L but face cash strain if loan instalments and inventory build-up are high, which is why banks insist on a detailed projected cash flow statement.
Can I use a generic template for Rice Mill Financial Projections for my bank loan?
While templates provide structure, a copy-paste model rarely reflects actual paddy availability, local pricing, capacity, product mix and financing terms. Experienced credit officers can identify generic projections immediately. All key assumptions should be tailored to the specific proposed rice mill, preferably with professional guidance from a practising chartered accountant experienced in project finance.
How do changes in government MSP or policies affect rice mill financial projections?
Changes in minimum support price, export policies, power tariffs or taxation can significantly alter paddy procurement cost, selling prices and profitability. Reflecting potential policy shifts through sensitivity analysis – such as higher paddy cost scenarios – helps promoters and lenders assess how resilient the project viability remains under such changes.
Are the DSCR and IRR values in a DPR guaranteed performance indicators?
DSCR, IRR and all profitability metrics in a DPR are projections based on a set of assumptions and are not guarantees of future performance or loan sanction. Actual results depend on execution quality, market conditions, paddy availability, technology performance and financial discipline. Each lender applies its own independent credit appraisal and risk policy.