A grain silo project in India demands substantial capital across land, civil construction, steel silos, grain handling machinery and automation before a single tonne of grain enters storage. Yet many promoters commit funds based on rough profitability estimates without examining whether the project can actually generate adequate cash flow to service debt, recover investment within a reasonable period and deliver returns that justify the risk. Conducting a financial analysis for a grain silo project helps determine whether capital expenditure returns are genuinely attractive or merely appear so on paper. This article explains how to approach a grain silo ROI IRR payback analysis using the financial tools that banks, investors and experienced project evaluators rely on in India.
CA Manish Gugliya, FCA, DISA (ICAI)
Key Takeaways
Grain silos in India are capital-intensive, long-term grain storage assets. Returns depend heavily on capacity utilisation, storage tariffs, commercial structure and financing terms. Key financial metrics in analysing a grain silo investment include ROI, IRR and NPV, along with payback period, DSCR and sensitivity analysis. These are not optional add-ons but the core tools for any serious investment decision.
- Accounting profit from a grain silo is not the same as investment cash flow. A project may show healthy net profit while struggling to meet term-loan instalments because working capital, maintenance capex and tax payments consume cash that profit statements do not fully capture.
- Project IRR (return on total capital employed) and equity IRR (return on promoter funds) must be evaluated separately. High leverage can amplify equity IRR in good years but magnify losses when utilisation drops.
- The payback period for a typical 10,000 MT steel grain silo project in India can vary widely-from under 7 years to well beyond 12 years-depending on occupancy, tariff structure and cost control. Generic thumb rules are unreliable.
- Banks and financial institutions focus heavily on DSCR, realistic capacity utilisation assumptions and downside sensitivity when appraising grain storage loans. An attractive IRR presentation alone does not secure sanction.
- Project Report Bank, led by CA Manish Gugliya, prepares tailored DPRs, CMA Data and financial models to evaluate grain silo ROI, IRR, payback and NPV for bank finance and investor decisions.
Understanding Grain Silo Investment & Revenue Models in India
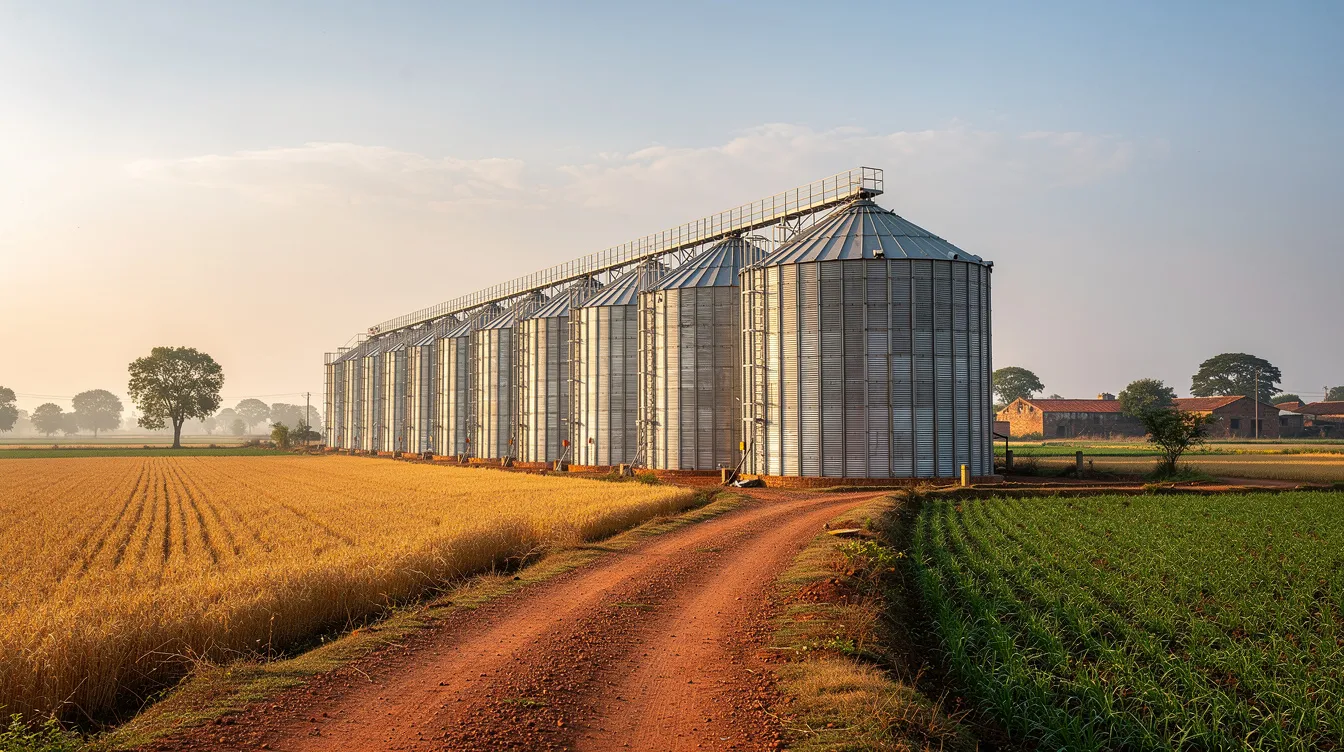
Post-harvest losses account for 10–15% of agricultural produce annually in India, driving a strong national push toward modern grain storage infrastructure. Modern grain storage systems prevent spoilage and infestations, and technological advancements reduce spoilage rates by up to 16%. Modern grain storage can reduce post-harvest losses by 10–15%, while on-farm storage with proper silo systems delivers similar loss reduction. Steel silos hold a 55% market share due to durability and corrosion resistance, making them the preferred silo type for large-scale food grain storage across the Indian market.
India’s agriculture silos market is valued at USD 423.4 million in 2025 and is projected to reach USD 593.8 million by 2030, growing at a compound annual growth rate of 6.8%. Globally, the grain storage silo market is valued at USD 5.10 billion in 2026 and is expected to reach USD 7.1 billion by 2033, growing at a CAGR of 6.3%.
Before any grain silo ROI IRR payback analysis is done, the exact commercial structure must be defined:
- Private commercial grain storage: Promoters build grain silos to store wheat, rice and maize for farmers, traders and processors against storage charges, handling fees and ancillary services.
- Contracted storage with Food Corporation of India or state agencies: Long-term contracts with fixed and variable tariffs, minimum offtake conditions and capacity reservation payments provide superior revenue visibility.
- Public private partnership and concession-based silos: Concession terms of 20–30 years with capacity-linked payments on a take-or-pay basis significantly reduce demand risk. Recent projects include Leap India’s 32.25-year PPP concessions with FCI.
- Infrastructure configurations: Distinguish road-fed grain silo facilities, rail-linked grain silo terminals and hub-and-spoke grain storage networks, each with different throughput economics.
Key storage concepts: Installed storage capacity (MT) is the maximum grain a facility can hold at any point. Average inventory is the stock actually held over time. Occupancy rate determines how fully the capacity is used. Annual throughput is the total MT handled across the year, which can exceed installed capacity if stock turns multiple times. Storage duration-typically measured in months-determines how long food grain remains stored.
Projected revenues from a grain silo include storage, handling and other service fees. Identifying all sources of income from storage rental per MT per month, handling and loading charges, grain drying and cleaning, fumigation and any fixed capacity reservation contracts is essential for revenue estimation. Grain storage silos can also improve grain grade and test weight, supporting superior grain quality and quality preservation that commands premium pricing.
Grain Silo Project Investment Cost & Capital Structure
The initial investment for a grain silo project in India covers land, civil work, steel silos, grain handling machinery and automation. Storage capacity significantly affects grain silo costs, with a 10,000 MT steel grain silo costing approximately ₹5–9 crore excluding land. Larger silos require stronger foundations and more construction material. Foundation quality impacts the lifespan of the silo system, and material choice affects construction costs and maintenance needs over the project’s 25–30 year useful life.
Annual operating costs include labor, electricity, maintenance and pest control for the silo. Automation systems increase initial silo costs but reduce labor expenses over time, improving operational efficiency in the long run.
Illustrative 10,000 MT Silo Project Cost
| Component | Amount (₹ Lakh) |
|---|---|
| Land & Site Development | 250 |
| Civil Construction & Foundations | 300 |
| Steel Silos & Supporting Structures | 550 |
| Conveying, Handling & Cleaning Machinery | 250 |
| Electrical, Aeration, Automation & SCADA | 200 |
| Weighbridge, Firefighting & Utilities | 50 |
| Preliminary & Pre-Operative Expenses | 80 |
| Interest During Construction (IDC) | 120 |
| Contingencies | 100 |
| Margin Money for Working Capital | 100 |
| Total Project Cost | 2,000 |
Means of Finance:
| Source | Amount (₹ Lakh) | Share |
|---|---|---|
| Promoter Equity | 600 | 30% |
| Term Loan | 1,400 | 70% |
| Total | 2,000 | 100% |
Higher debt with shorter repayment tenure increases DSCR pressure and can reduce equity IRR if cash flows are tight, while lower leverage may reduce equity returns but improve financial resilience. For detailed project cost breakdowns, refer to grain storage project cost and means of finance guidance.
How to Calculate Grain Silo ROI in India
Return on investment for a grain silo is a straightforward accounting measure. ROI for grain storage is calculated as (Net Gain / Cost of Investment) × 100.
Formula:
ROI (%) = (Average Annual Net Profit After Tax ÷ Total Project Cost) × 100
Worked example: If total project cost is ₹20 crore and average annual profit after tax is ₹2.6 crore:
ROI = (2.6 ÷ 20) × 100 = 13%
Variations to consider:
- ROI before tax versus after tax
- ROI on total capital employed versus ROI on promoter equity (equity ROI can be significantly higher when leverage is favourable)
- Average annual ROI across the projection period
Limitations: ROI ignores the timing of cash flows, ramp-up period, residual value and financing structure. It should not be interpreted as IRR or payback.
| Metric | What It Tells the Investor |
|---|---|
| ROI | Average annual accounting return on total investment |
| IRR | Discount rate at which NPV of all cash flows equals zero |
| NPV | Present value of future cash flows minus investment; accounts for time value of money |
| Payback | Years to recover the initial investment from cumulative cash inflows |
| DSCR | Whether annual cash flow can cover debt repayment obligations |
Net Present Value accounts for the time value of money in investment appraisal, making it essential alongside ROI. Investing in a grain silo requires analysing both short-term cash recovery and long-term value creation.
Grain Silo Project IRR Calculation – Project IRR vs Equity IRR
IRR is the discount rate that makes the Net Present Value of cash flows equal to zero. A robust financial appraisal balances capital expenditure against projected savings and revenue over the project’s operating life.
- Project IRR uses unlevered free cash flows (before interest and principal repayments) and measures return on total capital invested.
- Equity IRR uses only the cash flows going in and out of promoter equity-equity infusions and distributions after debt service.
Illustrative Unlevered Cash Flows (₹ Lakh)
| Year | Cash Flow |
|---|---|
| 0 | -2,000 |
| 1 | 180 |
| 2 | 240 |
| 3 | 290 |
| 4 | 310 |
| 5 | 320 |
| 6 | 330 |
| 7 | 340 |
In Excel: =IRR(B2:B9) where B2 contains -2000 and B3:B9 contain annual cash flows. For NPV: =NPV(discount_rate, B3:B9) + B2.
For equity IRR, replace year-0 outflow with equity contribution only (-600) and use annual cash flows after deducting interest and principal repayments. Equity IRR will typically differ materially from project IRR due to leverage effects.
Common errors to avoid: Not including construction-period outflows, using PAT instead of free cash flow, ignoring working capital changes, and mixing nominal and real cash flows. Professional financial projections and modelling are essential rather than rule-of-thumb calculations.
Grain Silo Payback Period Calculation
The payback period is the time required for cumulative net cash inflows to recover the initial investment. It is a time-based indicator, not a percentage-based one.
Steps:
- Estimate annual net cash inflows after tax and operating costs
- Compute cumulative cash flow year by year
- Identify the year in which cumulative cash flow turns positive
Illustrative Cumulative Cash Flow (₹ Lakh)
| Year | Annual Cash Inflow | Cumulative |
|---|---|---|
| 1 | 180 | 180 |
| 2 | 240 | 420 |
| 3 | 290 | 710 |
| 4 | 310 | 1,020 |
| 5 | 320 | 1,340 |
| 6 | 330 | 1,670 |
| 7 | 340 | 2,010 |
Against a total investment of ₹2,000 lakh, simple payback falls in approximately year 7. Discounted payback, which applies a chosen discount rate to each year’s cash flow, would extend this further.
Factors affecting payback in grain storage include ramp-up of occupancy, delays in commercial operation date, tariff escalation clauses and variability in grain throughput. Payback does not reflect profitability beyond the recovery point and should not be used alone to accept or reject an investment.
Grain Silo Project Break-Even Analysis
Break-even analysis for grain silos should be done both in revenue terms and in physical terms (MT stored and handled), because capacity utilization impacts profitability by determining how fully a silo’s storage is used. Fixed operating costs can dramatically affect a project’s profitability during periods of low utilisation.
Fixed costs include salaries, insurance, administrative overheads, minimum electricity for temperature monitoring and aeration, basic maintenance and security. Variable costs include energy for conveying and drying, handling labour, fumigation chemicals and equipment wear.
Break-even formula:
Break-even Revenue = Fixed Costs ÷ Contribution Margin Ratio
Where Contribution Margin Ratio = (Revenue – Variable Costs) ÷ Revenue
Illustrative Break-Even (₹ Lakh/Year)
| Parameter | Value |
|---|---|
| Fixed Operating Costs | 180 |
| Average Storage Tariff | ₹80/MT/month |
| Variable Cost per MT Stored | ₹25/MT/month |
| Contribution Margin Ratio | 68.75% |
| Break-even Revenue | 261.8 |
| Break-even Occupancy (approx.) | ~55% of 10,000 MT |
Installed capacity of 10,000 MT is not the same as annual throughput. For bank-financed projects, true sustainability requires covering both operating expenses and scheduled debt service. Refer to grain silo capacity planning for how production capacity and process design influence throughput.
Grain Silo Project Financial Projections – Illustrative 10,000 MT Case Study
This section provides a simplified, hypothetical financial model for a 10,000 MT steel grain silo in India, purely for educational purposes. These are not quotations, benchmarks or guaranteed returns.
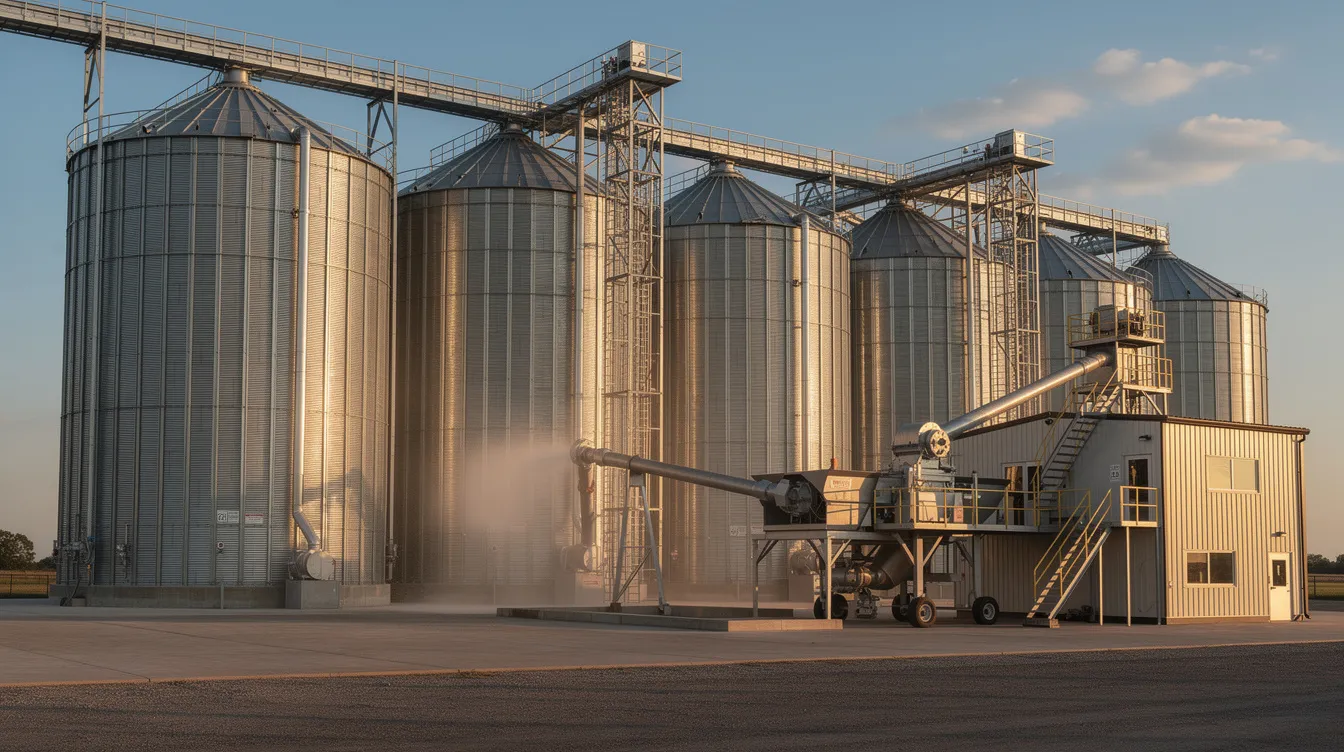
Assumptions: 10,000 MT steel grain silos with automated conveying, cleaning and drying in a grain-surplus belt. Storage tariff of ₹80/MT/month (fixed component) with 3% annual escalation. Variable charge ₹57/MT/month on grain actually stored. Occupancy ramp-up: Year 1 at 50%, Year 2 at 65%, Year 3 onwards at 80%. Loan at 12% interest, 15-year tenure.
Projected P&L and Cash Flow (₹ Lakh)
| Parameter | Year 1 | Year 2 | Year 3 | Year 4 | Year 5 |
|---|---|---|---|---|---|
| Revenue (Storage + Handling) | 380 | 500 | 620 | 640 | 660 |
| Operating Expenses | 200 | 220 | 240 | 248 | 256 |
| EBITDA | 180 | 280 | 380 | 392 | 404 |
| Depreciation | 60 | 60 | 60 | 60 | 60 |
| Interest | 155 | 145 | 135 | 124 | 112 |
| PBT | -35 | 75 | 185 | 208 | 232 |
| Tax (25%) | 0 | 19 | 46 | 52 | 58 |
| PAT | -35 | 56 | 139 | 156 | 174 |
| Cash Accruals (PAT + Dep) | 25 | 116 | 199 | 216 | 234 |
DSCR Analysis (₹ Lakh)
| Parameter | Year 1 | Year 2 | Year 3 | Year 4 | Year 5 |
|---|---|---|---|---|---|
| Cash Available for Debt Service | 180 | 261 | 334 | 340 | 346 |
| Annual Debt Service (Principal + Interest) | 248 | 248 | 248 | 248 | 248 |
| DSCR | 0.73 | 1.05 | 1.35 | 1.37 | 1.40 |
Year 1 DSCR is below 1.0, reflecting the ramp-up reality that banks must evaluate carefully. By Year 3, DSCR crosses comfortable territory. Different commercial models-a long-term contract with Food Corporation of India versus fully merchant storage-produce very different cash-flow profiles. For detailed methodology, see grain storage financial projections, working capital and DSCR.
Grain Silo Sensitivity Analysis – Key Investment Risks
Sensitivity analysis tests how changes in key assumptions affect the project’s returns. For grain storage infrastructure, this analysis is not optional-it is what separates bankable proposals from speculative projections.
Demand-side risks: Reduction in occupancy by 10–20%, decrease in storage tariff by 5–10% due to competitive landscape pressures, lower-than-expected grain throughput, delayed ramp-up after commissioning.
Cost-side risks: Project cost increase of 10–20% from rising construction material and raw materials prices, higher electricity tariffs, increase in manpower and maintenance cost, unexpected equipment replacement.
Financial risks: Interest rate increase by 100–200 basis points, shorter repayment tenure imposed by banks, COD delay extending interest during construction, delayed payments from state agencies. Grain prices and basis volatility can significantly affect the financial performance of a silo project, particularly in merchant storage models.
Sensitivity Table (Illustrative)
| Variable | Base Case | Adverse Case | Impact on EBITDA | Impact on Project IRR | Impact on Avg DSCR |
|---|---|---|---|---|---|
| Occupancy | 80% | 65% | -18% | -2.5 pp | -0.25 |
| Storage Tariff | ₹80/MT/mo | ₹72/MT/mo | -12% | -1.8 pp | -0.18 |
| Project Cost | ₹20 Cr | ₹23 Cr | No change | -1.5 pp | -0.12 |
| Interest Rate | 12% | 14% | No change | -0.8 pp | -0.15 |
| COD Delay | On time | 6 months | Deferred | -1.2 pp | -0.20 |
| Operating Costs | As projected | +15% | -10% | -1.0 pp | -0.14 |
IRR and DSCR are highly sensitive to utilisation and tariff levels. Moderate capex overruns may be survivable if long-term occupancy is secured by contract. Professional project feasibility study services should include comprehensive risk assessment.
Best-Case, Base-Case & Worst-Case Grain Silo Financial Scenarios
Investors and lenders should review at least three scenarios with consistent structure and clearly varied assumptions.
- Base case: 80% steady occupancy, current market tariffs with 3% escalation, costs at projected levels, timely COD.
- Best case: 90% occupancy from Year 2, slightly better tariffs due to rising adoption of modern silos, stable operational costs, no construction delay.
- Worst case: 60% sustained occupancy, 10% tariff reduction from competition, 15% cost overrun, 6-month COD delay.
Scenario Comparison (Illustrative)
| Metric | Best Case | Base Case | Worst Case |
|---|---|---|---|
| Average ROI (5 Yr) | 15.5% | 12.5% | 5.2% |
| Project IRR (20 Yr) | 16.8% | 13.2% | 7.5% |
| Equity IRR (20 Yr) | 21.5% | 16.0% | 4.8% |
| Simple Payback | ~5.5 years | ~7 years | ~12 years |
| Average DSCR (Yr 3-7) | 1.65 | 1.35 | 0.88 |
These are hypothetical results and should not be generalised. Scenario analysis is also used when negotiating loan covenants, moratorium and repayment schedules with banks.
How Banks Evaluate Grain Silo Financial Viability
Banks in India look beyond headline ROI and IRR. Their focus is on cash flow adequacy, DSCR and promoter strength.
- Project cost reasonableness: Lenders benchmark quoted CAPEX per MT against market rates (₹5,000–9,000 per MT ex-land for steel silos) and question significant deviations.
- DSCR benchmarks: Banks typically require average DSCR above 1.25–1.50 over the loan tenure, examining year-wise DSCR under both base and stressed cases.
- Revenue visibility: Long-term storage agreements with Food Corporation of India, State Warehousing Corporations or large processors improve bankability far more than speculative spot-market grain storage relying on market prices alone.
- Documentation: Detailed Project Report, CMA Data, projected balance sheets, cash flows, sensitivity analysis, promoter financials and track record. For professional assistance, explore bank finance DPR and loan proposal services.
- Risk assessment: Banks evaluate construction risk, technology risk, location risk relative to procurement mandis, and regulatory risk tied to food grain procurement policy support and government schemes.
A high IRR model alone does not guarantee sanction. Lenders must be comfortable with repayment capacity under conservative assumptions.
How to Improve Grain Silo ROI & Investment Returns
Improving grain silo returns combines design optimisation, commercial strategy and financial structuring.
- Phase-wise capacity expansion: Starting with a smaller, well-utilised module produces higher early ROI and reduces initial leverage compared to over-building capacity that remains idle. This approach supports better inventory management and reduces storage losses.
- Optimise CAPEX through life-cycle cost analysis: Select grain silo machinery and equipment based on total cost of ownership rather than minimum upfront price alone.
- Revenue strategies: Secure medium- to long-term storage contracts, diversify the customer base beyond a single company or agency, and offer value-added services such as cleaning, grading and drying for food processing clients. Quality preservation through temperature monitoring supports premium tariffs.
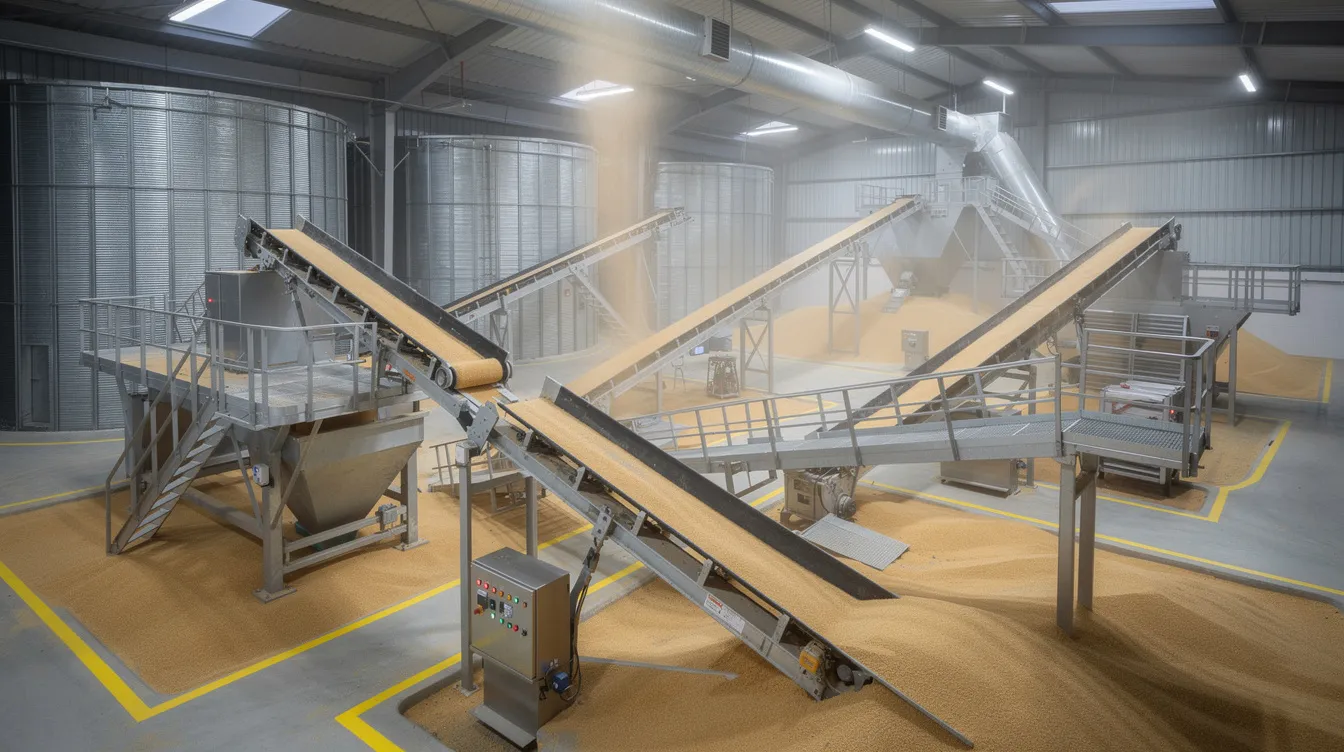
- Operational efficiency: Energy-efficient conveying and aeration, good plant layout, reduced truck turnaround time and preventive maintenance lower operational costs. Automated storage systems lower ongoing labor and energy costs, while operational efficiencies from grain storage can lower fuel and labor costs across the supply chain.
- Financial structuring: Match loan tenure and moratorium to cash flow ramp-up. Negotiate interest rates to keep DSCR comfortable. Avoid excessive short-term borrowing for working capital.
Periodically review actual performance against DPR projections and update financial models. Modern silos with efficient grain storage and lower operational costs deliver the best long-term asset value.
Common Mistakes in Grain Silo ROI & IRR Calculations
Many grain storage promoters in India rely on simplified spreadsheets that can significantly misstate project viability.
- Occupancy overestimation: Assuming near-100% utilisation without verifying grain availability, competing storage facilities, logistics constraints or shifts in food grain procurement policy.
- Confusing installed capacity with annual throughput: A 10,000 MT silo may handle more than 10,000 MT per year with multiple stock turns, but assuming full-year storage revenue at peak tariff for the entire capacity is equally dangerous.
- Tariff and unit errors: Misusing per MT per month tariffs as annual tariffs, or failing to align storage duration with billing cycles, leads to serious revenue overstatement.
- Ignoring maintenance and replacement capex: Many models exclude periodic major overhauls for conveying and automation systems needed after 10–15 years.
- Cash flow mis-specification: Using net profit or EBITDA directly for IRR instead of unlevered free cash flow; omitting taxes, working capital changes and terminal value.
- Double-counting subsidies: Including government support both as revenue and as a project cost reduction. Effective financial modeling must account for project-specific assumptions and not rely on generic templates.
- Inconsistent time horizons: Comparing returns calculated over 10, 20 and 25 years without harmonising project life. IRR and NPV should be evaluated over a defined, economically justifiable operating horizon.
When Is a Grain Silo Investment Financially Viable?
There is no single ROI or IRR threshold applicable to every grain silo. Viability depends on risk profile, funding mix, contractual framework and promoter expectations.
- Project IRR must exceed cost of capital by a reasonable margin, NPV at the chosen discount rate should be positive, DSCR should meet lender requirements and payback should be acceptable relative to project life.
- Qualitative factors matter: long-term demand for efficient grain storage in the catchment, continued policy support for modern storage infrastructure in developing countries like India, food security priorities and the credibility of key customers.
- A project with slightly lower expected IRR but long-term contracted revenue may be more attractive than a higher-IRR project fully dependent on volatile spot storage. Cash inflows from the silo must exceed initial construction outlay for financial viability over the project’s life.
For comprehensive project-specific assessment, refer to grain storage and silo project feasibility study guidance.
Professional DPR, Financial Modelling & Project Finance Advisory for Grain Silos
With more than 20 years of experience in project finance, DPR preparation and investment analysis across manufacturing, agro-processing and grain storage projects in India, I offer customised professional advisory through Project Report Bank.
- DPR and project planning: Customised steel grain silo plant DPR preparation, project cost estimation, means-of-finance planning and loan structuring for term loans and working capital.
- Financial modelling: Detailed financial projections, ROI and IRR computation (project and equity IRR), NPV and payback analysis, DSCR evaluation and grain silo project sensitivity analysis under multiple scenarios.
- Lender and investor support: CMA Data preparation, bank finance proposals, responses to banker queries and investor-ready documentation-without guaranteeing sanction or funding.
Every silo project-whether road-fed, rail-linked or hub-and-spoke-requires project-specific assumptions. We build models tailored to actual site conditions, capacity and commercial agreements, not generic templates.
Connect via WhatsApp or call to discuss your grain storage project requirements.
Frequently Asked Questions
How is capacity utilisation for a grain silo realistically estimated in financial projections?
Realistic estimation requires analysing regional food grain production and procurement trends, competing storage capacity in the area, distance to mandis and railheads, existing infrastructure and any MoUs or letters of intent from prospective customers such as FCI or large traders. Simply assuming 90% utilisation from Year 1 without supporting demand analysis is a common error that weakens both DPR credibility and bank appraisal outcomes.
Does government support or subsidy automatically make a grain silo project viable?
No. While schemes and viability-gap funding can improve returns and reduce the total investment burden, the underlying business model, utilisation levels and tariff structure must still be commercially sound. Promoters should not base investment decisions solely on potential subsidy, especially when disbursement timing and eligibility conditions are uncertain. The farm-level and market-level economics must work independently.
What project life should be used for IRR and NPV computations for steel grain silos in India?
Typical economic life for well-maintained steel grain silos and concrete silos is 25–30 years, aligning with standard concession periods in PPP contracts. However, the IRR horizon should match the realistic operating life and any contractual or concession duration. Mid-life replacement of mechanical systems around Year 10–15 should be factored into cash flows as maintenance capex.
Can small and mid-sized MSME promoters set up grain silos?
Yes. MSMEs can develop smaller-capacity silos (e.g., 1,000–5,000 MT) or participate in cluster-based storage projects with appropriate project finance. However, they require robust DPR preparation, proper CMA Data, adequate collateral planning and realistic assessment of demand in their catchment area. The competitive landscape and market size in the chosen location determine feasibility as much as the business plan itself.
Why should a grain silo DPR include both IRR analysis and DSCR analysis?
IRR evaluates overall return on investment over the project life, while DSCR examines year-wise repayment capacity. A project may show an acceptable IRR over 20 years but still face DSCR shortfalls in the initial ramp-up years when occupancy is low. Lenders typically rely on DSCR and cash flow analysis even when IRR appears attractive. Including both metrics in a grain storage financial projections model provides a more complete picture for both equity and debt stakeholders.
Conclusion – Evaluating Grain Silo Investment Returns in India
Grain silos are critical infrastructure for reducing post-harvest losses, preserving food grain quality and supporting India’s food security. But they require rigorous financial evaluation before committing large capital. The rising adoption of modern grain storage across Asia Pacific and the growing market size-reflected in India’s agriculture silos market projected to reach USD 593.8 million by 2030-signals strong demand, but demand alone does not ensure project-level profitability.
A complete grain silo ROI IRR payback analysis must integrate ROI, project IRR, equity IRR, NPV, payback period, break-even and DSCR, along with thorough sensitivity and scenario analysis. Reliable conclusions depend on realistic assumptions around grain storage tariffs, utilisation, throughput, storage costs, construction material choices and financing terms grounded in local market realities.
Serious promoters, MSMEs and investors planning grain storage projects should engage professional advisory for customised DPRs, financial projections, CMA Data and project finance support. Connect with Project Report Bank via WhatsApp for a consultation tailored to your specific project, capacity and commercial structure.
CA Manish Gugliya FCA, DISA (ICAI) Project Report Bank