Key Takeaways
- Reliable grain storage financial projections must integrate storage capacity, tariff assumptions, occupancy ramp-up, operating costs, working capital assessment and term-loan repayment into one linked financial model – not as isolated spreadsheets.
- DSCR (debt service coverage ratio) and cash flow planning are as important as projected profits for bankability. A project showing accounting profit can still fail debt service if cash flows are misaligned with repayment schedules.
- Third-party grain storage service models do not own the stored grain. Customer grain value should never be shown as the operator’s inventory or working capital in projections, CMA Data or loan proposals.
- This guide walks through a 10,000 MT illustrative facility with 7-year projections, working capital assessment, DSCR analysis and sensitivity scenarios relevant for Indian bank appraisals.
- Project Report Bank, led by CA Manish Gugliya (FCA, DISA, 20+ years of experience), assists with customised DPR, CMA Data, financial modelling and bank finance advisory for grain storage projects across India.
Introduction – Why Financial Projections Matter for Grain Storage Projects
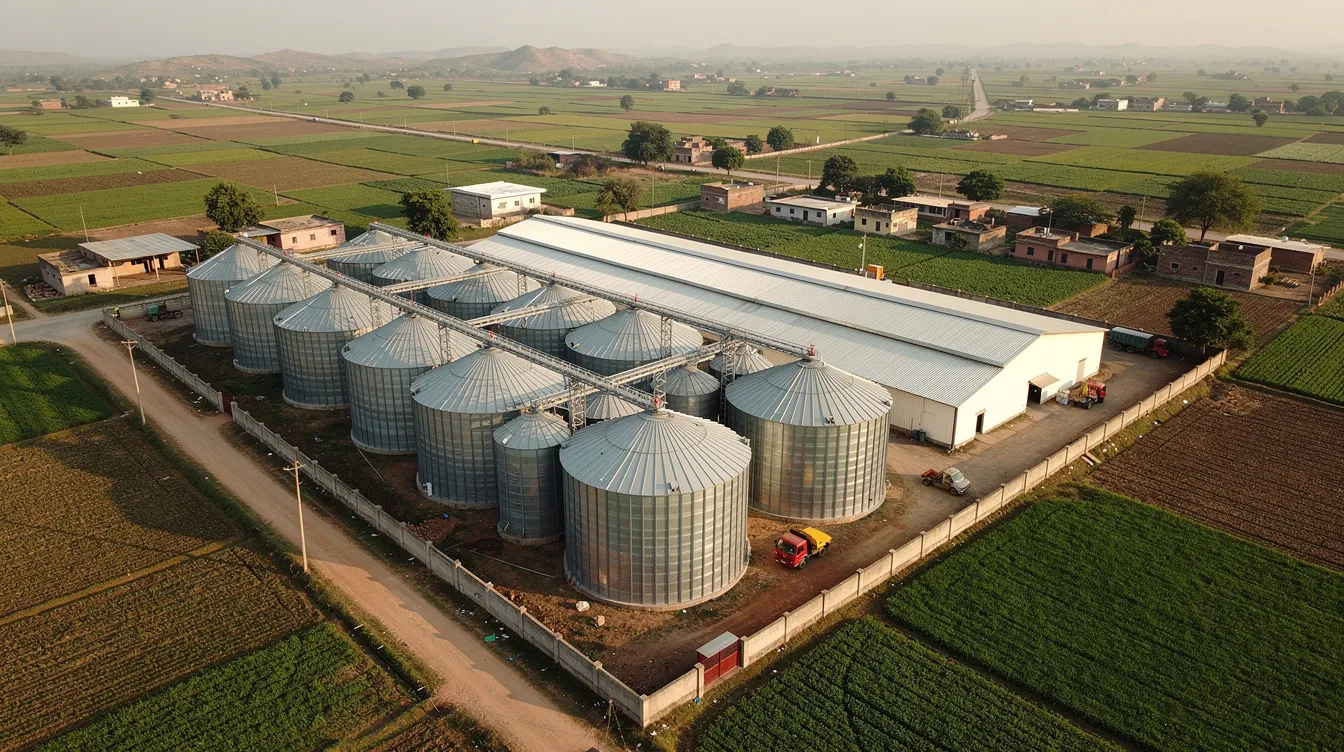
Grain storage infrastructure in India – whether steel silos, RCC godowns or modern warehouses – is capital-intensive. A 10,000 MT facility can require an investment of ₹6–8 crore or more, with high fixed costs that continue regardless of whether the facility operates at 50% or 90% occupancy. The Government of India approved the World’s Largest Grain Storage Plan on 31 May 2023, signalling a national push for decentralised storage capacity. India’s grain storage capacity is crucial for food security, and India’s agricultural silo market is projected to grow significantly by 2031. Yet without structured financial projections, even a technically sound grain storage facility can face severe cash-flow stress.
Grain storage facilities serve FCI, state agencies, PACS, FPOs, private traders and food processing companies. Revenue depends on long-term contracts, seasonal utilisation patterns, tariff levels and the number of storage cycles per year. High fixed costs – land, buildings, silos, bucket elevator systems, staff, electricity, security, insurance – create break-even challenges during the first two to three years. India’s agricultural silo market is rapidly modernizing to reduce post-harvest losses, but the financial viability of individual projects still depends on how well revenue, expenses, working capital and debt service are modelled.
Without robust financial projections covering at least five to seven years, a project may show accounting profit while failing to generate adequate cash for loan repayments. The debt service coverage ratio may remain below acceptable levels during ramp-up years, creating stress that could have been avoided with better planning at the DPR stage.
From my experience preparing DPRs, CMA Data and financial models for grain storage and warehouse projects, I have observed that the most common gap is not the absence of numbers – it is the absence of internally consistent, assumption-driven financial models. The rest of this article serves as a practical bank-finance guide, covering revenue modelling, operating expenses, project cost, working capital, DSCR and sensitivity analysis for grain storage projects in India. Readers will also find references to separate articles on project cost, capacity planning, machinery and process flow published on Project Report Bank.
Key Takeaways for Grain Storage Financial Projections (Quick Reference)
Before reading the detailed sections, here is a quick checklist for promoters and bankers:
- Installed storage capacity (e.g., 10,000 MT), usable capacity (e.g., 95% of installed), average occupancy (e.g., 65–80% over years) and annual throughput are distinct quantities. Each must be modelled separately.
- Typical projections span five to seven years, with gradual occupancy ramp-up (e.g., 50%, 65%, 75%, 80%, 85%, 90%, 90%) and tariff escalation (e.g., 4–6% per annum) supported by market research and existing contracts.
- Working capital for third-party storage is driven by receivables and operating expenses. Trading or inventory-owning models add large seasonal inventory funding needs.
- DSCR should be calculated annually and on an average basis. Banks focus on the minimum DSCR year, not just the average across the loan tenure.
- Storage capacity should consider peak grain inventory and future growth requirements from the outset.
- A bankable DPR aligns technical design, commercial assumptions and financial projections. Project Report Bank prepares such integrated grain storage DPRs and financial models on a customised basis.
Understanding the Financial Structure of a Grain Storage Project
Different grain storage business models lead to very different revenue, cost and working capital structures. Choosing the right model affects everything from project cost to DSCR behaviour.
- Commercial third-party warehouse: Earns rent per MT per month plus handling and service income. Does not own the grain. Working capital is mainly receivables and operating expenses. This model applies to conventional godowns as discussed in the Modern Food Grain Warehouse & Godown Project Report.
- Steel grain silo storage service: Higher capex with steel silos, bucket elevators, chain conveyors, aeration and automation. Earns premium tariffs. Readers can see the Steel Grain Silo Plant Project Report for technical details; this guide focuses on the financial structure.
- FCI-linked or contract-based storage: Long-term storage agreements under tender with FCI, state agencies, CWC or SWC provide predictable occupancy and tariffs. This affects risk profile and DSCR comfort, often allowing banks to accept somewhat lower equity requirements.
- Hub-and-spoke grain silo model: Central silo plus satellite silos or warehouses, often with bulk grain handling and logistics integration. This is discussed further in the Hub & Spoke Grain Silo Project Report and Bulk Grain Handling & Logistics Terminal Project Report.
- PACS and FPO rural warehouses: Participate in cooperative sector grain storage plans with convergence of government schemes. Decentralised storage facilities can reduce transportation costs for farmers and reduce distress sales by allowing rural communities to store grain rather than sell immediately after harvest. The PACS & FPO Rural Grain Warehouse Project Report covers this model in detail.
- Captive grain storage for food processing plants: Mills and processors build their own silos or warehouses to stabilise raw-material supply. Here, grain inventory is owned and financed, adding large inventory to the balance sheet and working capital requirements.
- Grain trading with owned inventory: The company procures harvested grains, holds them in own storage, and realises price appreciation. Inventory finance, price risk and seasonal borrowing peaks are the key modelling issues.
The crucial distinction: Third-party storage operators do not own customer grain and should not show the value of stored grain as inventory or working capital in their DPR, CMA Data or loan proposal. Confusing this point is one of the most serious errors in grain storage financial projections.
Key Assumptions for Grain Storage Financial Projections
A reliable financial model is built on transparent, clearly stated assumptions. Every assumption should carry its unit (MT, ₹/MT/month, percentage, years). The table below illustrates assumptions for a 10,000 MT grain storage facility. These are purely illustrative and location-neutral.
India’s silo market is evolving with smart, integrated storage systems, and the assumptions below reflect a modern facility. For detailed capacity-planning guidance, readers may refer to Grain Silo Capacity Planning – 5,000 to 50,000 MT.
| Assumption | Unit | Illustrative Value |
|---|---|---|
| Installed storage capacity | MT | 10,000 |
| Usable capacity (net of stacking margins) | MT | 9,500 |
| Year 1 average occupancy | % | 50% |
| Year 7 average occupancy | % | 90% |
| Storage tariff (Year 1) | ₹/MT/month | 160 |
| Annual tariff escalation | % | 5% |
| Handling charge | ₹/MT | 80 |
| Operating days per year | Days | 330 |
| Average storage duration per lot | Months | 4–6 |
| Term-loan interest rate | % p.a. | 10% |
| Repayment tenure (incl. moratorium) | Years | 9 (1+8) |
| Promoter equity share | % | 30% |
| Depreciation – buildings/silos | % p.a. | 5% |
| Depreciation – machinery/equipment | % p.a. | 15% |
| Corporate tax rate (effective) | % | 25% |
| Annual operating cost escalation | % | 5–7% |
Actual tariffs, costs, interest rates and tax positions must be customised based on specific location, contracts and bank discussions. Project Report Bank prepares such customised models for promoters across India.
Grain Storage Revenue Model and Annual Income Projections
Revenue modelling is the backbone of grain storage financial projections and must be formula-driven, not arbitrary.
Core formulas:
- Annual Storage Revenue = Average Occupied Capacity (MT) × Monthly Storage Tariff (₹/MT) × 12
- Average Occupied Capacity = Usable Capacity × Average Occupancy Rate
- Handling Income = Annual Handling Throughput (MT) × Handling Charge (₹/MT)
Revenue streams for grain storage include commercial storage fees and drying fees, along with loading and unloading charges, grain cleaning and grading income, fumigation charges, testing and quality services, and other ancillary income. Market dynamics affect grain pricing and basis levels, which in turn influence how much grain customers choose to store and for how long. Effective capacity utilization impacts financial performance directly.
If a contract rate with FCI or another customer is inclusive of handling or fumigation, separate income for those services should not be added again. Double-counting is a common error.
For detailed understanding of how handling throughput connects to equipment capacity, the Grain Storage Process Flow Chart & Bulk Handling System provides useful context.
Illustrative Revenue Projection – 10,000 MT Facility
| Year | Avg. Occupancy | Occupied Capacity (MT) | Storage Tariff (₹/MT/month) | Storage Revenue (₹ lakh) | Handling & Other Income (₹ lakh) | Total Revenue (₹ lakh) |
|---|---|---|---|---|---|---|
| 1 | 50% | 4,750 | 160 | 91.20 | 12.00 | 103.20 |
| 2 | 65% | 6,175 | 168 | 124.49 | 15.60 | 140.09 |
| 3 | 75% | 7,125 | 176 | 150.48 | 18.00 | 168.48 |
| 4 | 80% | 7,600 | 185 | 168.72 | 19.20 | 187.92 |
| 5 | 85% | 8,075 | 194 | 188.07 | 20.40 | 208.47 |
| 6 | 90% | 8,550 | 204 | 209.30 | 21.60 | 230.90 |
| 7 | 90% | 8,550 | 214 | 219.56 | 22.70 | 242.26 |
All figures are illustrative. Actual revenue depends on location, contracts and tariff negotiations.
What drives revenue the most is occupancy in the first three years, tariff level from Year 4 onward, throughput cycles per year, and the share of value-added services like drying and grading. Cash flow will be seasonal – post-harvest months show peak receipts – which matters for working capital planning.
Grain Warehouse Operating Expenses and Cost Projections
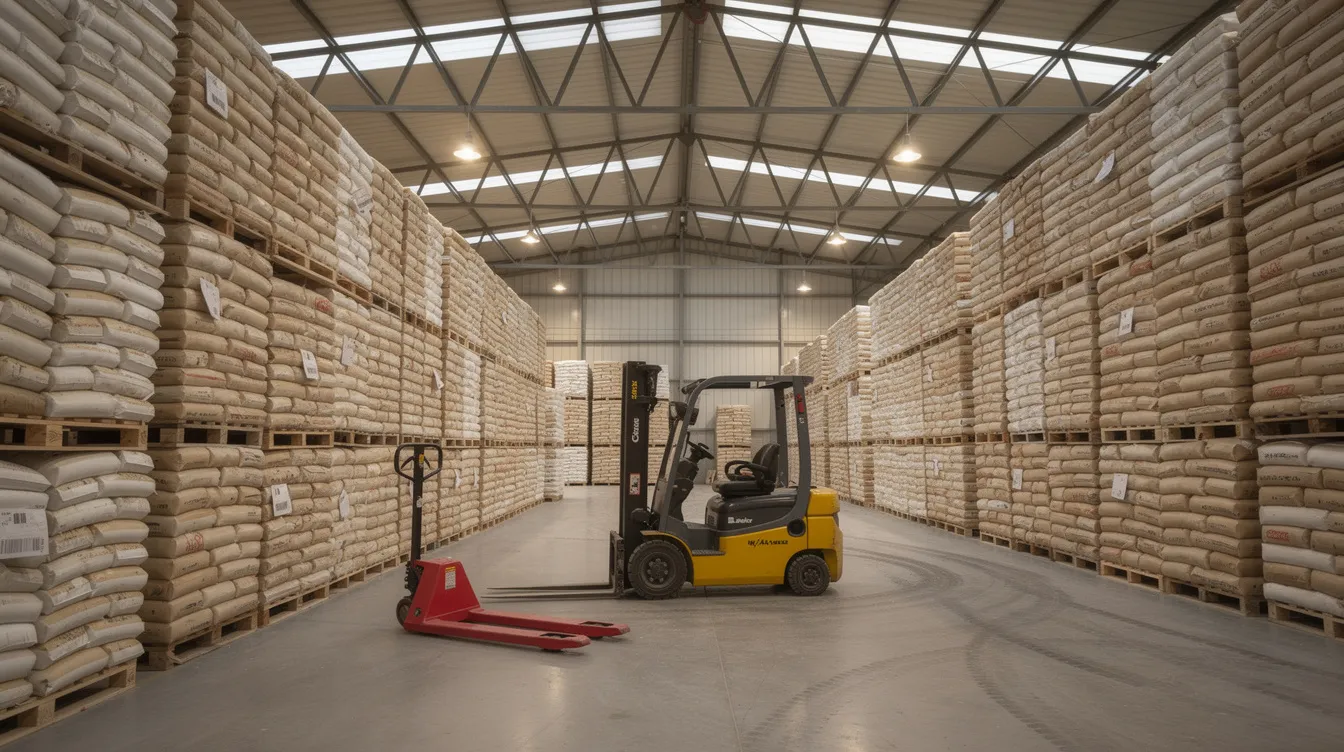
Financial projections for grain storage investments must consider fixed and variable costs separately. Operating expenses in grain storage involve energy costs, labor and maintenance as core components. Underestimating them distorts profitability and DSCR.
- Employee costs: Warehouse manager, accountants, machine operators, quality staff, security guards, helpers, plus statutory benefits (PF, ESIC, bonuses) and annual increments.
- Utilities: Electricity consumption for bucket elevators, conveyors, aeration fans, lighting and office load. Proper aeration is essential for maintaining grain quality during storage, and the energy cost of running aeration systems continuously should not be underestimated. Wet grain handling adds to drying energy costs.
- Repair and maintenance: Typically 1.5–3% of plant and machinery and building value per annum, including maintenance for grain silo machinery and equipment.
- Pest control and fumigation: Periodic fumigation, pesticides, rodent control and housekeeping – necessary for food-grade storage and compliance with food security standards.
- Security and surveillance: Manned security, CCTV, access control, fire alarm maintenance.
- Insurance: Asset insurance for buildings, silos and machinery. Property taxes and property insurance must be factored.
- Administrative overheads: Professional fees, communication, IT, software, marketing and travel – often underestimated in DPRs.
- Shrinkage loss affects the financial viability of grain storage operations and should be provisioned as a cost item, particularly for operators holding owned inventory.
As occupancy increases, margins improve because fixed costs are absorbed across greater revenue. However, energy cost and wage inflation can compress margins if tariffs do not keep pace with escalation.
Grain Storage Project Cost and Means of Finance
A complete grain storage facility integrates multiple equipment types, and capital expenditures include infrastructure, equipment and soft costs. The total project cost is not just building and silo price – it also covers land, site development, agricultural machinery, pre-operative expenses and initial working capital margin. Investment levels vary significantly based on storage capacity and equipment chosen. A 5,000-ton storage project may require multiple silos for efficiency.
Under current revised norms, plain-area warehouse construction cost is estimated at ₹6,000–7,000 per MT, and higher for north-eastern states.
Illustrative Project Cost – 10,000 MT Facility
| Cost Head | ₹ Lakh |
|---|---|
| Land and site development | 80.00 |
| Building / silo structure and civil works | 250.00 |
| Plant and machinery (silos, conveyors, bucket elevator, dryer, weighbridge) | 200.00 |
| Electrical installations, DG set, fire safety | 40.00 |
| Office, furniture, boundary wall | 15.00 |
| Preliminary and pre-operative expenses (incl. IDC) | 30.00 |
| Contingency (5–7%) | 30.00 |
| Working capital margin | 25.00 |
| Total Project Cost | 670.00 |
Means of Finance
| Source | ₹ Lakh | % |
|---|---|---|
| Promoter equity | 200.00 | ~30% |
| Term loan | 470.00 | ~70% |
| Total | 670.00 | 100% |
Financing structures encompass debt terms, equity requirements and working capital arrangements. For eligible cooperative sector projects, subsidy of up to approximately 33.33% on certain cost heads may be available under government schemes, but actual eligibility and quantum depend on current guidelines. The term-loan-funded project cost must be clearly separated from ongoing working capital limits like cash credit. For detailed cost benchmarks, see Grain Storage Project Cost & Means of Finance and Grain Silo & Warehouse Setup Cost in India.
Preparing 5–7 Year Grain Storage Financial Projections
A bankable grain storage DPR in India usually carries five to seven years of projections. Many banks prefer seven years for larger silo and warehouse projects where term-loan tenures extend beyond five years. The model should be driver-based: changing occupancy, tariffs or interest rates in one place should automatically update all linked schedules.
Key projected statements include the profit and loss account (showing revenue by source, EBITDA, depreciation, finance costs, profit before and after tax), projected balance sheets, cash flow statements, working capital schedules and debt repayment schedules.
Illustrative 7-Year Financial Summary – 10,000 MT Facility
| Year | Revenue (₹ lakh) | EBITDA (₹ lakh) | PAT (₹ lakh) | Closing Term Loan (₹ lakh) | DSCR |
|---|---|---|---|---|---|
| 1 | 103.20 | 32.00 | (2.50) | 470.00 | 0.95x |
| 2 | 140.09 | 55.00 | 8.00 | 411.25 | 1.22x |
| 3 | 168.48 | 72.00 | 18.00 | 352.50 | 1.42x |
| 4 | 187.92 | 85.00 | 27.00 | 293.75 | 1.62x |
| 5 | 208.47 | 99.00 | 37.00 | 235.00 | 1.85x |
| 6 | 230.90 | 112.00 | 46.00 | 176.25 | 2.10x |
| 7 | 242.26 | 120.00 | 52.00 | 117.50 | 2.35x |
All figures are illustrative. Actual results depend on project-specific assumptions.
Note how DSCR improves as occupancy and tariffs increase while debt service reduces. Year 1 shows a DSCR below 1.0x, which is common during ramp-up and covered by the moratorium period. For professionally prepared, driver-based financial models, readers may explore Financial Projections & Financial Modelling Services.
Working Capital Requirements for Grain Storage Projects
Even asset-heavy grain storage projects can fail due to inadequate working capital, particularly in the first two operating years when occupancy and collections are still stabilising.
For a third-party grain warehouse or silo service, working capital components include receivables from government agencies and traders, advance payments received, operating expense payables, minimal consumables inventory and a minimum cash balance for smooth operations.
Net Working Capital Requirement = Operating Current Assets − Operating Current Liabilities
For the 10,000 MT third-party storage model, assuming a 45-day average credit period to customers and 20-day creditor period, working capital needs might range from ₹12–20 lakh in early years, rising with revenue.
For a grain procurement and trading business with owned inventory, the picture changes dramatically. Inventory levels (in MT and days) and market prices drive very large seasonal funding requirements. During local procurement and post-harvest months, receivables and inventory peak. Farmers who can store grain avoid having to sell immediately after harvest, reducing distress sales – but the entity holding that inventory needs substantial working capital.
Working capital borrowing interest should be captured separately from term-loan interest in the financial model and must not be double-counted in DSCR calculations. Inadequate working capital leads to delayed salary and power payments, missed fumigation cycles and eventually EMI stress – even when the accounting P&L looks profitable.
For professional support with working capital assessment and bank documentation, CMA Data Preparation Services are available through Project Report Bank.
CMA Data Preparation for Grain Warehouse Bank Loans
CMA Data (Credit Monitoring Arrangement Data) is the standard multi-year financial information format used by Indian banks to appraise term-loan and working capital requests. Key CMA components for grain storage projects include past financials (if any), projected P&L, projected balance sheet, fund-flow statements, working capital assessment and ratio analysis including current ratio and debt-equity ratio.
The same underlying financial model should drive the DPR and CMA Data so that figures for sales, expenses, term-loan repayment, working capital levels and DSCR remain internally consistent. CMA Data helps banks test reasonableness of occupancy, tariff and working capital assumptions.
Common CMA errors include mismatch between DPR and CMA figures, misclassification of fixed versus current assets, inclusion of third-party grain as inventory and unrealistic current ratio projections.
DSCR Calculation for Grain Storage Projects
The debt service coverage ratio is a central metric for Indian banks to judge whether a grain warehouse or silo project can comfortably service its term-loan obligations. The debt service coverage ratio analyzes operational cash flow against debt payments.
DSCR = Cash Available for Debt Service ÷ Total Debt Service
Where Total Debt Service = Term-Loan Principal Repayment + Term-Loan Interest for the relevant year.
Cash available for debt service starts from profit after tax, adds back non-cash expenses like depreciation, adjusts for changes in working capital and excludes new term-loan drawdowns. Some bank appraisals approximate DSCR as (PAT + Depreciation + Term-Loan Interest) ÷ (Principal + Interest). While this simplified approach is widely used, promoters should understand how it relates to actual cash-flow-based DSCR.
Three measures matter: annual DSCR for each year, average DSCR over the repayment period, and minimum DSCR (the lowest annual DSCR). Banks scrutinise the minimum DSCR year most carefully, since a strong average can conceal a weak early-year period.
Illustrative DSCR Calculation – 10,000 MT Facility
| Year | PAT (₹ lakh) | Depreciation (₹ lakh) | Cash for Debt Service (₹ lakh) | Principal (₹ lakh) | Interest (₹ lakh) | Total Debt Service (₹ lakh) | DSCR |
|---|---|---|---|---|---|---|---|
| 1 | (2.50) | 33.00 | 77.50 | 0.00 | 47.00 | 47.00 | Moratorium |
| 2 | 8.00 | 33.00 | 82.25 | 58.75 | 44.13 | 102.88 | ~1.22x |
| 3 | 18.00 | 33.00 | 86.50 | 58.75 | 38.25 | 97.00 | ~1.42x |
| 4 | 27.00 | 33.00 | 95.00 | 58.75 | 32.38 | 91.13 | ~1.62x |
| 5 | 37.00 | 33.00 | 105.00 | 58.75 | 26.50 | 85.25 | ~1.85x |
| 6 | 46.00 | 33.00 | 114.00 | 58.75 | 20.63 | 79.38 | ~2.10x |
| 7 | 52.00 | 33.00 | 120.00 | 58.75 | 14.75 | 73.50 | ~2.35x |
Moratorium period: Year 1 – interest only, no principal repayment. Cash for Debt Service includes PAT + Depreciation + Interest adjustment. All figures illustrative.
There is no single universal minimum DSCR for all banks or all loans in India. However, many warehouse infrastructure term loans implicitly target a minimum annual DSCR threshold, with many lenders using 1.50x as a benchmark while some may accept a lower DSCR of around 1.25x for certain rural or subsidised projects. A small drop in occupancy in Years 2–3 may push DSCR below comfortable levels even when later years look strong.
Common DSCR mistakes include including working-capital principal repayments in term-loan debt service, double-counting interest and treating principal repayment as an operating expense.
Term Loan Repayment Schedule and Cash Flow Planning
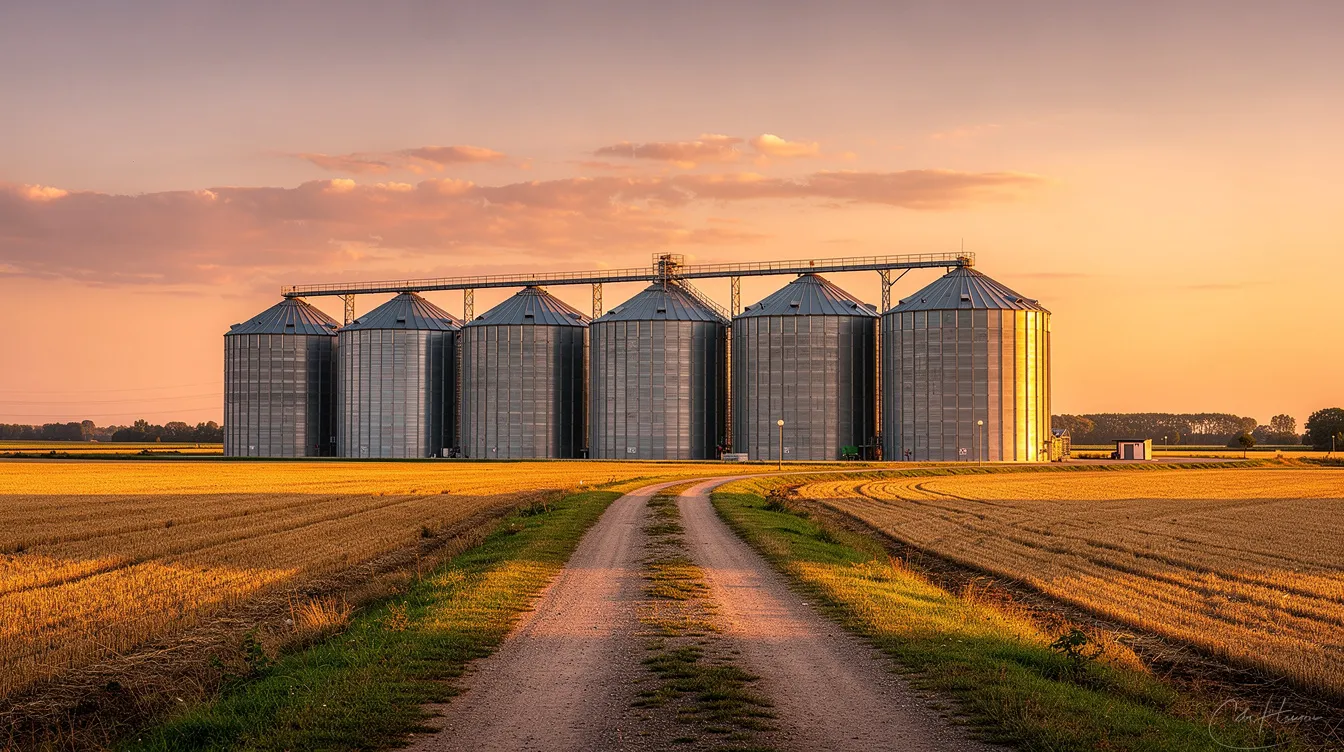
Repayment schedule design must align with projected cash flows, the stabilisation period, and the economic life of grain storage assets (typically 15–25 years for buildings and silos, shorter for equipment). Key variables include total tenure, moratorium period (12–18 months covering construction and initial operations), repayment frequency and method.
In the illustrative model, the term-loan drawdown is phased during construction and repayment starts after the commercial operations date. Interest should be computed on the average outstanding balance, with rate sensitivity so that a 0.5–1.0% change reflects directly in interest cost and DSCR.
Cash available after debt service – operating cash flow minus debt service – must be adequate to cover a minimum cash buffer, small capital replacements and promoter withdrawals. Project Report Bank also advises on loan structuring and project finance advisory to help promoters avoid poorly aligned repayment schedules that create unnecessary DSCR stress.
Break-Even Analysis and Financial Viability
Break-even analysis for grain storage has multiple dimensions.
- Operating break-even: The occupancy level at which total income equals total operating expenses (excluding interest and depreciation).
- Cash break-even: The minimum occupancy needed to cover all cash operating expenses plus interest – directly relevant for short-term survival.
- Debt-service break-even: The occupancy at which cash available for debt service equals total term-loan principal plus interest (DSCR = 1.0x).
For the 10,000 MT example, operating break-even may be achieved at approximately 40–45% occupancy in the stabilised year, while debt-service break-even may require 55–65% occupancy, depending on cost and financing structure.
Financial models should include key metrics like EBITDA and NPV. Investment indicators for full-project viability include project IRR, equity IRR, NPV at a chosen discount rate and payback period. These are scenario-dependent and not guaranteed returns. For full feasibility studies incorporating market, technical and financial analyses, promoters may consider Project Feasibility Study Services.
Sensitivity Analysis – Occupancy, Storage Tariff and Interest Rate
Sensitivity analysis evaluates the impact of fluctuating variables on financial outcomes. It is the practical way to test how robust a grain storage project is under varying conditions. Proper planning can prevent costly mistakes in grain storage projects.
Three scenarios should be tested:
- Base Case: Realistic occupancy ramp-up and tariffs based on current market conditions.
- Optimistic Case: Slightly higher occupancy, faster ramp-up or better storage tariff realisation.
- Conservative/Stress Case: Lower occupancy (−15 percentage points), tariff pressure (−5%), higher operating costs, project cost overrun (+10%) or interest rate increase (+1%).
| Parameter | Base Case | Optimistic | Conservative |
|---|---|---|---|
| Avg. Occupancy (Year 4) | 80% | 85% | 65% |
| Storage Tariff Escalation | 5% p.a. | 6% p.a. | 4% p.a. |
| Year 4 EBITDA (₹ lakh) | 85.00 | 98.00 | 62.00 |
| Average DSCR (Yr 2–7) | 1.76x | 1.95x | 1.28x |
| Minimum DSCR | 1.22x | 1.40x | 0.95x |
Bankers give more weight to how the project behaves under conservative scenarios. For grain storage, occupancy risk is the most critical variable, followed by tariff renegotiation risk and interest-rate risk. FCI-linked agreements or long-term contracts from key players in the supply chain can significantly mitigate these risks.
Public-private partnerships are driving innovation in silo technology adoption, which can improve efficiency and reduce long-term operating costs, contributing to better storage economics in all scenarios.
What Banks Examine in Grain Storage Financial Projections
From the perspective of a project-finance Chartered Accountant, the following areas typically receive close attention during bank appraisal of grain storage DPRs:
- Promoter evaluation: Experience in agri, logistics or infrastructure; financial strength; track record with existing bank lines.
- Project location and infrastructure: Proximity to farms, mandis, railheads; road connectivity; land title clarity and whether the site layout supports future growth. See Grain Storage Warehouse Land, Building & Layout Requirements for layout considerations.
- Market research and demand evidence: Regional storage demand gaps, food security considerations, competitive landscape, local procurement patterns, and any signed contracts or MOUs.
- Financial projections: Reasonableness of occupancy and tariff assumptions, adequacy of operating expenses, working capital sufficiency and DSCR behaviour in initial years. Banks look at the increasing demand for improved storage against existing capacity in the market.
- Capital structure and due diligence: Debt-equity ratio, timing of promoter contribution, contingency provision and clarity on project cost estimation.
- Sensitivity and risk assessment: Whether the DPR includes scenario analysis and how DSCR holds under different occupancy or tariff assumptions.
For bank-ready documentation, Bank Finance DPR & Loan Proposal Assistance from Project Report Bank addresses these evaluation points.
Common Financial Modelling Mistakes in Grain Storage DPRs
Many technically sound projects face delays because of avoidable modelling errors:
- Assuming 100% occupancy from Year 1 without contracts or credible market research support.
- Confusing installed storage capacity with annual throughput – projecting revenue as capacity × tariff × 12 months even when actual average occupancy or cycles per year would be lower. Understanding how much grain the facility can realistically handle per year is fundamental.
- Wrongly classifying third-party grain as owned inventory, which inflates current assets and misleads lenders.
- Double-counting handling and service income already included in contracted composite tariffs.
- Underestimating operating expenses – ignoring realistic electricity costs for bucket elevator, conveyors and aeration, and insufficient provisioning for repairs, fumigation and insurance.
- Ignoring seasonal working capital peaks during post-harvest months.
- Unrealistic repayment structures with very short tenures or high early-year principal instalments.
- Incorrect DSCR calculations – mixing cash-flow and P&L numbers, adding back items twice, or including working-capital principal as part of term-loan debt service.
- Unsupported cost quotations without updated vendor estimates or escalation provisions.
- Compliance factors include local zoning and environmental permits, which if missed can delay the project and distort financial timelines.
Professionally built, formula-linked financial models greatly reduce such errors and improve credibility with bankers.
Documents Required for Grain Storage Financial Projections and Bank Loan DPR
The exact list varies by bank and project size, but typically includes:
- Promoter and entity documents: KYC, company registration, PAN, GST, existing financial statements (last 3 years if any), existing borrowing details.
- Land and location: Sale deed or lease deed, title search, conversion approvals, location map and site layout.
- Technical details: Proposed storage capacity, type of storage (warehouse, silo or hybrid), equipment list, process flow and estimated throughput.
- Cost estimates: Civil construction estimates, machinery quotations for silos, bucket elevators, conveying systems, dryers, weighbridges and electricals.
- Commercial assumptions: Expected storage tariffs, draft or signed contracts, evidence of demand and market share potential.
- Operating cost inputs: Staffing plan, electricity tariff, maintenance contracts, pest control estimates.
- Finance structure: Proof of equity, proposed term-loan amount, proposed working capital limit, eligible government schemes being targeted.
- Regulatory: Applicable permissions, pollution clearance, building plan approvals, fire-safety clearance.
Organising these documents early saves significant time during DPR preparation and bank appraisal.
Professional Grain Storage DPR, CMA Data and Financial Modelling Services
Project Report Bank, led by CA Manish Gugliya (FCA, DISA, 20+ years of professional experience), provides customised professional advisory for grain storage, silo and warehouse projects across India. The approach is CA-led and project-specific – not template-based.
Core services relevant to grain storage include:
- Customised DPR preparation for steel grain silos, modern food grain warehouses, rail-linked and road-fed grain terminals, hub-and-spoke silo networks and integrated grain cleaning, grading, drying and storage plants.
- Detailed five to seven-year financial projections and modelling, working capital assessment, DSCR and repayment analysis, break-even and IRR calculation, and multi-scenario sensitivity analysis.
- Specialised CMA Data preparation aligned with DPR assumptions for both term-loan and working capital limits.
- Bank finance DPR and loan proposal assistance covering documentation, presentation and appraisal support.
All projections are based on reasonable, documented assumptions and are not guarantees of performance or loan sanction. Banks retain independent credit appraisal authority.
To discuss your grain storage DPR, financial projections or bank finance requirements, visit www.projectreportbank.com and connect via the WhatsApp enquiry button.
Frequently Asked Questions
How are financial projections prepared for a grain storage project?
Financial projections start with clearly stated assumptions about installed capacity, usable capacity, occupancy ramp-up, storage tariffs, handling charges and operating costs. These assumptions drive the revenue model, projected profit and loss account, cash flow statements, balance sheets and DSCR calculations over five to seven years. The model should be internally consistent so that changing any assumption automatically updates all linked schedules.
What is the difference between warehouse occupancy and annual grain throughput?
Occupancy refers to how much of the usable storage space is occupied on average during the year. Annual throughput refers to the total quantity of grain handled (received and dispatched) over the year. If a 10,000 MT warehouse has 80% average occupancy and handles two storage cycles per year, the average occupied capacity is 8,000 MT but the annual throughput could be 16,000 MT. Revenue calculations for long-term storage use occupancy; handling income calculations use throughput.
How does grain inventory ownership affect working capital?
In a third-party storage business, the operator does not own the customer’s grain, so grain value does not appear as inventory on the operator’s balance sheet. Working capital is limited to receivables and operating expenses. In a grain trading or procurement model, the company owns the grain, and inventory at market or cost value becomes a very large current asset requiring substantial working capital finance, especially during post-harvest procurement seasons. Temporary storage of owned grain creates seasonal borrowing peaks that must be modelled separately.
What happens when a grain warehouse operates below projected capacity?
When occupancy falls below projections, revenue drops while fixed costs such as staff salaries, insurance, property taxes, loan interest and depreciation continue. This compresses EBITDA, reduces cash available for debt service and depresses DSCR. If sustained, it may lead to difficulty meeting term-loan repayment obligations. This is why sensitivity analysis testing lower occupancy scenarios is essential in every grain storage DPR, and why a commercial facility should ideally secure demand commitments before commissioning.
Do grain storage projects require CMA Data for bank finance?
Yes, for most term-loan and working capital requests above a threshold amount, Indian banks require CMA Data as part of the credit appraisal. CMA Data includes projected financial statements, working capital assessment, ratio analysis and fund-flow statements. It must be internally consistent with the DPR and underlying financial model.
Conclusion – Building a Bankable Grain Storage Financial Model
A bankable grain storage financial model integrates storage capacity planning, realistic occupancy and tariff assumptions, detailed operating expenses, working capital requirements, cash flow projections, debt structure and DSCR into one coherent structure. The numbers must tell a logical business story – from how much grain the facility can handle, through what revenue and costs it will generate, to whether it can comfortably service its term-loan obligations.
Promoters should avoid shortcuts such as flat occupancy assumptions, understated expenses or oversimplified DSCR, as these often lead to bank queries or later cash-flow stress. The 10,000 MT example and formulas in this guide serve as a framework that must be tailored to your specific capacity (5,000–50,000 MT), business plan and business model, and location realities.
For customised DPR, detailed financial projections, CMA Data and project finance advisory for your grain storage facility, connect with Project Report Bank via www.projectreportbank.com.
CA Manish Gugliya FCA, DISA (ICAI) | 20+ Years of Professional Experience Project Reports | CMA Data | Financial Modelling | Project Finance Advisory www.projectreportbank.com