
Key Takeaways
- A feasibility study for a pulse cleaning and sorting plant must go well beyond machinery cost. It should cover market demand, plant capacity, raw material sourcing, total project cost, revenue model, operating profitability, working capital, financial analysis and bankability. Machinery price alone-whether ₹16 lakh for a mini dal mill or ₹30 lakh for a 2 T/hr chana dall plant-cannot determine whether the project is commercially viable.
- A pulses processing plant feasibility study should quantify expected ROI and internal rate of return using realistic capacity utilisation, processing recovery, operating costs and conservative margin assumptions. Overstating utilisation in the early stages or ignoring seasonal raw material constraints inflates returns and misleads both promoters and lenders.
- Banks and investors in India scrutinise DSCR, break-even capacity utilisation, working capital cycle and promoter contribution before approving project finance. A project that looks profitable on paper but cannot generate adequate cash to service its term loan is unlikely to receive financing.
- Sensitivity analysis across optimistic, base-case and downside scenarios is essential. A single-scenario projection does not help promoters or bankers assess the real risk profile of the investment.
- Project Report Bank, led by CA Manish Gugliya, FCA, DISA (ICAI), prepares project-specific DPRs and financial models from first principles rather than reusing generic templates. Customised feasibility work reduces costly mistakes and improves the credibility of bank loan proposals.
1. Introduction to Pulse Cleaning & Sorting Plant Feasibility
A pulse cleaning, grading and colour-sorting plant is a processing facility that receives uncleaned raw pulses and, through various unit operations-pre-cleaning, de-stoning, size grading, aspiration, density separation and optical colour sorting-delivers cleaned, graded and packed output ready for wholesale, retail or export markets. This is distinct from a full dal mill, which also dehusks and splits pulses. A standalone cleaning and sorting plant focuses specifically on removing foreign matter, stones, damaged grains and discoloured kernels to produce whole, cleaned pulses of uniform quality.
Typical equipment in these plants ranges from a 1 T/hr pulses vibro cleaner (approximately ₹6 lakh) to integrated lines with optical sorters delivering 98–99% sorting accuracy, where total machinery investment can cross ₹1.5–3.0 crore for medium and large capacities. The total project investment for a commercially viable plant generally falls in the range of ₹1.75 crore to ₹8 crore or more, depending on capacity, automation level and whether the plant is designed for domestic or export-grade processing.
A feasibility study evaluates the viability of a proposed project of this nature before capital is committed. It provides a roadmap to minimise investment risks by examining not just technical fit, but also demand, availability of raw materials, plant capacity planning, utilities, manpower, the operating model, and detailed financial analysis including ROI, IRR, DSCR and break-even. Without this structured assessment, promoters risk overestimating returns or underestimating working capital, both of which can undermine the venture after it begins.
A feasibility study also includes a market and demand analysis for processed crops, establishing whether the proposed project has sufficient commercial foundation. This is where professional advisory becomes important. At Project Report Bank, led by CA Manish Gugliya, FCA, DISA (ICAI), the approach is to convert technical concepts into bankable financial projections and rational investment decisions, using project-specific assumptions rather than generic templates.
2. Industry Overview and Demand for Cleaned Pulses
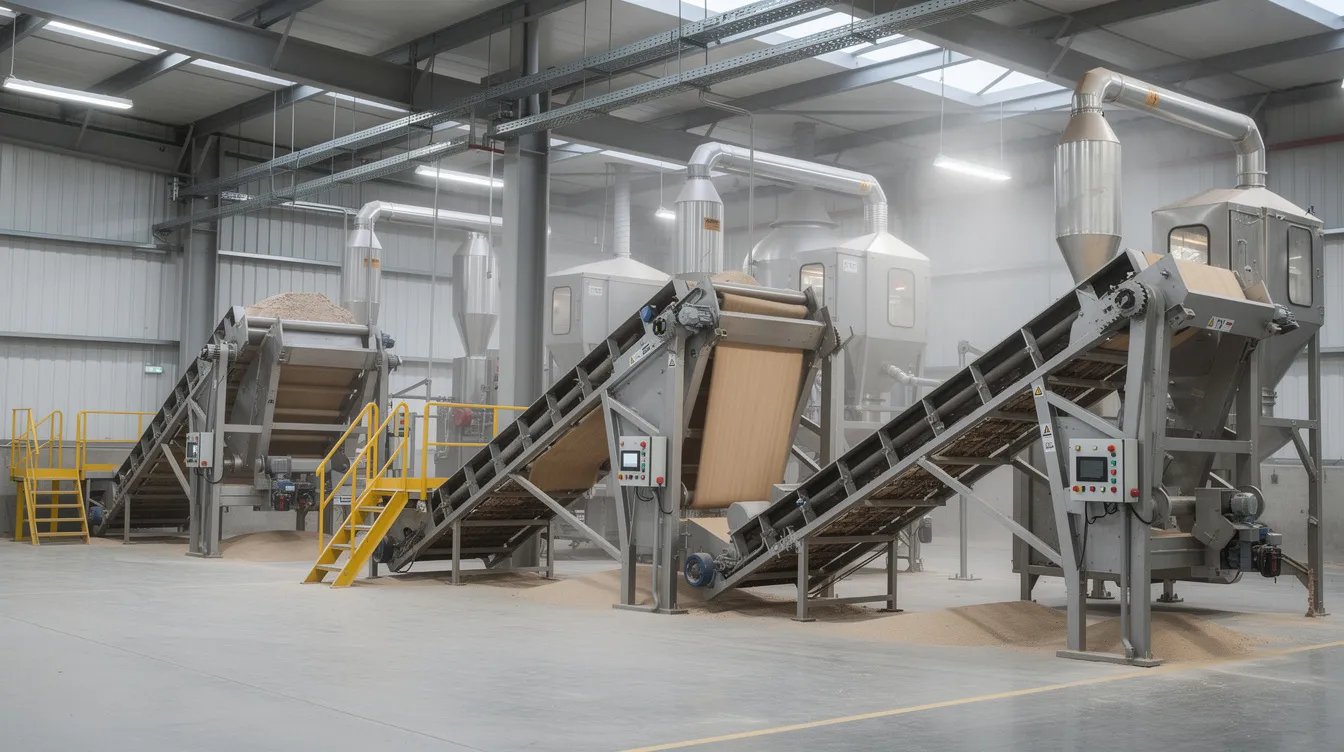
India produces approximately 14.5 million tonnes of pulses annually, spanning major varieties such as chana (chickpea), tur (pigeon pea), masoor (lentil), urad and moong. Despite this large production base, a substantial share of pulses reaching consumers historically contained foreign matter, damaged grains and inconsistent sizing. That reality is shifting rapidly.
Consumer preferences have moved decisively towards cleaned, graded and packed pulses-whether branded dals on retail shelves, export-quality whole grains, or ready-to-cook products. FBO and FSSAI norms now limit permissible foreign matter, discolouration and other defects in packed food products. Industrial buyers-large dal mills, modern retailers, food processors and exporters-increasingly insist on standardised cleaning with 98–99% sorting accuracy delivered through mechanised processing lines. Market analysis across the sector estimates growing local, regional and export demand for cleaned pulses, driven by organised retail expansion, rising per capita consumption and stricter quality enforcement.
The global pulses market was valued at USD 103.25 billion in 2025, and the market is expected to reach USD 140.23 billion by 2034. This growth trajectory reflects expanding demand across both developing and developed markets, reinforcing the opportunity for well-located Indian processing facilities.
Regional processing hubs have developed around states with high pulse production-Madhya Pradesh (Indore), Andhra Pradesh and Telangana (Hyderabad), Gujarat (Junagadh, Ahmedabad), Karnataka (Bengaluru, Mangaluru)-and near ports for export logistics. Proximity to mandis, FPO aggregators and target markets directly affects raw material cost, transportation expense and the overall competitiveness of the business. A plant located far from both its supply base and its buyers will face margin compression that no amount of technology can offset.
3. Plant Configurations and Capacity Options
Pulse cleaning and sorting plants can be configured in several ways, and the choice of configuration should be driven by the promoter’s business model, target customers and capital availability.
Common configurations include:
- Standalone pulse cleaning and sorting plant (no dehusking or splitting), focused on delivering cleaned whole pulses.
- Integrated pulses processing plant combining cleaning, grading, dehusking and splitting-essentially a dal mill with advanced cleaning capabilities. For reference, a dal mill project report covers the full spectrum of such integrated operations.
- Job-work sorting units that serve multiple dal mills and traders who prefer outsourcing their cleaning and sorting requirements.
Capacity options and indicative costs:
| Configuration | Hourly Capacity | Indicative Total Project Cost |
|---|---|---|
| Small / semi-automatic | ~1 TPH | ₹1.75–2.25 crore |
| Medium / automatic | 2–5 TPH | ₹3–8 crore |
| Large / export-grade | 5–10 TPH+ | ₹7–10+ crore |
A proposed processing facility with a capacity of 50,000 MT per annum (roughly equivalent to a 5–6 TPH plant operating approximately 280 days, 16 hours per day) represents a common benchmark for medium-to-large commercial operations. The proposed plant’s annual processing capacity of 50,000 MT requires both adequate raw material supply and confirmed or reasonably anticipated off-take.
Capacity selection should depend on local raw material volumes, target customers and the promoter’s risk appetite rather than simply choosing the maximum available throughput. Very low capacity-a mini dal mill alone-may limit profitability because fixed costs (building, electricals, basic manpower) do not scale down proportionally. Conversely, oversized plants may struggle with utilisation and under-recovery of fixed costs, particularly if the client base is not established before commissioning.
4. Raw Materials, Inflows and Quality Requirements
The primary raw material for a pulse cleaning plant is uncleaned pulses sourced from mandis, FPOs, aggregators or directly from farmers. The variety-chana, tur, urad, moong, masoor-matters because each has different impurity profiles, grain sizes, and market premiums.
Seasonal fluctuations affect raw material availability for pulse processing significantly. Chana arrives primarily in March–April, tur earlier in the season, and moong in different windows depending on the region. During peak arrival, prices are lower but procurement must be well-planned for volume. During lean months, raw material costs rise and availability tightens. Plant capacity and throughput must match anticipated raw material supply during harvest to avoid both idle capacity and missed procurement windows.
Assumed Raw Material Quality Parameters:
| Parameter | Typical Range | Effect on Saleable Output |
|---|---|---|
| Foreign matter (dust, stones) | 3–5% by weight | 1–2% or more lost after cleaning |
| Damaged / discoloured grains | 1–2% | Higher rejection in colour sorter, premium loss |
| Broken grains | 1–2% | Reduced market grade, price realisation affected |
| Moisture content | 12–14% (ideal ~11%) | May need drying; reject elevated lots |
These parameters directly affect processing recovery. Common recovery for cleaned whole pulses is approximately 70–75%, meaning 25–30% of the input weight may be lost as waste, rejections and cleaning residue. Higher foreign matter in the input pushes recovery lower and raises waste disposal costs.
Realistic raw material pricing and quality assumptions are critical inputs to the financial analysis. If the feasibility study assumes uniformly clean raw material at below-market prices, the resulting IRR and break-even calculations will be misleading. Procurement assumptions should factor in variety-specific mandi rates, transportation costs and quality-grade discounts.
5. Technical Feasibility and Process Flow
The process flow for a pulse cleaning and sorting line generally follows this sequence:
Intake & Raw Material Handling → Pre-Cleaning (aspiration, screens) → De-Stoning → Grading / Sieving → Gravity Separation → Optical Colour Sorting → Final Packing → Storage & Dispatch
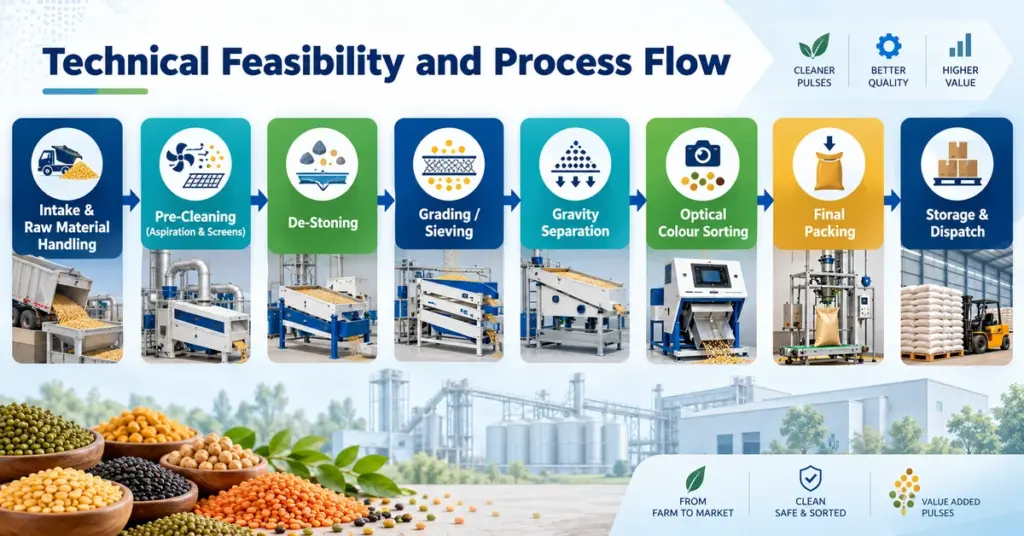
Each unit operation serves a specific purpose:
- Pre-cleaner / air-screen: removes coarse dust, light foreign matter and oversized debris.
- De-stoner: separates stones, heavy impurities and inert material.
- Vibro cleaner and grader: size-classifies grains into uniform grades.
- Gravity separator: separates by density, removing immature, pest-affected or shrivelled grains.
- Optical colour sorter: uses CCD, RGB or NIR sensors to identify and eject discoloured, insect-damaged or foreign kernels. Advanced lines can achieve purity levels of 98–99.99% under favourable conditions.
High-efficiency cleaning equipment minimises grain breakage during processing, which is important because excessive breakage reduces the quantity of whole, premium-grade output. Equipment selection impacts the processing efficiency of pulses directly-undersized or poorly maintained machines create bottlenecks and lower recovery.
Setting up a pulses processing plant requires evaluating technological requirements carefully. Technical evaluation determines optimal plant capacity based on raw material availability, target throughput and customer quality expectations. Automated, PLC-based lines with electronic controls require higher initial investment and skilled operators, but deliver consistent results and lower per-tonne labour costs.
For detailed equipment-level pricing and technical specifications, readers may refer to the separate discussion on pulse cleaning, grading and sorting machinery cost. Feasibility studies should also determine the necessary operational and quality checks for consistency across batches.
The feasibility study should include equipment specifications, vendor shortlisting and power requirements (typically 100 kW for small plants up to 200+ kW for large installations) to confirm technical practicality at the chosen site.
6. Location, Land, Building and Infrastructure
Location analysis assesses proximity to pulse-producing agricultural hubs and target markets. Location logistics should minimise transportation costs and optimise raw material access-a plant situated close to mandis or FPO aggregation centres reduces inbound freight and enables better procurement flexibility.
Other location factors include road connectivity for outbound dispatch, reliable electricity supply, availability of skilled and unskilled labour, and state-level policies affecting land cost and industrial incentives.
Indicative land requirements:
| Plant Capacity | Land Area | Approximate Built-Up Area |
|---|---|---|
| 1–2 TPH | 0.5–1.0 acre | 6,000–8,000 sq.ft. |
| 3–5 TPH | 1.0–2.0 acres | 12,000–15,000+ sq.ft. |
| 5–10 TPH | 2.0–3.0 acres | 15,000+ sq.ft. |
For a detailed discussion on building layout, process flow and material movement, refer to the article on pulse cleaning and packing plant capacity, land and layout.
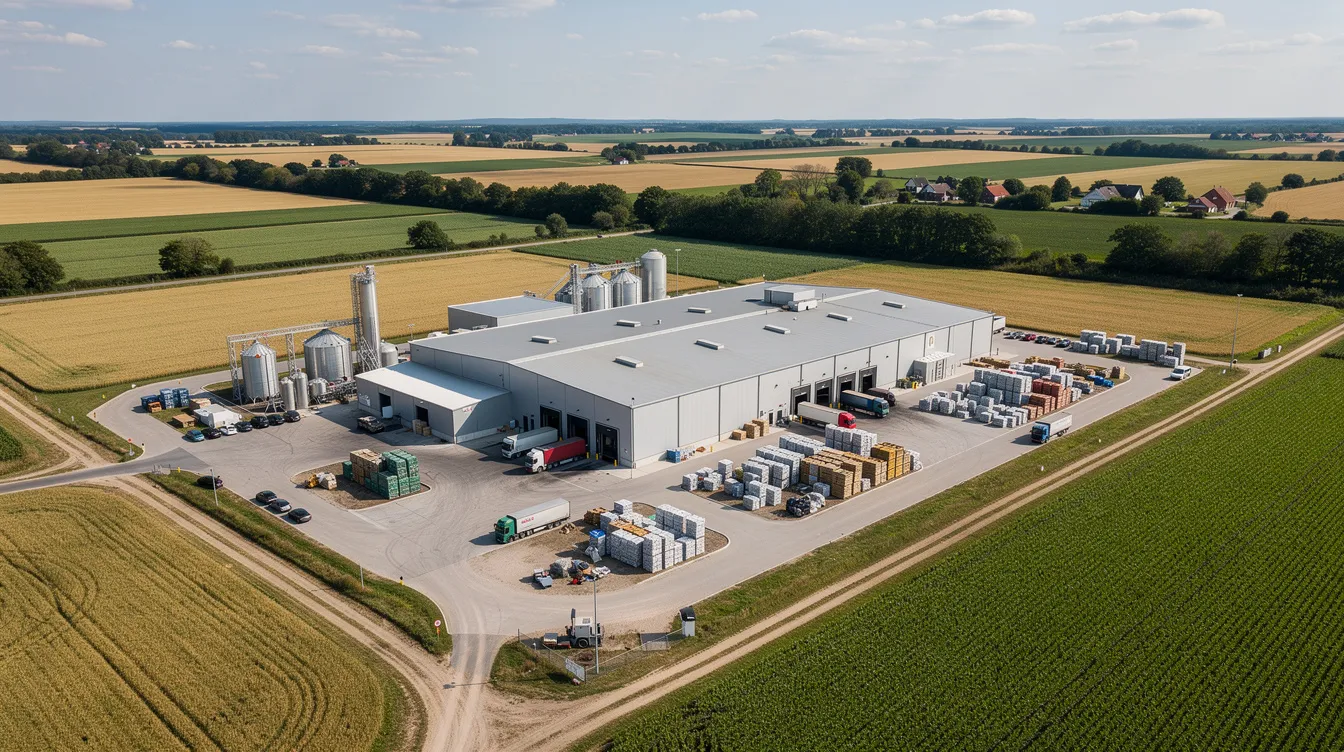
Key infrastructure elements include factory shed, raw material godown, finished goods warehouse, office block, weighbridge (if feasible), internal roads, drainage, power substation or transformer, fire safety and dust extraction systems. Ceilings and flooring should meet hygienic requirements applicable to food processing.
Civil construction cost must be included in fixed capital with clearly documented built-up area and per sq.ft. cost assumptions. Land cost varies substantially between rural industrial estates and peri-urban locations, and this variation can materially alter the total project economics.
7. Estimating Plant & Machinery Investment
Machinery constitutes a substantial share of fixed capital-typically 35–60% depending on the level of automation. Below is an illustrative machinery cost breakdown for a mid-sized 4 TPH pulse cleaning and sorting line, based on approximate market ranges as of 2025–2026.
Illustrative Machinery Investment (4 TPH Pulse Cleaning & Sorting Line):
| Equipment | Indicative Cost (₹ Lakh) |
|---|---|
| Pre-cleaner / air-screen (4–6 TPH) | 3.0–5.0 |
| Vibro cleaner & grader | 3.5–5.0 |
| De-stoner | 4.0–8.0 |
| Gravity separator | 6.0–12.0 |
| Bucket elevators & conveyors | 5.0–10.0 |
| Optical colour sorter (3–5 TPH) | 20.0–40.0 |
| Compressor & pneumatic system | 3.0–6.0 |
| Packing machine (semi-automatic) | 3.0–8.0 |
| Electrical panels, starters, PLC | 4.0–8.0 |
| Dust collection system | 2.0–4.0 |
| Sub-total (ex-works) | 53.5–106.0 |
| Freight, erection & commissioning (~15%) | 8.0–16.0 |
| GST on machinery | As applicable |
| Contingency on machinery (~5%) | 3.0–5.0 |
| Total Machinery (indicative) | ~65–130 lakh |
These figures are approximate. Quoted prices vary by brand, specification, automation level and after-sales support. The optical colour sorter for pulses alone can range from ₹8–15 lakh for small (0.5–1 TPH) units to ₹30–60 lakh or more for larger AI/NIR-based models, making it one of the most significant line items.
A final DPR must be based on vendor quotations, not generic brochures or catalogue prices. For comprehensive machinery-level details, the article on pulse cleaning, grading and sorting machinery cost provides deeper coverage.
8. Total Project Cost and Capital Structure
Pulses processing plant setup costs include capital investments and operating expenses. A comprehensive financial model justifies the initial capital outlay for the proposed project by bringing together all cost heads into an integrated view.
Illustrative Total Project Cost (4 TPH Pulse Cleaning & Sorting Plant):
| Component | Amount (₹ Lakh) |
|---|---|
| Land (1.5 acres, if purchased) | 30–60 |
| Site development | 5–10 |
| Factory building & storage (12,000 sq.ft.) | 55–80 |
| Plant & machinery (installed) | 90–130 |
| Electrical installation & utilities | 10–18 |
| Miscellaneous fixed assets (furniture, lab, vehicles) | 8–15 |
| Pre-operative expenses (interest, professional fees) | 8–12 |
| Contingency (5–8% of fixed capital) | 12–20 |
| Fixed Capital | 228–345 |
| Working capital margin (promoter’s share) | 25–40 |
| Total Project Cost | 253–385 |
| Promoter contribution (equity, ~30%) | 76–115 |
| Proposed term loan (~70%) | 177–270 |
Financial viability is assessed through capital and operational expenditure calculations together. Investment analysis calculates total capital expenditure for the project, and the means of finance must match the project structure.
Typical debt-equity ratios applied by banks for MSME agro-processing projects range from 1.5:1 to 2:1, though exact norms differ by bank and scheme. The pulse cleaning, grading and packing plant setup cost article covers how fixed capital cost structures vary with plant scale and automation.
All amounts above are illustrative and should be updated using current quotations and site-specific information while preparing an actual DPR. An underestimated project cost creates a funding gap during implementation; an unnecessarily inflated estimate weakens the economics.
9. Revenue Models for Pulse Cleaning & Sorting Plants
The revenue model fundamentally shapes the financial profile of the business-its margins, inventory exposure, working capital cycle and risk characteristics.
Revenue models commonly adopted:
- Pure job-work cleaning and sorting: The plant processes pulses owned by dal mills, traders or exporters for a per-tonne fee. Inventory risk is low, working capital needs are modest, but margins are thin (typically 8–12% gross profit) and the business depends on client volumes and payment terms.
- Own-account procurement and trading: The plant purchases raw pulses, processes them, and sells cleaned output in bulk or under its own brand. Margins per tonne can be higher, but the business carries raw material price risk, stock holding costs and higher working capital requirements.
- Integrated sorting and branded packing: Combines cleaning with consumer-grade packaging, targeting retail channels. Requires investment in packing lines, branding and distribution, but commands premium pricing.
- Export-grade processing: Serves international buyers with strict quality specifications-zero visible foreign matter, tight defect tolerances, certified residue levels. Justifies investment in advanced optical sorters and quality labs.
- Hybrid job-work and own-trading: Allocates part of capacity to job-work (stable income) and part to own trading or branded sales (higher margin). Many promoters find this combination balances risk and return.
The detailed pulse cleaning, grading and packing job-work business model article examines the pros and cons of job-work-based revenue in greater depth.
The feasibility study should quantify revenue, gross margin and working capital impact separately for each revenue stream rather than mixing them into a single blended assumption. Job-work income and trading turnover should never be compared without considering their fundamentally different inventory, margin and working capital characteristics.
10. Operating Costs and Processing Profitability
Understanding the cost structure is essential for determining whether the plant can achieve sustainable profitability.
Major operating cost heads:
- Raw materials (for own trading model)-raw uncleaned pulses account for 88–92% of operating expenses in a trading-based operation, making procurement efficiency the single most important cost factor
- Power and fuel (₹7–9 per kWh industrial tariff in many states; 100–200+ kW connected load)
- Labour: skilled operators for optical sorters and PLC systems, plus unskilled labour (6–10 per shift for small plants, 25–40 for larger ones)
- Repairs and maintenance (spares, periodic servicing)
- Packing materials (bags, pouches, labels)
- Rent or lease charges, if applicable
- Administrative overheads and selling expenses
Gross profit margins for pulses processing range between 8–12% in job-work operations and may be somewhat higher for own-account trading, though the latter carries greater price risk.
Processing recovery directly drives profitability. When promising 99% sorting accuracy, it is important to understand that while purity of the final output may reach 99%+, saleable weight as a proportion of input is typically only 70–75%. Cleaning losses-dust, broken grains, foreign matter and discoloured kernels-reduce the saleable quantity.
The article on pulse cleaning and grading processing cost, recovery and profitability provides a detailed breakdown of how per-tonne processing cost and recovery determine contribution margin.
Illustrative Per Tonne Cost Build-Up:
| Cost Head | Job-Work (₹/Tonne) | Own Account (₹/Tonne) |
|---|---|---|
| Raw material procurement | N/A | 45,000–65,000 |
| Power & fuel | 250–400 | 250–400 |
| Labour | 150–250 | 150–250 |
| Packing material | 100–200 | 200–400 |
| Maintenance & spares | 80–120 | 80–120 |
| Overheads & admin | 100–200 | 200–350 |
| Total variable processing cost | ~680–1,170 | ~45,880–66,520 |
Realistic assessments of power tariffs, labour rates and maintenance frequency are crucial to avoid overstating EBITDA margins in the feasibility report.

11. Working Capital Requirements and Cycle
Working capital needs differ substantially between business models. A job-work plant primarily carries receivables and operating expenses, with minimal inventory. An own-trading plant, however, must finance raw material inventory, finished stock, receivables and day-to-day operating expenses.
Typical working capital cycle for an own-account operation:
| Component | Holding Period |
|---|---|
| Raw material inventory | 30–60 days |
| Work-in-progress / finished goods | 5–15 days |
| Receivables | 30–45 days (domestic); longer for exports |
| Less: Creditors | 20–30 days |
| Net working capital cycle | ~45–90 days |
Banks expect detailed working capital projections in the DPR and CMA Data, including operating cycle calculations, stock statements and cash budgets. The margin on working capital-the promoter’s share-is typically 20–25% for stocks and 25% for book debts, depending on the bank’s policy.
The article on pulse cleaning plant working capital and cash credit requirements covers drawing power calculations and stock statement norms in greater detail.
Under-estimating working capital not only strains liquidity but also forces the plant to operate below capacity when raw material cannot be procured. This directly undermines the production volume, revenue and financial analysis prepared in the feasibility study.
12. Financial Projections for a Pulses Processing Plant
A five-year financial projection forms the backbone of any bankable feasibility study. Project reports must project future cash flows and assess financial risks to enable informed decision-making by both promoters and lenders.
Illustrative 5-Year Projection (4 TPH Pulse Cleaning & Sorting – Job-Work Model):
| Parameter | Year 1 | Year 2 | Year 3 | Year 4 | Year 5 |
|---|---|---|---|---|---|
| Capacity utilisation (%) | 50% | 60% | 72% | 78% | 80% |
| Annual quantity processed (MT) | 10,080 | 12,096 | 14,515 | 15,725 | 16,128 |
| Processing income (₹ lakh) | 120.0 | 145.0 | 174.0 | 189.0 | 193.5 |
| Operating expenses (₹ lakh) | 78.0 | 90.0 | 103.0 | 110.0 | 112.0 |
| EBITDA (₹ lakh) | 42.0 | 55.0 | 71.0 | 79.0 | 81.5 |
| Depreciation (₹ lakh) | 16.0 | 14.5 | 13.0 | 12.0 | 11.0 |
| Interest (₹ lakh) | 18.0 | 16.0 | 14.0 | 12.0 | 10.0 |
| PBT (₹ lakh) | 8.0 | 24.5 | 44.0 | 55.0 | 60.5 |
| Tax (~25%) (₹ lakh) | 2.0 | 6.1 | 11.0 | 13.8 | 15.1 |
| PAT (₹ lakh) | 6.0 | 18.4 | 33.0 | 41.2 | 45.4 |
Assumed: 280 operating days, 18 hours/day, processing charge ₹1,000–1,200/tonne. All figures are illustrative.
Production volumes must reconcile with plant capacity and realistic operating days. Graduated capacity utilisation-50% in Year 1, expanding to 75–80% by Year 3–4-is more credible than projecting immediate high utilisation unless supported by confirmed off-take contracts.
A comprehensive financial model justifies the initial capital outlay by demonstrating that projected revenues can cover operating costs, service debt and provide a reasonable return on equity. The article on pulse cleaning and packing plant financial projections, CMA Data and DSCR explains how these projections feed into CMA Data and bank assessment.
13. Break-Even Analysis and Cost–Volume–Profit Insight
Break-even analysis identifies minimum required sales to cover operational costs and is a key output expected by both promoters and bankers.
In the context of a pulse cleaning plant:
- Fixed costs include depreciation, interest on term loan, fixed salaries, rent or lease, insurance and building maintenance.
- Variable costs include power consumption proportional to throughput, packing material, consumables, daily-wage labour and transport.
Break-even formula:
Break-even volume (tonnes) = Total Fixed Costs ÷ Contribution per tonne
Contribution per tonne = Processing income per tonne − Variable cost per tonne
Illustrative calculation:
- Annual fixed costs: ₹42 lakh
- Processing income per tonne: ₹1,100
- Variable cost per tonne: ₹700
- Contribution per tonne: ₹400
- Break-even volume: 42,00,000 ÷ 400 = 10,500 tonnes
- Break-even utilisation: 10,500 ÷ 20,160 (full capacity at 80%) ≈ 52%
A plant breaking even at approximately 52% utilisation has reasonable headroom. However, plants sized too large relative to assured volume may struggle to reach break-even consistently, especially during the initial years when customer relationships are being established and production is ramping up.
Break-even utilisation should be computed for each revenue model (job-work versus own-trading) separately, as the contribution margins differ materially between the two.
14. Return on Investment (ROI) and Profitability Ratios
Return on investment provides a snapshot of the productivity of capital deployed in the venture.
Accounting ROI:
ROI = Average Annual Profit After Tax ÷ Total Capital Employed × 100
Using the projections from Section 12 (stabilised years 3–5):
- Average annual PAT (Years 3–5): ~₹39.9 lakh
- Total capital employed: ~₹300 lakh (illustrative)
- ROI on capital employed: 39.9 ÷ 300 × 100 ≈ 13.3%
Return on Equity (ROE):
- Average annual PAT (Years 3–5): ~₹39.9 lakh
- Promoter’s equity: ~₹90 lakh
- ROE: 39.9 ÷ 90 × 100 ≈ 44.3%
The distinction matters. ROI on total capital employed tells investors whether the project generates sufficient return to justify the full investment (debt plus equity). ROE tells the promoter what return their personal funds are earning after the cost of debt has been serviced. For agro-processing projects in India, ROI on capital employed in the range of 12–20% under stable conditions is generally considered reasonable, though actual outcomes depend entirely on project-specific assumptions.
While ROI is helpful for comparing investments, it does not directly capture the time value of money the way IRR does. The feasibility document should present ROI calculations alongside detailed profit and loss projections, not in isolation.
15. Internal Rate of Return (IRR) and Investment Decision-Making
Internal rate of return projections are part of financial viability assessment for any significant capital project. IRR is a percentage estimate for evaluating investments-specifically, it is the discount rate at which the net present value of project cash flows becomes zero.
Key principles:
- An IRR of 20% indicates a 20% annual return on the investment, when measured through discounted cash flow methodology.
- Higher IRR percentages are preferred for investment comparisons. An investor comparing two projects should, all else equal, prefer the one with a higher IRR.
- IRR can be negative if an investment loses money-a signal that the project destroys value rather than creating it.
- IRR helps rank capital projects based on profitability, making it useful when a promoter must choose between alternative configurations or capacities.
Project IRR versus Equity IRR:
- Project IRR is computed on total project cash flows before financing (i.e., cash available after operating costs and investment outflows, without considering interest and loan repayment). It reflects the return generated by the project assets.
- Equity IRR is computed on cash flows available to the promoter after interest and principal servicing. It reflects the return on the promoter’s own money.
Illustrative Project IRR calculation (simplified):
Using the sample pulse cleaning plant over 10 years, with initial investment of ₹300 lakh, annual net operating cash flows (after tax, before debt service) starting at ₹24 lakh and growing to ₹57 lakh by Year 5, stabilising thereafter, and terminal working capital recovery, the project IRR may work out to approximately 16–20% depending on assumptions.
The net present value at a discount rate of 14% (approximate cost of capital plus risk premium) can be computed alongside. If NPV is positive at this rate, the project clears the hurdle. The current value of future cash flows, when discounted at the internal rate, equals the initial outlay by definition.
Banks do not rely solely on IRR but do consider whether the project IRR significantly exceeds the nominal cost of debt and a risk-adjusted hurdle rate. An IRR from a pulses processing plant feasibility study is only as reliable as its underlying assumptions on plant capacity utilisation, margins and operating costs.
16. DSCR Analysis and Debt Repayment Capacity
The Debt Service Coverage Ratio measures whether the project can comfortably service its term loan obligations from operating cash flow. It is perhaps the single most scrutinised ratio during bank appraisal.
DSCR Formula:
DSCR = Cash Available for Debt Service ÷ (Annual Principal Repayment + Interest)
Cash available for debt service is typically derived from EBITDA less taxes and adjusted for working capital changes.
Illustrative DSCR Calculation:
| Parameter | Year 1 | Year 2 | Year 3 | Year 4 | Year 5 |
|---|---|---|---|---|---|
| EBITDA (₹ lakh) | 42.0 | 55.0 | 71.0 | 79.0 | 81.5 |
| Less: Tax | 2.0 | 6.1 | 11.0 | 13.8 | 15.1 |
| Cash available | 40.0 | 48.9 | 60.0 | 65.2 | 66.4 |
| Principal repayment | 18.0 | 20.0 | 22.0 | 24.0 | 26.0 |
| Interest | 18.0 | 16.0 | 14.0 | 12.0 | 10.0 |
| Total debt service | 36.0 | 36.0 | 36.0 | 36.0 | 36.0 |
| Annual DSCR | 1.11 | 1.36 | 1.67 | 1.81 | 1.84 |
Average DSCR (Years 1–5): ~1.56
Many banks consider an average DSCR above 1.5 to be comfortable, though each lender applies its own policy and risk-based thresholds. A DSCR below 1.0 in any year means the project cannot fully service its debt from operations in that period-a serious concern.
Weak DSCR in initial years can sometimes be addressed through appropriate loan structuring, including moratorium on principal repayment during the first 6–12 months. This should be evaluated and proposed during the feasibility stage itself, not discovered after the loan is sanctioned.
The article on pulse cleaning and packing plant financial projections, CMA Data and DSCR provides detailed guidance on how DSCR is derived from projected financial statements.
17. Bank Finance Options and CMA Data for Pulses Processing Plants
Bank finance for a pulse cleaning plant typically involves a combination of:
- Term loan for plant & machinery, building and allied fixed assets.
- Cash credit or overdraft for working capital (financing raw material stock, finished goods and receivables).
- Bill discounting or LC limits for promoters engaged in export or institutional trade.
Bank expectations:
- Promoter contribution of 25–35% of total project cost for MSME agro-processing units.
- Collateral security: immovable property, first charge on machinery and assets financed, hypothecation of stocks and book debts.
- Documentation: professionally prepared DPR, CMA Data for 5–7 years, projected financial statements (P&L, balance sheet, cash flow), ratio analysis and repayment schedule.
CMA Data for a pulses processing plant serves a specific purpose: it presents projected balance sheets, profit and loss accounts, fund flow statements and ratio analysis in the format banks use for credit appraisal. A bankable feasibility study must align project cost, means of finance, loan terms, DSCR trends and security coverage. Inconsistent numbers undermine credibility during appraisal.
Loans to food and agro-processing sectors may qualify under Priority Sector Lending norms, which can be advantageous. However, eligibility depends on the specific lending bank’s policy and the project’s compliance with applicable criteria.
Project Report Bank assists clients in preparing DPRs and CMA Data but does not assure sanction or guarantee any particular interest rate or subsidy.
18. Sensitivity Analysis and Risk Assessment
A pulse cleaning plant feasibility study built around a single optimistic projection is incomplete. Sensitivity analysis tests how the project performs when key assumptions deviate from the base case, and it is essential for both promoters and bankers to understand the robustness of the proposed project.
Three-Scenario Comparison (4 TPH Pulse Cleaning Plant, Job-Work Model):
| Parameter | Optimistic | Base Case | Downside |
|---|---|---|---|
| Capacity utilisation (Year 3) | 80% | 72% | 58% |
| Processing charge (₹/tonne) | 1,250 | 1,100 | 950 |
| Power tariff (₹/kWh) | 7.0 | 8.0 | 9.5 |
| Recovery rate | 76% | 73% | 68% |
| EBITDA (Year 3, ₹ lakh) | 88 | 71 | 48 |
| ROI on capital (stabilised) | ~17% | ~13% | ~8% |
| Project IRR | ~22% | ~18% | ~11% |
| Average DSCR | 1.85 | 1.56 | 1.10 |
Key risks to be tested in scenarios:
- Lower job-work volumes due to customer concentration or market shifts
- Higher electricity tariffs or unreliable power supply (sorters and conveyors are power-sensitive)
- Machine breakdowns and spare parts availability, especially with imported equipment
- Deterioration in raw material quality, lowering recovery and increasing waste
- Delayed debtor realisation or order cancellations
- Regulatory changes or inflation in compliance costs
The downside scenario above shows the project barely servicing its debt (DSCR 1.10) and delivering a thin ROI. High-debt projects with margins this thin should be stress-tested more rigorously in the feasibility study before the promoter proceeds to implement the plant.
Sensitivity analysis is not about predicting the future. It is about understanding which assumptions, if they go wrong, will create the most financial stress-and whether the promoter can absorb that stress.
19. Regulatory, Quality and Compliance Considerations
Regulatory compliance identifies the required licences and environmental approvals for a pulse cleaning plant. Regulatory and environmental compliance is essential for food processing facilities, and the costs of compliance should not be treated as an afterthought.
Key statutory and regulatory requirements:
- Business registration (company, LLP or proprietorship)
- FSSAI licence (mandatory for food processing businesses)
- Factory licence and labour law compliance (ESI, PF)
- Pollution control board consents (if required for dust emissions, wastewater)
- Food safety standards including hygiene, pest control and batch traceability
Dust management and waste disposal methods must be evaluated for regulatory compliance. Pulse cleaning generates significant dust and light waste material, which requires proper extraction, collection and disposal systems.
For export-oriented plants, additional buyer-driven requirements apply: zero visible foreign matter, certified residue levels and tight defect tolerances. The export-grade pulse cleaning, colour sorting and packing plant project report covers these requirements in greater detail.
Food safety standards are critical in the establishment of processing facilities, and initial and ongoing compliance costs-certifications, testing, audits-must be factored into the operating cost estimates in the feasibility study. Robust quality and compliance systems can support premium pricing and long-term contracts, improving project viability.
20. Alignment of Technical Design with Financial Feasibility
The technical design of the plant-capacity of vibro cleaners, rating of the colour sorter, number of processing lines, level of automation-must be aligned with the intended business model.
Over-investment in highly automated technology for low throughput volumes reduces ROI. Conversely, under-investment can limit the plant’s ability to meet customer specifications-for example, 99% sorting accuracy required by export buyers-resulting in lost orders and reduced revenue.
The feasibility study should compare at least two technical options with separate financial analysis for each. For instance:
- Option A: Simple cleaning plant (no colour sorter) at ₹1.5 crore total investment, targeting bulk domestic markets.
- Option B: Fully integrated cleaning, colour sorting and packing plant at ₹3.5 crore total investment, targeting branded and export markets.
Each option has different capital costs, operating costs, revenue potential and risk profiles. Selection should be driven by long-term strategy and customer expectations rather than initial machinery discounts alone.
The trade-offs between sorter throughput, precision and price are discussed in the article on optical colour sorter for pulses: technology, capacity and price. This technology selection significantly affects both capital expenditure and the quality premium the plant can command.
21. Preparation of a Detailed Project Report (DPR)
A professionally prepared DPR for a pulses processing plant should contain:
- Project background and rationale
- Promoter profile and financial position
- Technical details: process, capacity, machinery, layout, utilities
- Market study and customer assessment
- Project cost and means of finance
- Financial projections (P&L, balance sheet, cash flow for 5–10 years)
- Working capital assessment
- Risk analysis, sensitivity analysis and scenario modelling
- Conclusion on financial feasibility
The DPR should clearly define plant capacity, product mix, raw material sourcing strategy, job-work versus trading split and targeted customer segments. All financial tables should be internally consistent-plant capacity matching production volume, production volume matching sales, cash flows tying back to balance sheet changes. This document should serve as a decision-making tool for the promoter, not merely a formality for bank submission.
At Project Report Bank, under CA Manish Gugliya, the focus is on customised DPRs built from first principles. Each project’s assumptions-cost, capacity, location, raw material, demand-are independently assessed using vendor quotations, survey of raw material prices, location-specific building and land costs, applicable electricity tariffs and conservative financial inputs. This approach produces a document that promoters can understand and confidently discuss with financial institutions.
22. Role of Professional Advisors in Feasibility and Finance
A Chartered Accountant-led advisory practice like Project Report Bank supports entrepreneurs through financial modelling, CMA Data preparation, DSCR analysis and loan structuring for pulse cleaning plants. Professional involvement ensures that assumptions are conservative yet realistic, highlighting potential stress points such as plant under-utilisation, margin compression or seasonal cash flow volatility.
CA Manish Gugliya’s experience across multiple manufacturing and agro-processing sectors helps in benchmarking key ratios and verifying that projected returns are commercially sensible rather than theoretically attractive. Advisors also help promoters prepare for bank queries and present their pulses processing project in a clear, data-backed manner during appraisal meetings.
Professional feasibility work is an investment in reducing costly mistakes. The cost of a properly prepared DPR and financial model is negligible compared to the consequences of committing ₹2–8 crore to a project whose underlying economics have not been rigorously examined.
23. Conclusion – Using Feasibility Study Findings for Decision-Making
A pulse cleaning plant feasibility study must integrate technical design, plant capacity, raw materials, market demand, operating model and financial analysis-ROI, IRR, DSCR and break-even-into a coherent assessment. The numbers should tell a logical business story, not merely present an attractive top-line turnover. An attractive turnover in a pulses processing plant does not guarantee bankability. Debt servicing capacity, working capital adequacy, promoter contribution and risk assessment are equally important determinants of whether the project should proceed.
The purpose of conducting this analysis is not to produce a document for the bank. It is to help the promoter make an informed decision-including the possibility of resizing the plant, phasing the investment, choosing a different business model, or deferring the project entirely if the numbers do not support the original idea. Establishing a commercially viable facility requires intellectual honesty about what the market can support, what the plant can consistently deliver, and what the financial structure can sustain through both good years and difficult ones.
Entrepreneurs and MSMEs planning a pulse cleaning and sorting facility should approach the feasibility process as a critical phase of investment planning, not a compliance formality. The companies that succeed in this industry are typically those that plan conservatively, execute efficiently and adapt their operations based on actual performance versus original assumptions.
Need a Detailed Project Report, CMA Data, Financial Projections or Bank Finance Proposal for a Pulse Cleaning & Sorting Plant?
CA Manish Gugliya, FCA, DISA (ICAI), provides professional assistance in DPR preparation, financial feasibility studies, project finance assessment and bank loan proposals across India.
Visit www.projectreportbank.com or enquire through the website’s WhatsApp facility to discuss your project requirements.
24. FAQs on Pulse Cleaning Plant Feasibility Study
The following questions address common concerns that arise once promoters begin detailed planning of a pulses processing plant. These answers are general guidance based on professional experience and should be adapted to the specific project location, plant capacity and financing structure.
FAQ 1: What minimum plant capacity is practical for a new pulse cleaning unit?
While mini dal mills and 1 T/hr vibro cleaners are available at modest price points, a commercial pulses processing plant typically starts from about 1–2 T/hr if regular industrial or wholesale clients are targeted. Below this capacity, fixed costs-building, electrical infrastructure, basic manpower, compliance-do not scale down proportionally, and profitability can be elusive.
The right capacity depends on assured raw material volumes and customer demand. For many MSMEs, starting with a 2 T/hr configuration that is scalable to higher throughput through additional lines or shifts offers a practical balance between initial investment, utilisation risk and growth potential.
FAQ 2: How long does it usually take for a pulse cleaning plant to reach stable utilisation?
Most new pulses processing units require 12–24 months to stabilise volumes, optimise machine settings and build a steady customer base. The feasibility study should use lower capacity utilisation assumptions for the first year (typically 50–60%) and ramp up gradually rather than projecting immediate 80–90% utilisation.
Plants operating on a job-work model with pre-committed anchor clients may ramp up faster than purely trading-based operations, since the volume pipeline is partially secured before commissioning.
FAQ 3: Can a pulse cleaning plant be viable on a purely job-work basis?
Pure job-work viability depends on local concentration of dal mills and traders who prefer outsourcing cleaning and sorting rather than installing their own facilities. A job-work plant has lower inventory risk and working capital needs but faces pressure on processing rates and higher dependency on a few customers.
Promoters should assess at least 3–5 potential anchor clients with agreed tentative volumes before committing to a fully job-work model. Diversifying the client base and supplementing with some own-account processing can improve stability.
FAQ 4: How do banks view pulses processing projects compared to other MSME units?
Banks see pulse cleaning and processing plants as part of the agriculture and food processing sector, which is generally well understood and may qualify for priority sector lending. However, each project is assessed on its own merits-promoter experience, collateral security, realistic projections, DSCR and working capital assessment matter more than the sector label.
Professionally prepared DPRs and CMA Data help reduce back-and-forth during appraisal by presenting a coherent picture of the project’s financial viability from the outset.
FAQ 5: How often should feasibility assumptions be revisited after project implementation?
Promoters should compare actual results with DPR assumptions at least quarterly during the first year and annually thereafter. When significant changes occur in raw material prices, power tariffs, interest rates or customer payment behaviour, the financial model should be updated to reflect the new reality.
Such periodic reviews help in making timely corrections-adjusting procurement strategies, renegotiating processing charges or approaching the bank for limit enhancement-and ensure the business stays aligned with its original viability framework.