
Key Takeaways
- Realistic five- to seven-year financial projections, CMA Data and DSCR analysis are mandatory before investing in a pulse cleaning, grading, sorting and packing plant, especially when approaching a bank for a term loan or cash credit facility.
- The financial model must clearly distinguish between own-account trading and processing, pure job-work, hybrid operations, and export-oriented pulse processing, as each carries a fundamentally different revenue mix, operating cost structure and working capital profile.
- Project cost, means of finance, working capital cycle, cash flow and debt service coverage ratio need to be internally consistent across the DPR and CMA Data. Optimistic production capacity utilization or pricing assumptions without matching cash flow are treated as red flags by credit officers.
- Professional CMA Data preparation, projected balance sheets and DSCR working improve bankability but are not a guarantee of loan sanction. They give lenders confidence that the promoter understands the project’s financial viability and downside risks.
- Project Report Bank, led by CA Manish Gugliya, prepares customised DPRs, financial projections and CMA Data for pulse cleaning and packing plants across India, with a focus on conservative, assumption-driven analysis.
Introduction: Why Financial Projections, CMA Data & DSCR Matter for a Pulse Cleaning & Packing Plant
Many Indian entrepreneurs are planning pulse cleaning, grading, colour sorting and packing plants in 2026. The demand outlook is strong: the global pulses market was valued at USD 103.25 billion in 2025 and is expected to reach USD 140.23 billion by 2034, growing at a CAGR estimated at 3.5% from 2026 to 2034. Rising consumer demand for hygienically packed dals, processed pulses increasingly used in ready-to-eat meals, pulses based snacks and nutritious food products is driving investment across the pulse processing sector.
However, banks in India now expect detailed five-year projections, CMA Data and DSCR analysis before approving term loans for such agro-processing projects. Financial projections forecast the company’s finances across sales, profit and cash flow over the projection period. CMA Data is a standardised bank-format set of financial statements used for credit appraisal. The debt service coverage ratio measures whether the project generates sufficient income to meet its obligatory cash payments towards principal repayments and interest obligations.
This article, written from the professional perspective of CA Manish Gugliya (FCA, DISA), practising Chartered Accountant and founder of Project Report Bank with more than 20 years of experience in DPRs, CMA Data and project finance advisory, explains each of these components in practical detail.

Understanding Financial Projections for a Pulse Cleaning & Packing Plant
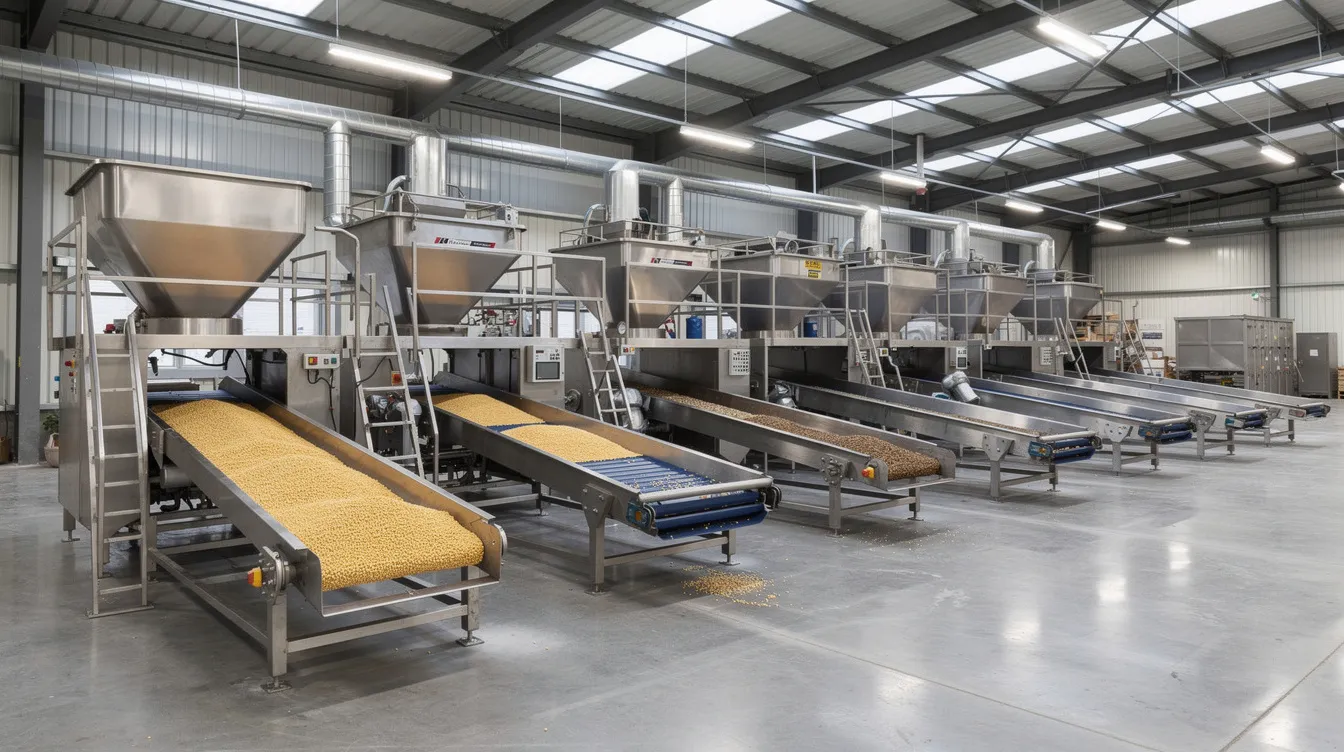
A typical pulse cleaning, grading and packing processing plant, often in the 3–5 TPH capacity range, handles varieties such as tur, chana, masoor, moong and urad through various unit operations including destoning, aspiration, grading, optical colour sorting and packing. A larger pulses processing facility can process 50,000 MT annually, depending on installed plant capacity and shift operations. Financial projections for a pulse processing plant require capital costs and operational expenses forecasting across the full value chain, from raw pulse procurement through cleaning and grading losses, sorting rejects and final despatch. Key components of financial projections include CapEx, OpEx, revenue projections and pro forma financial statements.
Own-account procurement and sale model: The plant buys raw uncleaned pulses, processes them, and sells cleaned and graded pulses in bulk or retail packs. Revenue depends on per-MT processing margin and by-product sale (broken pulses, dust and husk, some of which may find use in animal feed production). This model carries high working capital, inventory risk, and direct exposure to commodity price volatility in raw materials.
Pure job-work or toll-processing model: The plant processes pulses owned by traders, millers or exporters, earning fixed processing charges per MT. Working capital is substantially lower, but revenue depends entirely on annual processing capacity utilisation and contracted volumes.
Hybrid model: Part capacity is used for own-account trading and balance for job-work. Projections must clearly separate trading turnover from job-work income in both revenue and cost lines.
Export-grade operations: Revenue may come from premium-quality supply to exporters or private-label brands, with stricter quality control systems, higher packing costs and better realisation per MT, but also higher compliance costs and longer credit cycles. For those evaluating this segment, the Export-Grade Pulse Cleaning, Colour Sorting & Packing Plant Project Report covers the operational and financial differences in detail.
Financial projections differ significantly between these models in terms of gross profit margins, operating expenses, working capital cycle and DSCR. A dal mill project template should not be copied blindly for a cleaning and packing operation. For the underlying process understanding, refer to Pulse Cleaning, Grading, Sorting & Packing Process Flow.
Key Assumptions Used in Pulse Cleaning Plant Financial Projections
Every realistic financial model begins with transparent assumptions: capacity, utilisation, recovery, prices, costs and tax parameters. Expected cleaning losses and other operational efficiencies must be incorporated into financial models from the outset. The following table presents illustrative assumptions for a mid-sized pulse cleaning and packing plant setup.
| Parameter | Illustrative Assumption |
|---|---|
| Installed Capacity | 4 TPH |
| Working Hours / Day | 16 hours |
| Annual Operating Days | 300 days |
| Theoretical Annual Capacity | 19,200 MT |
| Capacity Utilisation (Year 1–5) | 55%, 65%, 75%, 80%, 85% |
| Processing Recovery (cleaned pulses) | 96–97% of input |
| Wastage / Rejects (dust, stones, broken) | 3–4% |
| Job-Work Charge (where applicable) | ₹1,800–₹2,500 / MT |
| Raw Pulse Purchase Price (own-account) | ₹70,000–₹85,000 / MT (variety-dependent) |
| Finished Product Realisation | ₹77,000–₹92,000 / MT |
| Packaging Material Cost | ₹1,500–₹3,000 / MT |
| Freight & Selling Expenses | 1.5–3% of sales |
| Electricity Tariff | ₹8–₹10 / kWh |
| Labour Cost Escalation | 7–8% p.a. |
| Repairs & Maintenance | 2–3% of P&M cost p.a. |
| Term Loan Interest | 10.00–11.50% p.a. |
| Working Capital Interest | 11.50–12.50% p.a. |
| Depreciation (P&M – WDV) | ~15% |
| Effective Tax Rate | 25–30% |
Operating costs for pulses processing plants are driven by raw materials, with raw uncleaned pulses accounting for 88–92% of operating expenses in own-account models. Utility costs represent 3–5% of total operating expenses. Raw pulse recovery rates can significantly impact unit costs and profitability; even a 1–2% deviation in recovery changes annual profit materially.
Plant capacity, land and building requirements underlying these assumptions should align with technical planning. For detailed infrastructure guidance, refer to Pulse Cleaning & Packing Plant Capacity, Land, Building & Layout. All numbers above are purely illustrative. Entrepreneurs must customise assumptions based on actual quotations, local power tariffs, wage levels, pulse varieties and region-specific price trends.
Project Cost and Means of Finance
Project cost covers land, site development, civil construction, plant and machinery, colour sorter, electrical and utility installations, pre-operative expenses, contingency and working capital margin. Capital expenditures include costs for land, buildings, and equipment. Land and site development costs include registration and infrastructure. Investing in modern milling machinery is essential for efficiency in a competitive pulse processing plant.
| Component | Illustrative Cost (₹ Lakh) |
|---|---|
| Land & Site Development | 80–120 |
| Building & Civil Works | 100–150 |
| Plant & Machinery (cleaners, graders, elevators, aspiration, packing) | 150–220 |
| Optical Colour Sorter | 40–80 |
| Electrical Installations & Panels | 15–25 |
| Utilities (compressor, dust collection, DG set, water) | 10–20 |
| Preliminary & Pre-Operative Expenses | 10–20 |
| Contingency (3–5%) | 10–20 |
| Margin for Working Capital | 30–60 |
| Total Illustrative Project Cost | 445–715 |
For reference, a typical dal mill project cost ranges from ₹15 lakh to ₹1 crore for smaller capacities. For a detailed cost breakdown, see Pulse Cleaning, Grading & Packing Plant Setup Cost & Investment.
Means of finance typically involves promoter equity or own contribution at 25–35% of project cost, term loan from a bank or financial institution for fixed assets, and working capital limits such as cash credit. Unsecured loans from promoters or relatives should be clearly distinguished from bank loan obligations. Debt-equity considerations vary by bank, project risk, collateral and promoter profile. No single ratio such as 2:1 or 1.5:1 is universally mandated across all lenders.
Project cost estimation must be backed by actual machinery quotations and civil cost estimates. Over- or under-stating project cost distorts DSCR, ROI and subsidy eligibility. The Government of India’s Mission for Aatmanirbharta in Pulses offers financial assistance at 33% of project cost (up to ₹25 lakh) for new processing and packaging units, which can meaningfully reduce the promoter’s equity burden.
Five-Year Revenue and Profitability Projections
For bank loan appraisal and investor analysis, a five-year projected Profit & Loss statement is standard. Revenue projections should factor in processing yields and capacity utilization rates. The table below illustrates an own-account processing model.
| Particulars | Year 1 | Year 2 | Year 3 | Year 4 | Year 5 |
|---|---|---|---|---|---|
| Capacity Utilisation (%) | 55% | 65% | 75% | 80% | 85% |
| Processing Volume (MT) | 10,560 | 12,480 | 14,400 | 15,360 | 16,320 |
| Sales Revenue (₹ Lakh) | 813 | 961 | 1,108 | 1,182 | 1,257 |
| Raw Material Cost (₹ Lakh) | 713 | 843 | 972 | 1,037 | 1,101 |
| Direct Operating Expenses (₹ Lakh) | 32 | 36 | 40 | 42 | 44 |
| Employee Expenses (₹ Lakh) | 18 | 19 | 21 | 22 | 24 |
| Other Overheads (₹ Lakh) | 8 | 9 | 10 | 10 | 11 |
| EBITDA (₹ Lakh) | 42 | 54 | 65 | 71 | 77 |
| Depreciation (₹ Lakh) | 28 | 24 | 20 | 17 | 15 |
| Interest (TL + WC) (₹ Lakh) | 22 | 20 | 17 | 14 | 11 |
| PBT (₹ Lakh) | -8 | 10 | 28 | 40 | 51 |
| Tax (₹ Lakh) | 0 | 3 | 7 | 10 | 13 |
| PAT (₹ Lakh) | -8 | 7 | 21 | 30 | 38 |
| Net Cash Accrual (PAT + Dep.) | 20 | 31 | 41 | 47 | 53 |
Gross profit margins for pulses processing typically range between 8–12%, and net profit margins are estimated at 3–7% under normal operating conditions, depending on variety, packing type and market realisation. First-year operating costs cover raw material consumption, utilities, and maintenance, but lower capacity utilisation often means the plant does not achieve healthy profitability potential until Year 2 or 3. The company’s financial trend stabilises as utilisation reaches 75–85%.
Key profitability drivers include per-MT processing margin, product mix (bulk versus smaller packs), efficiency of colour sorting and minimal rejections, and control over overheads. For deeper analysis of recovery, wastage and processing cost, refer to Pulse Cleaning & Grading Processing Cost, Recovery, Wastage & Profitability.
CMA Data Preparation for Pulse Cleaning & Packing Plant
Credit Monitoring Arrangement (CMA) Data is a structured set of past, current and projected financial statements used by banks to assess term loan and working capital proposals. For a pulse cleaning plant, CMA Data typically includes existing and projected operating statements showing turnover, costs and net operating income, projected balance sheet for at least five years, and detailed current assets and current liabilities breakup.
The working capital assessment within CMA Data computes peak working capital requirement based on holding periods for raw pulses, finished goods, packing materials and debtors. Fund flow and cash flow statements trace how project funds are deployed and repaid. Financial ratios expected in CMA Data include current ratio, debt-equity ratio, DSCR, gross profit margin and net profit margin, along with other financial ratios that lenders track through the company’s operating income trends.
CMA Data also captures term loan requirement, cash credit needs and, where relevant, Maximum Permissible Bank Finance (MPBF) calculations following accrual based accounting guidance. While a Chartered Accountant can help prepare bank-compliant CMA Data, projections remain management estimates. CMA Data is not a certificate or guarantee of results. The pulse cleaning plant’s CMA should align numerically with the detailed project report, avoiding inconsistencies in installed capacity, project cost or means of finance across documents.
Working Capital Assessment and Cash Credit Requirements
In a pulse cleaning and packing facility, working capital often determines whether the business can maintain operational flexibility during peak procurement and lean sale periods. Pulses are harvested seasonally, impacting working capital needs and inventory procurement patterns. Working capital assessments are crucial to manage liquidity in seasonal agricultural processing. Many MSMEs underestimate this requirement in their business plan.
Key current asset components:
- Raw pulses inventory: 15–45 days depending on procurement seasonality
- Finished goods (cleaned, graded, packed pulses): 7–20 days
- Packing material stock
- Trade receivables: 15–45 days based on credit terms
- Cash and bank balances for day-to-day operations
Current liabilities:
- Trade creditors for raw pulses and packing material
- Outstanding wages, salaries and statutory dues
- Working capital borrowing
For an own-account model processing ~14,400 MT in Year 3, with daily raw material consumption of approximately ₹3.24 lakh and 30-day raw material holding, inventory alone can exceed ₹97 lakh. After adding finished goods and debtors, net working capital requirement may reach ₹120–150 lakh before creditor adjustments.
For a pure job-work model, inventory is minimal (limited to transit or in-process stock), and debtors represent only processing charges receivable, which are far smaller than trading turnover. As a result, the required cash credit limit is lower, positively affecting interest cost and DSCR.
Banks typically finance a portion of working capital (often around 75% of assessed current assets) and expect promoters to bring the balance as margin. Accurate working capital assessment feeds directly into CMA Data, cash flow projections and DSCR calculations.
DSCR Calculation for Pulse Cleaning & Packing Plant
A debt service coverage ratio assesses a project’s ability to meet debt obligations. The formula is:
DSCR = Cash Available for Debt Service ÷ Total Debt Service
Cash available for debt service is typically computed as net profit after tax plus depreciation plus interest on term loan. To calculate total debt service, add term loan principal repayment due during the year plus interest on the term loan for that year. Some banks also consider lease payments and interest on working capital in their internal coverage analysis, but DSCR generally focuses on term debt service.
| Year | Cash Available (₹ Lakh) | Principal Due (₹ Lakh) | Interest on TL (₹ Lakh) | Total Debt Service (₹ Lakh) | DSCR |
|---|---|---|---|---|---|
| 1 | 27 | 0 (moratorium) | 15 | 15 | 1.80 |
| 2 | 43 | 22 | 13 | 35 | 1.23 |
| 3 | 52 | 22 | 11 | 33 | 1.58 |
| 4 | 56 | 22 | 8 | 30 | 1.87 |
| 5 | 59 | 22 | 6 | 28 | 2.11 |
| Average | 1.72 |
The minimum annual DSCR (Year 2 in this illustration, at 1.23) is what lenders scrutinise most carefully. Many banks look for an average DSCR above 1.50 and a minimum DSCR not too close to 1.00. The Debt Service Coverage Ratio should be at least 1.5 for loans as a general comfort threshold, though specific scheme norms may differ. There is no single universal regulatory figure mandated across all banks.
Common mistakes in DSCR calculation include forgetting to include full principal repayment in total debt service, double-counting or excluding interest, using PAT instead of cash accrual without adjustment, and using unrealistic moratorium structures not accepted by the bank. DSCR must be computed on the same projections submitted in DPR and CMA Data. Any mismatch in term loan amount, tenure or interest rate between documents leads to heavy queries or rejection.
Cash Flow Projections and Term Loan Repayment
Profitability and cash flow are not the same. A pulse cleaning and packing business can show profit on paper but struggle to pay EMIs if funds are locked in inventory and receivables. Cash flow statements are critical to track inflows and outflows in agro-processing.
A projected cash flow statement for five to seven years captures operating cash inflows from customers, operating cash outflows for raw materials, wages, utilities, packing and overheads, working capital movements (changes in stocks, debtors and creditors), interest paid, and principal repayment as financing cash outflow.
In Year 1, lower capacity utilisation combined with inventory build-up and start-up costs typically makes cash flow tight even when the year ends with a small accounting profit. Negative cash flow in isolated months due to seasonal raw material stocking can be managed through cash credit limits, but cumulative annual cash must still cover total debt service for DSCR to remain satisfactory. Banks review cash flow projections to verify that term loan instalments align with expected cash generation, and may adjust repayment tenure or moratorium based on realistic project gestation.
Break-Even Analysis, ROI and IRR
Financial projections should include break-even analysis to determine minimum production requirements. Operating expenses are categorized into variable and fixed costs for a pulse processing facility. Fixed costs include salaries, minimum electricity demand charges, depreciation and interest on term loan. Variable costs move broadly with MT processed: raw materials, power per MT, packing material and direct labour. Capacity utilization affects fixed costs absorption and break-even analysis for processing plants.
For the illustrative plant with total annual fixed costs of approximately ₹76 lakh and average contribution per MT of ₹700 (own-account model), break-even volume is approximately 10,857 MT, or roughly 57% of installed annual capacity.
Return on investment at project level is computed as average annual net profit after tax (or cash accrual) divided by total project cost. Project IRR is calculated on net project cash flows over the entire project life, considering initial investment and subsequent inflows. Equity IRR focuses on cash flows available to equity investors after debt service and is naturally different from project IRR depending on leverage. A strong project IRR and reasonable payback period give lenders and investors comfort about long-term feasibility, maintaining operational flexibility through various market cycles.
Sensitivity Analysis and Financial Risks
Pulse processing projects operate in a volatile environment. Commodity price volatility is a major risk factor influencing raw material costs. Operating costs are projected to increase due to inflation. Underestimating cleaning and grading losses skews the cost of goods sold calculations and directly erodes the company’s operating income.
| Scenario | EBITDA Margin | Annual Cash Accrual (Yr 3) | Average DSCR |
|---|---|---|---|
| Base Case (75% utilisation) | ~5.9% | ₹41 Lakh | 1.72 |
| Higher RM Cost (+8%) | ~3.1% | ₹22 Lakh | 1.18 |
| Lower Utilisation (55%) | ~3.8% | ₹18 Lakh | 1.05 |
Key downside scenarios include lower capacity utilisation due to weak demand or competition, reduced job-work charges per MT, higher raw pulse procurement prices without matching selling price increase, lower marketable recovery because of poorer-quality raw pulses, higher electricity and labour costs, delayed debtor collection stretching receivable days, and higher sorting rejects and packaging losses. For export-oriented operations, additional risks such as forex volatility and stricter quality rejection rates apply.
Banks and serious investors appreciate promoters who openly present stress scenarios. It signals maturity and risk awareness rather than weakness.
Bank Finance Readiness and Common Projection Mistakes
A bank-ready pulse cleaning and packing plant proposal typically includes a DPR, CMA Data, projected financials, KYC documents, collateral details and applicable registrations (FSSAI, GST, Udyam). Banks expect a detailed project report with project cost, means of finance, production capacity, pricing and profitability, five- to seven-year projected Profit & Loss, balance sheet and cash flow statements, DSCR working and break-even analysis.
Common mistakes observed in pulse processing plant DPRs include inflated capacity utilisation from Day 1 without a marketing plan, unrealistic finished-goods selling prices compared to prevailing mandi and wholesale rates, understated working capital requirement, incorrect DSCR calculations excluding principal, assuming very low interest rates without bank confirmation, and inconsistencies between DPR and CMA Data.
Professional reports improve clarity and bankability, but no consultant or CA can guarantee loan sanction, subsidy approval or minimum DSCR acceptance by any specific bank.
How CA Manish Gugliya Assists with DPR, CMA Data and Financial Projections
CA Manish Gugliya and his team at Project Report Bank prepare bankable Detailed Project Reports for pulse cleaning, grading, colour sorting and packing plants, including dal mill project variants, job-work business models and export-oriented units. The advisory practice builds five- to seven-year financial projections integrating project cost, capacity utilisation, pricing, working capital, DSCR, break-even, ROI and IRR analysis, along with CMA Data for bank loans tailored to specific lender formats.
The support typically includes loan structuring and means of finance planning, working capital assessment and MPBF calculations, sensitivity analysis, bank questionnaire support, and model revisions when machinery quotations or loan terms change.
Serious entrepreneurs and agro-processing promoters may visit www.projectreportbank.com and share their proposed plant capacity and location via WhatsApp or enquiry form for a customised DPR and CMA Data discussion. No guarantees of loan sanction or subsidy disbursement are made.
Professional Insight – CA Manish Gugliya
In my experience preparing DPRs and financial projections for pulse cleaning and packing projects, actual recovery percentage, realistic capacity utilisation and the working capital cycle impact bankability far more than headline turnover figures. A 2% deviation in recovery, say 96% versus 98%, changes annual profit by several lakh rupees on even a modest-capacity plant. Underestimating debtor days or raw material holding periods leads to cash flow pressure even when the P&L appears profitable and the company shows sufficient income on paper.
Conservative assumptions for Year 1 and Year 2 utilisation tend to be far more acceptable to bankers than aggressive, unsubstantiated projections. I advise readers to treat projections as a planning tool and risk-management document, not merely a loan-approval formality. Review best- and worst-case scenarios before finalising investment in plant setup and bank loan commitments.
The worldwide food industry continues to evolve, and with health conscious eating continues to shape plant based dietary patterns, pulses remain central to sustainable food production. They offer plant based protein with a low environmental footprint compared to conventional livestock farming and animal protein sources, positioning processed pulse commodities alongside pulse flour and functional foods as alternative food sources in eco friendly food systems. The growing demand for plant derived protein across vegetarian and vegan diets further strengthens the demand outlook and ensures stable demand. Worldwide production of major pulses exceeds 90 million tonnes annually, and with extensive production capacities emerging across India, the pulse processing sector supports both the worldwide food industry and domestic nutritional security through nutritious food products.

Frequently Asked Questions
What capacity is financially viable for a new pulse cleaning and packing plant in 2026?
Financial viability depends on local demand, consistent supply of raw pulses, and the promoter’s marketing capability rather than capacity alone. Plants in the 3–5 TPH range (with annual processing capacity of 15,000–25,000 MT) generally achieve reasonable economies of scale. Smaller units may struggle with fixed cost absorption, while very large plants risk underutilisation in the initial years. A carefully prepared business plan should model the specific capacity against projected volumes and break-even utilisation before committing to essential equipment purchases.
How many years of financial projections do banks ask for when appraising a pulse processing plant term loan?
Most banks require five-year projected financial statements including Profit & Loss, balance sheet and cash flow, along with DSCR working for the entire term loan repayment period. Some lenders may request seven-year projections if the door-to-door tenure of the term loan extends beyond five years. The projections should cover operating statements, working capital assessment and financial ratios for each year.
What DSCR do banks consider comfortable for a pulse processing plant term loan?
While there is no single mandatory figure, many banks prefer an average DSCR above 1.50 and a minimum annual DSCR not below approximately 1.10–1.20 in weaker years. Certain scheme-specific norms, such as dal mill cluster schemes, may accept an average DSCR of 1.25. The key is demonstrating that projected cash accruals comfortably cover total debt service even under moderately adverse conditions.
Can I use the same financial model for both domestic and export-oriented pulse cleaning operations?
Not directly. Export-oriented operations involve different cost structures including fumigation, quality testing, export compliance, longer debtor cycles and forex risk. Net realisation per MT may be higher, but so are rejection rates and packaging costs. The financial model should separately capture export and domestic revenue streams, and sensitivity analysis should include scenarios for currency volatility and export credit delays.
How do changes in MSP or mandi prices of pulses impact existing bank loan covenants and DSCR?
A significant increase in mandi prices raises raw material consumption cost for own-account processors. If the selling price does not adjust proportionally, EBITDA shrinks, cash accrual drops, and DSCR deteriorates. This can trigger covenant concerns with the lending bank. Regular monitoring of the company’s financial trend through updated CMA Data and quarterly cash flow review helps promoters identify emerging pressure early and discuss remedial steps such as inventory adjustment, price pass-through or temporary credit limit enhancement with their banker. Net operating income must remain sufficient to cover interest obligations and principal repayments even when commodity prices are volatile.