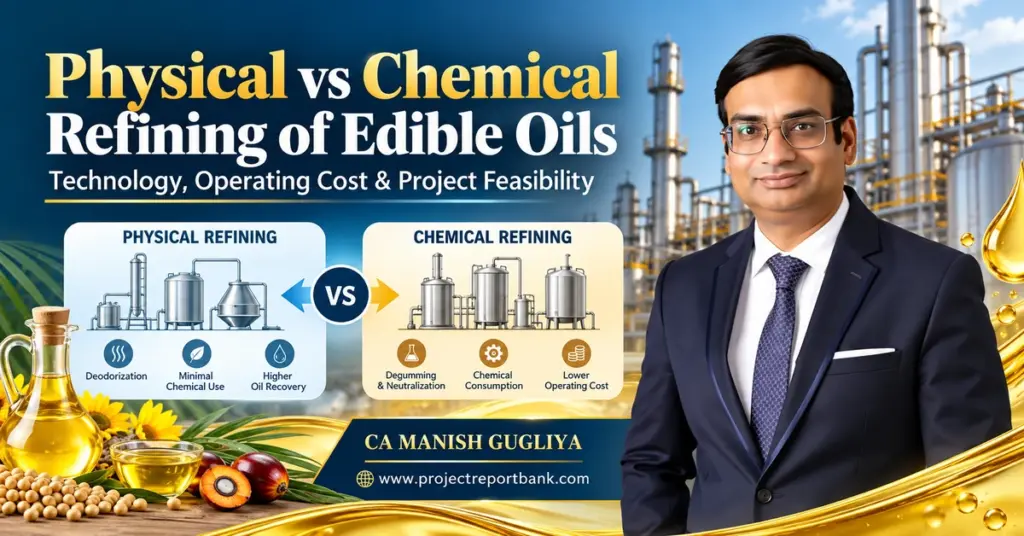
Selecting the right refining technology for an edible oil refinery is not merely an engineering choice – it is one of the most consequential investment decisions that determines your plant’s oil recovery, operating cost per tonne, environmental compliance burden, and ultimately, your project’s ability to service debt and deliver returns. Physical vs chemical refining of edible oils represents a fundamental fork in the road for every serious refinery promoter in India, and the financial implications of choosing incorrectly can persist for the entire life of the plant.
As a practising Chartered Accountant with over 20 years of experience in preparing Detailed Project Reports, financial feasibility studies and CMA Data for industrial projects, I – CA Manish Gugliya, FCA, DISA (ICAI) – have observed that many promoters approach this decision based on machinery quotations or general industry hearsay rather than rigorous financial modelling. This article provides a detailed comparison of physical and chemical refining from the perspective of technology suitability, operating cost economics, capital investment, oil recovery impact and project feasibility, specifically for industrial promoters and investors evaluating edible oil refinery projects in India.
Physical vs Chemical Refining of Edible Oils: The Short Answer for Investors
Neither physical refining nor chemical refining is universally superior. The right choice depends on your crude oil type, crude oil quality (particularly phosphorus and free fatty acid content), plant capacity, environmental constraints and the financial structure of your project.
For projects processing palm oil, palmolein or other low-phospholipid feedstocks at capacities of 100 TPD and above, physical refining typically delivers lower net refining cost due to better oil recovery and reduced chemical and effluent treatment expenses. For refineries handling high-phosphorus vegetable oils such as soybean oil or crude oils of variable quality, chemical refining remains more practical and forgiving – though it comes at the cost of higher neutral oil loss and greater effluent load.
Physical refining means fewer chemicals, lower soapstock waste and potentially superior retention of nutritional value in the refined oil. Chemical refining, on the other hand, tolerates a wider range of crude qualities, requires less stringent pre-treatment and can handle oils with elevated phospholipids and non-hydratable gums more reliably.
Here is how the technology choice impacts your project economics:
- CAPEX: Physical refining requires higher-specification deodorisers, deeper degumming systems and more robust vacuum infrastructure, raising initial capital cost for the process section. Chemical refining shifts CAPEX towards neutralisers, soap separators, washing systems and a larger effluent treatment plant (ETP).
- Oil losses: Physical refining typically achieves neutral oil losses of approximately 1.0–1.2%, while chemical refining losses via soapstock, washing and filter cake often range from 2–3%. Even a 0.5 percentage-point improvement in oil recovery can add ₹1.5–2.5 crore to annual gross contribution for a 100 TPD plant.
- Operating cost per tonne: Physical refining usually offers lower controllable OPEX for suitable feedstocks due to elimination of caustic soda consumption, reduced wash water and lower effluent treatment costs.
- Profitability and debt servicing: Lower refining losses and operating costs improve EBITDA, strengthen DSCR and enhance project IRR – but only if the crude oil quality is consistently suitable for physical refining. If it is not, operational disruptions and off-spec batches can erode those theoretical advantages.
This article is written from the financial and advisory perspective of CA Manish Gugliya for serious edible oil refinery investors in India, and the analysis that follows is intended to support informed investment decisions rather than promote any specific equipment or technology supplier.
What Is Physical Refining of Edible Oils?
Physical refining is a vegetable oil refining method in which free fatty acids are removed by steam distillation under high temperature and reduced pressure during the deodorization process, rather than by chemical treatment with alkali. The physical refining process eliminates the neutralisation step entirely, combining FFA removal (deacidification) with deodorisation in a single high-vacuum stripping operation.
For physical refining to work effectively, the crude oil must be of high quality – specifically, phospholipid content must be reduced to very low levels (typically ≤ 5–10 mg phosphorus per kg of oil after degumming), and trace metals, pigments and other impurities must be adequately managed during pre-treatment. If phospholipids remain too high, they cause colour fixation at the elevated temperatures used in the deodoriser, resulting in darkened, off-spec refined oil.
The main steps in the physical refining process are:
- Degumming: Removal of phospholipids using water degumming, acid degumming (with phosphoric acid or citric acid) or enzymatic degumming. This is the most critical pre-treatment step – phosphorus must be brought below the threshold for the process to succeed.
- Bleaching: Treatment with acid activated bleaching earth (activated clay) to absorb colour pigments, residual phospholipids, trace metals, oxidation products and other impurities.
- Dewaxing (where applicable): For oils such as sunflower or corn oil that contain waxes, a chilling and filtration step may be required.
- Physical deacidification and deodorisation: The core step – crude oil is subjected to steam stripping at high temperature (typically 220–250 °C) and deep vacuum to remove volatile compounds, free fatty acids, off flavors and odorous substances. This is where removing free fatty acids occurs in the physical route.
- Final filtration and polishing: Production of finished deodorized oil meeting quality specifications.
Simplified process flow: Crude Oil → Degumming (Acid/Water/Enzymatic) → Bleaching → Deodorisation/Deacidification (Steam Stripping) → Filtration → Refined Oil
It is important to clarify that although called “physical”, this route still uses some chemicals – phosphoric acid or citric acid during degumming, and bleaching earth during the bleaching process. The defining distinction is that fatty acids are removed physically through steam refining rather than through alkali neutralisation and soap formation.
Physical refining retains more nutrients than chemical refining. Research at CFTRI (India) demonstrated that physically refined rice bran oil retained oryzanol content at approximately 1.60–1.74%, whereas chemically refined rice bran oil retained only about 0.19–0.20% – a loss of 80–90% of this valuable bioactive compound. Physical refining typically preserves more heat-sensitive nutrients compared to chemical refining, making it attractive for high quality oils where nutritional value and shelf life are priorities.
What Is Chemical Refining of Edible Oils?
Chemical refining – also known as alkali refining – is the traditional and historically dominant method of edible oil refining in India and worldwide. In this process, chemical refining uses alkaline neutralization to remove free fatty acids from crude oil by reacting them with sodium hydroxide (caustic soda) to form soap (soapstock), which is then physically separated from the neutral oil.
Chemical refining is suitable for oils with high free fatty acid content and for crude oils with elevated phospholipid levels, variable quality or significant non-hydratable gum content. Its ability to handle a wider range of feedstock conditions has made it the default choice for many multi-seed refineries processing soybean oil, cottonseed oil, groundnut oil and other seed oils.
The core stages of chemical refining are:
- Degumming: Removal of phospholipids using water or dilute acid (phosphoric acid). This step converts phosphatidic acid and other non-hydratable phospholipids into hydratable forms for easier removal.
- Neutralisation: Free fatty acids react with caustic soda to produce soap. This soap, along with entrained neutral oil, forms soapstock. Chemical refining produces soap that must be separated from oil through centrifugation or settling.
- Soapstock separation: Centrifugal separators remove soapstock from the neutralised oil.
- Washing and drying: Residual soap is removed by water washing; the oil is then dried to remove moisture.
- Bleaching: Treatment with bleaching earth to remove pigments, residual soap traces, metal traces and oxidation products.
- Deodorisation: Steam distillation under vacuum to remove volatile compounds, off flavors and residual odorous substances, producing a neutral taste.
- Final filtration: Polishing filtration to produce finished refined oil.
Simplified process flow: Crude Oil → Degumming → Neutralisation (NaOH) → Soapstock Separation → Washing/Drying → Bleaching → Deodorisation → Filtration → Refined Oil
The major drawbacks of chemical refining relate to neutral oil loss and effluent generation. Chemical refining can lead to higher oil losses due to soap formation – neutral oil becomes entrained in soapstock and wash water, resulting in typical total losses of 2–3% of oil processed. The soapstock itself requires handling, splitting or disposal, and the wash water containing residual soap and alkali adds significantly to the ETP load. Chemical refining can lead to higher environmental pollution levels compared to physical refining.
Chemical refining can also lead to 26.8–79.4% loss of tocopherols (natural antioxidants) in the processed oil, and refining removes 10–32% of sterols. These losses reduce the nutritional value of the final product and the potential value of by-products such as deodorizer distillates.
Physical Refining vs Chemical Refining: How They Compare at a Glance
For decision-stage investors comparing physical and chemical refining, the following table provides a high-level summary of the key technical and economic differences. These are illustrative ranges – actual values are always project-specific and depend on crude oil quality, plant configuration, capacity and operating discipline.
| Parameter | Physical Refining | Chemical Refining |
|---|---|---|
| Refining principle | FFA removed by steam stripping (deacidification) | FFA removed by alkali neutralisation (soap formation) |
| Best-suited feedstocks | Low-phospholipid oils: palm oil, palmolein, coconut, palm kernel | High-phospholipid or variable-quality oils: soybean, cottonseed, groundnut |
| Crude oil phosphorus requirement | ≤ 5–10 ppm after degumming | Can tolerate higher levels; neutralisation reduces phosphorus |
| FFA removal method | Steam distillation at 220–250 °C under vacuum | Reaction with sodium hydroxide → soapstock |
| Typical neutral oil loss | ~1.0–1.2% under suitable conditions | ~2–3%, higher with elevated FFA |
| Chemical consumption | Phosphoric/citric acid, bleaching earth; no caustic soda | Phosphoric acid, caustic soda, bleaching earth, wash water |
| Soapstock generation | None | Significant – requires handling, splitting or disposal |
| Effluent load | Lower – physical refining generates less waste | Higher – wash water, soapstock residues, alkaline wastewater |
| Deodoriser distillate | Higher FFA content; valuable for oleochemicals | Lower FFA content; value depends on composition |
| Plant complexity | More demanding vacuum/deodorisation systems | Simpler deodorisation but additional neutralisation/washing equipment |
| Relative CAPEX (core process) | Higher for deodorisers and degumming; lower for ETP | Lower for deodorisers; higher for neutralisation, washing and ETP |
| Relative OPEX per tonne | Generally lower for suitable feedstocks | Generally higher due to chemicals, oil loss and effluent costs |
| Environmental profile | More environmentally friendly; fewer chemicals, less waste | Higher chemical usage, more wastewater, soapstock disposal |
| Nutrient retention | Better retention of tocopherols, sterols, oryzanol | Higher losses of bioactive compounds into soapstock |
The single biggest takeaway: physical refining offers lower ongoing oil losses and operating costs if crude quality is consistently controlled, while chemical refining provides a safer, more forgiving process for variable and high-gum feedstocks – but at the cost of higher neutral oil loss, chemical consumption and effluent burden.
Decisive Factor 1: Feedstock Quality & Technical Suitability
Crude oil characteristics are the first and most critical screening criterion before choosing between physical and chemical refining. The decision is not about which technology is “better” in the abstract – it is about which technology matches your feedstock.
- Phosphorus and phospholipids: Physical refining requires high-quality crude oil with low phospholipid content – phosphorus must be reduced to ≤ 5–10 ppm after the degumming process. If non-hydratable gums remain, they cause colour fixation at the high deodorisation temperatures used in physical refining. Research on sunflower oil shows crude phosphorus around 293 mg/kg; after bleaching in the chemical route, this falls to approximately 9 mg/kg, but achieving ≤ 5 ppm for physical refining requires deep or enzymatic degumming.
- Free fatty acids: Physical refining becomes economically more attractive when FFA content exceeds approximately 2%, because soapstock losses in chemical refining escalate with higher FFA. For oils like crude palm oil with FFA of 3.5–4.5%, physical refining is the standard approach globally.
- Tolerance of chemical refining: Chemical refining can handle crude oils with higher phosphorus, elevated non-hydratable gums, variable moisture and inconsistent upstream processing quality. The neutralisation step itself reduces phosphorus substantially, compensating for inadequate degumming – but at the expense of higher neutral oil loss and chemical cost.
- Upstream quality impact: The quality of crude oil delivered from expelling or solvent extraction directly influences route selection. A well-managed solvent extraction plant producing consistent, low-moisture, low-phosphorus crude opens the door to physical refining; poor upstream control may force chemical refining regardless of downstream equipment.
Winner for variable, high-gum feedstock: Chemical refining – because it is more forgiving of crude oil quality, though at higher chemical cost and oil loss. For consistently high-quality, low-phosphorus crude, physical refining is technically and economically superior.
Decisive Factor 2: Operating Cost per Metric Tonne
OPEX per tonne of crude oil processed is critical for DSCR and long-term project viability, especially for capacities above 100 TPD where even small per-tonne differences compound into significant annual figures.
- Steam and thermal energy: Physical refining deodorisers operate at 220–250 °C and require substantial steam – typically 150–250 kg steam per tonne for the deodorisation/deacidification step. Chemical refining total steam consumption can reach 600–1,000+ kg per tonne in batch operations according to UNIDO data, with the deodorisation stage consuming the largest share. Continuous chemical refining reduces this to approximately 600 kg/tonne.
- Chemical and bleaching earth usage: Chemical refining consumes caustic soda, phosphoric acid, citric acid and bleaching earth. Physical refining eliminates caustic soda entirely and reduces wash water requirements, though bleaching earth consumption may be slightly higher to compensate for the absence of neutralisation.
- Effluent treatment cost: Chemical refining generates significant alkaline wash water and soapstock residues requiring treatment before discharge. Physical refining minimizes liquid effluents generation, substantially reducing ETP operating costs.
- Labour and maintenance: Broadly similar in magnitude, though physical refining requires operators skilled in managing high temperature deodorisation and vacuum systems.
Illustrative direct processing cost comparison (100 TPD, hypothetical):
| Cost Head | Physical Refining (₹/MT) | Chemical Refining (₹/MT) |
|---|---|---|
| Steam and thermal energy | 800–1,000 | 1,000–1,400 |
| Electricity | 250–350 | 200–300 |
| Chemicals and bleaching earth | 300–450 | 600–900 |
| Water and effluent treatment | 50–80 | 150–300 |
| Labour and supervision | 100–150 | 100–150 |
| Repairs, maintenance, consumables | 80–120 | 80–120 |
| Other factory overheads | 50–80 | 50–80 |
| Total direct processing cost | ~1,630–2,230 | ~2,180–3,250 |
Note: These figures are illustrative assumptions for methodology explanation only, not market quotations. Actual costs vary significantly by location, fuel prices, scale and crude quality.
Winner: Physical refining – typically offers lower controllable OPEX for suitable feedstocks, primarily because it eliminates caustic consumption, reduces wash water and generates less waste. However, when the economic value of oil losses is factored in (see next section), the advantage widens further.
Decisive Factor 3: Oil Recovery, Yield Losses & By‑product Handling
Even a 0.25–0.5 percentage-point improvement in neutral oil recovery significantly impacts EBITDA in large refineries. This is where the financial case for physical refining becomes most compelling – and where chemical refining’s higher losses become most costly.
Loss streams in each process:
- Physical refining: FFA removed as deodoriser distillate (containing fatty acids, tocopherols, sterols); minor oil retained in filter cake (bleaching earth); handling losses. Total neutral oil loss typically ~1.0–1.2% under good conditions.
- Chemical refining: Neutral oil entrained in soapstock (the largest single source of loss); residual oil in wash water; oil retained in filter cake; deodoriser distillate losses. Total neutral oil loss typically ~2–3%, sometimes higher with elevated FFA. Chemical refining can lead to higher oil losses due to soap formation.
By-product considerations: Deodorizer distillates from physical refining contain concentrated FFA, tocopherols and sterols with significant commercial value for oleochemical and vitamin E extraction industries. Soapstock from chemical refining can be split for fatty acid recovery or sold to oleochemical units, but its value per tonne is generally lower and handling is more cumbersome.
Hypothetical impact illustration – 100 TPD plant, 330 operating days/year:
| Recovery Improvement | Additional Refined Oil (MT/year) | Gross Value at ₹100/kg |
|---|---|---|
| 0.25 percentage points | 82.5 MT | ₹0.83 crore |
| 0.50 percentage points | 165 MT | ₹1.65 crore |
| 1.00 percentage points | 330 MT | ₹3.30 crore |
At an illustrative refined oil price of ₹100/kg and annual crude throughput of 33,000 MT.
The net incremental contribution after accounting for any additional processing cost and by-product offset may be somewhat lower – perhaps ₹2.0–2.5 crore annually for a 1.0 percentage-point improvement – but remains transformative for project profitability. This difference flows directly into EBITDA and can meaningfully alter DSCR and project IRR over the loan tenure.
Winner: Physical refining – delivers materially better neutral oil recovery for suitable crude, with the trade-off that crude quality must be consistently high. For investors processing high-phosphorus or variable-quality oils where physical refining is not technically reliable, chemical refining’s higher losses become an unavoidable cost of operational flexibility.
Decisive Factor 4: CAPEX, Complexity & Scale
Investors must weigh lower operating cost against potentially higher CAPEX and complexity in physical refining. The capital expenditure profile differs between the two routes not in total quantum alone, but in where the money is allocated.
- Physical refining requires higher-specification deodorisers capable of simultaneous deacidification (packed columns or multi-tray designs rated for 220–250 °C, deep vacuum), more robust vacuum systems (ejectors, barometric or surface condensers), and advanced degumming equipment (acid or enzymatic). These raise the process section CAPEX.
- Chemical refining requires neutralisers, centrifugal soap separators, wash water systems, drying equipment and a substantially larger ETP. The deodoriser can be simpler since it handles only deodorisation, not deacidification.
Indicative CAPEX comparison (relative bands):
| Capacity (TPD) | Physical Refining – Process CAPEX | Chemical Refining – Process CAPEX | Notes |
|---|---|---|---|
| 50 | Medium–High | Medium | Physical refining CAPEX premium most pronounced at small scale |
| 100 | Medium–High | Medium | Gap begins to narrow; OPEX savings of physical refining improve payback |
| 200 | Medium | Medium | Economies of scale in vacuum systems and heat recovery reduce physical refining premium |
| 500 | Medium | Medium | At large scale, total CAPEX broadly comparable; ETP savings in physical route may offset deodoriser premium |
These are qualitative indications, not vendor quotations. Actual CAPEX depends on configuration, material of construction, automation level and supplier. For a detailed treatment of project costs, refer to the edible oil refinery project cost and investment guide.
Additional CAPEX components to consider include boiler and thermic fluid systems (sized based on steam demand), storage tanks, electrical installations, civil works, laboratory equipment, pre-operative expenses, interest during construction and contingencies. Automation and SCADA requirements are generally higher for physical refining due to tighter process parameters.
Winner: For small plants (≤ 50 TPD), chemical refining typically has lower initial CAPEX. For larger capacities (100 TPD and above), the CAPEX difference narrows, and physical refining’s superior OPEX economics usually justify the incremental investment – provided the feedstock is suitable. The lifetime cost of higher oil losses in chemical refining can far exceed the initial equipment savings.
Decisive Factor 5: Environmental, Regulatory & Operational Risk
Environmental compliance, food safety requirements and operational risk increasingly influence bank appraisal and long-term project viability in India.
- Effluent load: Physical refining is more environmentally friendly due to lower chemical use and elimination of soapstock washing. Physical refining generates less waste compared to chemical refining – specifically, no alkaline wash water, no soapstock requiring splitting or disposal, and substantially reduced total liquid effluent. Chemical refining can lead to higher environmental pollution levels, and the ETP must handle larger volumes of contaminated wastewater.
- Operational risk from crude quality shocks: Chemical refining is more forgiving when crude quality deteriorates unexpectedly (higher FFA, elevated phosphorus from poor storage or upstream processing issues). Physical refining is more sensitive – if phosphorus spikes above the critical threshold, the deodoriser can produce darkened, off-spec oil requiring reprocessing.
- Operational complexity: Physical refining demands skilled operators to manage high operational temperatures (220–250 °C) and vacuum systems precisely. High operational temperatures in physical refining can lead to thermal degradation of oil if process parameters are not tightly controlled. Refining can generate harmful compounds like trans-fatty acids and may produce 3-MCPD-esters, affecting oil safety – risks that intensify at extreme temperatures.
Both refining methods effectively remove heavy metals and pesticide residues, and both must meet FSSAI standards for refined edible oils. Edible oil refining removes impurities like free fatty acids, phospholipids, pigments, and volatile compounds regardless of the route chosen.
Winner: Physical refining from an environmental compliance and effluent management perspective. However, chemical refining carries lower operational risk from feedstock variability, which can be an important consideration for multi-seed refineries sourcing crude from multiple suppliers.
Which Edible Oils Are Better Suited to Physical or Chemical Refining?
Suitability is oil-specific and depends on both inherent composition and upstream processing quality. The following summary reflects established Indian and global practice:
- Palm oil and palmolein: Typically physically refined worldwide. High FFA (3.5–4.5% in crude palm oil), low phospholipid content and established global infrastructure make physical refining the standard. Total refining losses for palm oil under physical refining are approximately 4.5–6.5% when crude FFA is 3.5–4.5% (this includes FFA distillate, bleaching losses and handling losses – not just neutral oil loss).
- Soybean oil: Predominantly chemically refined due to high phospholipid content (crude phosphorus often 200–600 ppm). Physical refining is technically possible with deep degumming or enzymatic degumming to bring phosphorus below 5–10 ppm, but requires strict upstream quality control. For investors evaluating integrated soybean crushing, extraction and refining projects, coordinated design between extraction and refining is essential.
- Sunflower oil: Mixed practice. Physical refining is feasible with adequate degumming and dewaxing (sunflower seeds produce oil with significant wax content). Chemical refining remains common where crude quality is variable.
- Rice bran oil: Physical refining preserves oryzanol far more effectively – CFTRI research showed oryzanol retention of approximately 1.60–1.74% versus only 0.19–0.20% under chemical refining. However, crude rice bran oil often has high FFA and requires careful pre-treatment. For investors considering rice bran oil projects, the technology choice significantly affects product positioning and premium pricing potential.
- Mustard/rapeseed oil: Mostly chemically refined in India due to high erucic acid content, glucosinolates and variable crude quality. Physical refining requires specialised pre-treatment.
- Groundnut oil: Predominantly chemically refined; physical refining possible with good crude quality.
- Cottonseed oil: Chemical refining is standard due to gossypol content and other impurities. Physical refining is generally not recommended for cottonseed oil without extensive pre-treatment.
- Olive oil and virgin oils: Typically not subjected to full refining. Virgin oils are consumed unrefined; only lower-grade olive oil undergoes refining, usually chemical.
- Corn oil: Can be physically or chemically refined depending on crude quality and downstream requirements.
- Fish oils and speciality oils: Specialised refining methods; not covered in this general edible oils comparison.
| Oil Type | Typical Practice in India | Physical Refining Feasibility | Key Technical Conditions |
|---|---|---|---|
| Palm oil / Palmolein | Physical | High | Low gums; established globally |
| Soybean oil | Chemical | Conditional | Deep degumming to ≤ 5–10 ppm P required |
| Sunflower oil | Mixed | Moderate–High | Dewaxing needed; phosphorus control critical |
| Rice bran oil | Mixed | High (with pre-treatment) | FFA management; oryzanol retention benefit |
| Mustard / Rapeseed | Chemical | Low–Moderate | Specialised pre-treatment needed |
| Groundnut oil | Chemical | Moderate | Good crude quality essential |
| Cottonseed oil | Chemical | Low | Gossypol and impurity challenges |
| Corn oil | Mixed | Moderate | Similar to sunflower requirements |
For integrated projects involving oilseed crushing, solvent extraction and refining – such as multi-oilseed solvent extraction plants – the upstream processing quality directly determines the downstream refining route options.
Physical vs Chemical Refining Cost per Metric Tonne in India
The figures in this section are hypothetical illustrations designed to explain methodology and relative differences. They are not market quotations and should not be used as substitutes for project-specific costing.
Table 1: Illustrative Direct Processing Cost Comparison (100 TPD Plant)
| Cost Head | Physical Refining (₹/MT) | Chemical Refining (₹/MT) |
|---|---|---|
| Steam and thermal energy | 900 | 1,200 |
| Electricity | 300 | 250 |
| Chemicals (acids, caustic, etc.) | 200 | 500 |
| Bleaching earth | 200 | 250 |
| Water and effluent treatment | 60 | 200 |
| Labour and supervision | 120 | 120 |
| Repairs, maintenance, consumables | 100 | 100 |
| Other factory overheads | 70 | 70 |
| Total direct processing cost | ₹1,950/MT | ₹2,690/MT |
Table 2: Economic Value of Refining Losses (₹/MT crude processed)
| Component | Physical Refining | Chemical Refining |
|---|---|---|
| Neutral oil loss (%) | 1.1% | 2.5% |
| Oil lost per MT crude (kg) | 11.0 | 25.0 |
| Value of lost oil at ₹100/kg | ₹1,100 | ₹2,500 |
| Less: By-product realisation | (₹200) | (₹150) |
| Net economic loss per MT | ₹900 | ₹2,350 |
Assumptions: Refined oil price ₹100/kg; deodoriser distillate and soapstock realisations estimated conservatively.
Effective refining cost per MT = Direct processing cost + Net economic loss from oil recovery:
- Physical refining: ₹1,950 + ₹900 = ₹2,850/MT
- Chemical refining: ₹2,690 + ₹2,350 = ₹5,040/MT
The illustration demonstrates a crucial insight: small changes in neutral oil loss can overshadow minor differences in steam or chemical cost. The economic value of oil losses often constitutes the largest single component of effective refining cost, which is why minimizing oil loss should be a primary design objective for any refinery.
Impact of Refining Losses on Profitability
To quantify how refining losses flow through to the bottom line, consider a hypothetical 100 TPD edible oil refinery with the following clearly labelled assumptions:
- Capacity: 100 TPD crude oil processed
- Operating days: 330 days/year
- Capacity utilisation: 90% (effective throughput: 90 MT/day)
- Annual crude processed: 29,700 MT
- Illustrative refined oil price: ₹100/kg (₹1,00,000/MT)
Step-by-step impact calculation:
| Oil Recovery Improvement | Additional Saleable Oil (MT/year) | Gross Revenue Impact (₹ crore) | Estimated Net Contribution after Incremental Costs (₹ crore) |
|---|---|---|---|
| 0.25 percentage points | 74.25 MT | 0.74 | 0.55–0.65 |
| 0.50 percentage points | 148.5 MT | 1.49 | 1.10–1.30 |
| 1.00 percentage points | 297 MT | 2.97 | 2.20–2.60 |
Net contribution accounts for incremental processing costs and by-product value adjustments.
For a leveraged project with a term loan at 10–11% interest, an additional ₹1.1–2.6 crore in annual contribution flows directly into EBITDA and cash available for debt service. This can materially improve DSCR from, say, 1.25× to 1.50× or higher – a difference that banks notice during project appraisal.
For a deeper analysis of how recovery economics interact with soybean oil and meal yield losses and profitability, it is important to distinguish between extraction-stage losses (at the solvent extraction plant) and refining-stage losses discussed here.
Capital Investment Comparison: Physical vs Chemical Refining Plants
CAPEX figures discussed here are structured as relative ranges and qualitative indications, not as supplier quotations. Actual project costs depend on configuration, location, material specification, automation level and vendor selection.
Illustrative relative CAPEX comparison:
| Capacity (TPD) | Physical Refining (Relative CAPEX) | Chemical Refining (Relative CAPEX) | Key Difference |
|---|---|---|---|
| 50 | Higher (110–120 base) | Base (100) | Physical route’s deodoriser and vacuum systems are proportionally more expensive at small scale |
| 100 | Moderately higher (105–115 base) | Base (100) | Gap narrows; ETP savings begin to offset |
| 200 | Comparable (100–110 base) | Base (100) | Economies of scale in vacuum/heat recovery |
| 500 | Comparable to slightly higher (100–105 base) | Base (100) | Broadly comparable; physical route may save on ETP |
Major CAPEX components to budget for include:
- Process plant and machinery (refining equipment, vacuum systems, degumming, bleaching, deodorisation)
- Storage tanks and material handling systems
- Boiler, thermic fluid system, cooling tower and utilities
- ETP, water systems and fire-fighting systems
- Electricals, MCC panels, DG sets/transformers and automation/SCADA
- Civil and structural works (buildings, foundations, roads)
- Laboratory equipment and quality-control set-up
- Pre-operative expenses, interest during construction and contingencies
Physical refining may require higher-specification deodorisers (packed column or multi-tray), deeper degumming equipment and more robust vacuum infrastructure. Chemical refining shifts capital towards neutralisers, centrifugal separators, wash water systems and a larger ETP. For detailed project cost structuring, refer to the edible oil refinery project cost and investment analysis.
Machinery and Process Technology Selection
Machinery selection should be driven by long-term oil recovery and energy efficiency guarantees rather than the lowest quotation. In my experience preparing DPRs for industrial projects, I have consistently observed that promoters who select equipment solely on price often face higher lifetime costs through increased oil losses, higher energy consumption and premature maintenance requirements.
Major equipment groups for both routes:
- Degumming systems: Mixing tanks, retention vessels, centrifugal separators (for chemical route), acid dosing systems. Enzymatic degumming systems for physical refining of phosphorus-sensitive oils.
- Neutralisation and washing systems (chemical refining only): Neutraliser vessels, centrifugal soap separators, wash water systems, dryers.
- Bleaching systems: Bleaching vessels with vacuum, dosing systems for bleaching earth, hermetic or leaf filters for spent earth removal.
- Deodorisers and physical deacidifiers: Tray-type or packed-column deodorisers, steam injection systems, fatty acid condensers. Physical refining requires deodorisers rated for higher temperatures and deeper vacuum.
- Vacuum systems: Multi-stage steam ejectors, barometric or surface condensers. Critical for physical refining performance.
- Heat-recovery exchangers: Oil-to-oil heat exchangers for energy integration – essential for controlling steam costs in both routes.
- Automation, PLC/SCADA and instrumentation: Process control systems for temperature, pressure, flow and level management. More critical in physical refining where process parameters must be tightly maintained.
When evaluating technical quotations:
- Compare guaranteed refining loss, steam consumption (kg/MT) and power consumption (kWh/MT) across vendors.
- Verify material of construction and design pressure/temperature ratings – especially for deodorisers.
- Assess scope of supply: equipment supply only versus turnkey erection, commissioning and operator training.
- Insist on performance guarantees that can be reflected in your financial model.
For a comprehensive guide on edible oil refinery machinery and EPC selection, including evaluation frameworks and technology supplier assessment criteria, I have published a separate detailed article.
Financial Feasibility Framework for an Edible Oil Refinery
As a Chartered Accountant, my approach to evaluating edible oil refinery feasibility focuses on how technology choice flows through every financial parameter – not just the headline CAPEX number.
Key financial modelling components:
- Total project cost estimation and phasing: Including all CAPEX components, phased over the construction timeline.
- Means of finance: Promoter equity, term loan (typically 65–75% of project cost), working capital limits and any applicable subsidies.
- Working capital assessment: Based on crude oil inventory holding (typically 15–30 days), finished stock and receivables. Crude oil inventory is the largest working capital component and is influenced by procurement cycles and storage infrastructure.
- Capacity utilisation ramp-up: Typically 60–70% in Year 1, 75–85% in Year 2, 85–90% from Year 3 onwards.
- Revenue projections: Based on throughput and refining margin (difference between crude and refined oil price plus by-product realisations), rather than speculative spot prices.
- Cost build-up: Raw material (crude oil), refining OPEX by route, labour, administrative overheads, selling expenses.
- EBITDA, interest, depreciation and tax: Technology route affects EBITDA through oil recovery and OPEX; depreciation through CAPEX; interest through loan quantum.
- Cash-flow forecasts and loan repayment: Annual cash flow after debt service determines project viability.
- Break-even volume and contribution analysis: How many MT must be processed before the plant covers its fixed costs.
- DSCR: Must remain above 1.25–1.50× throughout the loan tenure for bank comfort.
- Project IRR, equity IRR, NPV and payback period: These metrics determine whether the project creates value for promoters.
A critical insight: lower nominal refining cost does not always translate to higher IRR if it requires substantially higher CAPEX or working capital. The financial model must evaluate lifetime cash flows, not single-year snapshots.
For promoters evaluating solvent extraction plant feasibility, ROI and IRR alongside downstream refining, the financial model should integrate both stages while keeping extraction-stage and refining-stage economics clearly separated.
Illustrative 100 TPD Refinery Case Study: Physical vs Chemical Refining
Case set-up: A 100 TPD multi-seed refinery in India, processing a defined crude mix. All numbers are hypothetical illustrations for methodology demonstration.
Common assumptions:
- Crude oil cost: ₹90,000/MT (blended average)
- Refined oil realisation: ₹1,00,000/MT
- By-product value (deodoriser distillate/soapstock): ₹15,000–25,000/MT as applicable
- Operating days: 330/year
- Capacity utilisation: 90% (effective 90 MT/day)
- Annual crude processed: 29,700 MT
Scenario A – Predominantly physical refining:
- Neutral oil loss: 1.1%
- Direct refining OPEX: ₹1,950/MT
- Annual saleable refined oil: 29,700 × 98.9% ≈ 29,373 MT
- Annual refining cost: 29,700 × ₹1,950 = ₹5.79 crore
Scenario B – Predominantly chemical refining:
- Neutral oil loss: 2.5%
- Direct refining OPEX: ₹2,690/MT
- Annual saleable refined oil: 29,700 × 97.5% ≈ 28,958 MT
- Annual refining cost: 29,700 × ₹2,690 = ₹7.99 crore
Comparison summary:
| Parameter | Scenario A (Physical) | Scenario B (Chemical) |
|---|---|---|
| Annual saleable refined oil (MT) | 29,373 | 28,958 |
| Additional oil recovered (MT) | +415 | Base |
| Total refining cost (₹ crore/year) | 5.79 | 7.99 |
| Annual refining cost saving (₹ crore) | 2.20 | – |
| Value of additional oil at ₹1,00,000/MT (₹ crore) | 4.15 | – |
| Total annual advantage (₹ crore) | ~6.35 | Base |
| Incremental CAPEX for physical route (₹ crore, assumed) | 1.50–3.00 | – |
| Simple payback on incremental investment | ~3–6 months | – |
This illustration assumes consistent crude quality suitable for physical refining. If crude phosphorus is variable or frequently exceeds thresholds, physical refining’s theoretical advantage may be eroded by off-spec batches, reprocessing costs and quality complaints.
Under the stated assumptions, physical refining emerges as financially superior – but the conclusion holds only if the feedstock quality assumption is valid. A change in crude mix or crude quality could reverse the result, which is why sensitivity analysis is essential.
Sensitivity Analysis and Key Investment Risks
Serious promoters must test downside and upside cases rather than relying on a single base projection. The choice between physical and chemical refining introduces technology-specific sensitivities that must be explicitly modelled.
Key sensitivity variables:
- Crude oil price volatility: A ₹5,000/MT change in crude cost alters annual raw material outflow by ₹14.85 crore for a 100 TPD plant – dwarfing refining cost differences and stressing working capital.
- Refined oil realisation and margin compression: If the refining margin contracts by ₹2,000/MT, annual contribution drops by ₹5.94 crore.
- Oil recovery (±0.25–0.50 percentage points): As demonstrated above, small recovery changes can swing annual contribution by ₹0.55–1.30 crore.
- Energy and chemical cost escalation: A 15% increase in steam cost raises physical refining OPEX by approximately ₹135/MT; chemical refining by approximately ₹180/MT.
- Capacity utilisation slippage: Dropping from 90% to 75% utilisation reduces throughput by 4,950 MT/year, compressing fixed cost absorption and DSCR.
- Interest rate changes: A 100 basis point increase on a ₹15 crore term loan adds approximately ₹15 lakh to annual interest outflow.
Three-scenario framework:
| Scenario | Crude Price | Capacity Utilisation | Oil Recovery (Physical) | Indicative DSCR Impact |
|---|---|---|---|---|
| Pessimistic | +10% | 75% | 1.3% loss | DSCR may fall below 1.25× |
| Base | As assumed | 90% | 1.1% loss | DSCR comfortable at 1.40–1.60× |
| Optimistic | –5% | 95% | 0.9% loss | DSCR above 1.80× |
Technology-specific risks:
- Physical refining is sensitive to crude phosphorus spikes – a single large batch of high-phosphorus crude can produce off-spec oil requiring reprocessing.
- Chemical refining faces escalating effluent treatment costs as pollution control norms tighten. Polycyclic aromatic hydrocarbons, unsaturated fatty acids degradation products and other contaminants in wastewater require monitoring.
- Both routes face risk from oil degradation during prolonged storage of crude or inadequate frying oils management in downstream distribution.
For promoters seeking detailed financial projections, CMA Data and DSCR analysis for their specific project configuration, professional preparation is essential.
Environmental, Quality and Regulatory Considerations in India
Technology selection must satisfy regulatory, food safety and environmental norms that banks will scrutinise during project appraisal.
- FSSAI licensing and standards: All refined edible oils must comply with FSSAI standards for parameters including FFA, peroxide value, moisture, colour, and contaminants. The choice between refining methods depends on oil quality and processing goals, but both routes must ultimately meet the same finished product specifications for food safety. Promoters should verify the latest standards directly from FSSAI.
- Pollution Control Board consent: State PCB clearance is required for air emissions, water discharge and hazardous waste management. Physical refining’s lower effluent load may simplify compliance, while chemical refining’s larger wastewater volumes (alkaline wash water, soapstock residues) require more extensive ETP capacity and monitoring.
- Boiler and pressure vessel safety: High temperature deodorisation equipment (particularly in physical refining at 220–250 °C) and pressure vessels must comply with Indian Boilers Act and factory safety regulations.
- Quality control infrastructure: An in-house laboratory capable of testing FFA, phosphorus, colour, moisture, peroxide value, linolenic acid content and minor glyceridic compounds is essential regardless of refining route. Both methods must demonstrate that refined oil quality meets shelf life requirements and is free from excessive polycyclic aromatic hydrocarbons and other contaminants. Refining can produce 3-MCPD-esters, affecting oil safety – a concern that regulators are increasingly monitoring.
Promoters are strongly advised to consult qualified legal and environmental professionals for site-specific compliance requirements. This article provides general guidance, not legal assurances.
How Should Investors Select the Right Refining Technology?
Rather than approaching this as a theoretical comparison, investors should follow a structured decision framework:
- Analyse intended crude oil mix: Identify the primary oils to be processed (palm, soybean, sunflower, rice bran, etc.), their expected source and typical quality parameters. Conduct laboratory testing on representative crude samples for FFA, phosphorus, metals, moisture and colour.
- Prepare mass and energy balances: For both physical and chemical refining routes using the specific crude mix. This reveals actual steam, power, chemical and bleaching earth requirements.
- Obtain alternative machinery quotations: From at least 2–3 reputable suppliers, with explicit guarantees on refining loss (%), steam consumption (kg/MT), power consumption (kWh/MT) and throughput capacity.
- Estimate CAPEX and OPEX for each route: Including ETP, utilities, automation, civil works and pre-operative expenses. Use a consistent financial model with identical assumptions except for the technology-specific parameters.
- Evaluate environmental and effluent implications: Assess ETP capacity requirements, water consumption and likely compliance costs for each route.
- Run financial projections and DSCR/IRR analysis: For each configuration over a minimum 10-year projection period.
- Conduct sensitivity analysis: On crude quality (phosphorus, FFA), crude price, oil recovery, energy costs and capacity utilisation.
- Take independent technical and financial advice: Before finalising EPC contracts or committing to equipment orders.
Quick-reference technology-selection checklist:
- ☐ Crude oil quality tested and documented (FFA, phosphorus, metals, moisture)
- ☐ Mass and energy balances prepared for both routes
- ☐ Vendor quotations obtained with performance guarantees
- ☐ CAPEX and OPEX comparison completed on consistent basis
- ☐ ETP and environmental compliance requirements assessed
- ☐ Financial projections, DSCR and IRR computed for each route
- ☐ Sensitivity analysis conducted on key variables
- ☐ Independent technical validation obtained for chosen process
Professional Recommendations from CA Manish Gugliya
Based on my experience preparing financial feasibility studies and DPRs for industrial projects, I offer the following advisory points for promoters evaluating edible oil refinery investments:
- Do not select the refinery route solely on the lowest machinery price. Evaluate lifetime oil-loss and energy economics. A machine that saves ₹50 lakh upfront but loses an additional 0.3% oil annually costs far more over 15 years.
- Insist on credible, documented guarantees for oil recovery, steam consumption and power consumption from equipment suppliers. Reflect these guarantees – not aspirational figures – in your financial model.
- Plan realistic working capital based on actual crude oil inventory cycles, creditor terms and seasonal procurement patterns. Crude oil inventory is typically the largest working capital component.
- Ensure DSCR remains comfortable even in downside scenarios. A project that shows DSCR of 1.50× at 90% utilisation but falls below 1.20× at 75% utilisation is fragile.
- Consider future flexibility to handle different oilseeds or change crude mix. A physical refining plant designed exclusively for palm oil may not handle soybean crude without significant upgrades.
- Seek independent technical validation of process design, especially when adopting physical refining for phosphorus-sensitive oils like soybean or sunflower. The cost of independent technical review is negligible compared to the cost of a poorly designed plant.
- Complete a comprehensive DPR and viability study before committing to large CAPEX. The DPR should explicitly compare both refining routes with project-specific assumptions.
- Engage with your lender early – share the technology rationale, environmental compliance approach and financial projections as part of a well-structured CMA Data package.
Detailed Project Report (DPR) and Project Finance Advisory Support
At ProjectReportBank.com, I – CA Manish Gugliya – prepare customised Detailed Project Reports and financial models specifically for edible oil refinery projects, including technology-option evaluation for physical vs chemical refining.
A professionally prepared DPR adds value by:
- Comparing physical vs chemical refining options with project-specific crude quality, capacity and market assumptions.
- Including detailed project cost estimation, means of finance and loan structuring.
- Providing 5–10 year financial projections with revenue, EBITDA, depreciation, interest, tax and net profitability.
- Preparing DSCR analysis, project IRR, equity IRR, NPV and payback period computations.
- Completing CMA Data and bankable loan proposals aligned with lender expectations.
- Supporting investor-ready documentation for equity, debt or debt-equity funding.
- Incorporating sensitivity analysis and risk-mitigation strategies tailored to the chosen technology route.
If you are a serious industrial promoter evaluating an edible oil refinery investment – whether a new greenfield project or a technology upgrade for an existing plant – I invite you to discuss your requirements through ProjectReportBank.com. Professional DPR preparation and financial feasibility advisory are available for projects across India.
Physical vs Chemical Refining: Which Should You Choose?
Choose physical refining when:
- Your primary feedstock is palm oil, palmolein, coconut oil or other low-phospholipid crude oil.
- Crude oil quality is consistently high and can be maintained with reliable sourcing.
- Plant capacity is 100 TPD or above, where OPEX savings justify any incremental CAPEX.
- Environmental compliance is a priority and you want to minimise effluent load.
- You want to produce refined edible oils based on better nutrient retention (e.g., oryzanol-rich rice bran oil for premium markets).
Choose chemical refining when:
- Your crude oil mix is variable, high in phospholipids or sourced from multiple suppliers with inconsistent quality.
- Processing high-phosphorus oils (soybean, cottonseed, groundnut) without investment in deep or enzymatic degumming.
- Plant capacity is small (≤ 50 TPD) and the cost of high-specification deodorisers and vacuum systems is disproportionate.
- Technical manpower availability is limited and operational simplicity is preferred.
- The oil industry environment in your region favours chemical refining infrastructure and soapstock handling channels.
Crude oil quality and oil losses drive refining economics far more than the nominal label “physical” or “chemical.” A physical refining plant processing unsuitable crude will underperform a well-operated chemical refinery. The final choice should always be based on a project-specific DPR, financial modelling and sensitivity analysis – not on generic benchmarks or equipment seller recommendations.
Frequently Asked Questions on Physical vs Chemical Refining of Edible Oils
The following FAQ addresses common investor queries when finalising refinery technology for edible oil projects in India.
What is the main difference between physical and chemical refining?
- The key distinction lies in how free fatty acids are removed. Physical refining removes free fatty acids during deodorization through steam distillation under high temperature and reduced pressure. Chemical refining uses alkaline neutralization – sodium hydroxide reacts with FFA to form soap, which must be separated from the oil.
- Both routes share common steps: degumming (removes phospholipids using water or acid), bleaching (uses activated clay to absorb color pigments and impurities), and deodorization (involves steam distillation to remove odors and flavors). Physical refining skips neutralization, removing free fatty acids during deodorization.
- The implications differ significantly for neutral oil loss (chemical refining produces soap that must be separated and causes higher oil entrainment losses), chemical usage, and effluent generation.
Which refining process generally has lower operating costs per tonne?
- For suitable crude oils with low phosphorus, physical refining often offers lower net cost due to better oil recovery (~1.0–1.2% loss vs ~2–3%) and lower chemical and effluent treatment costs.
- Chemical refining may be competitive for small-capacity plants or when processing high-phosphorus crude where the cost of deep degumming for physical refining offsets the savings.
- Refer to the illustrative cost comparison tables in this article for indicative per-MT breakdowns. Actual costs must be derived from project-specific analysis.
Is physical refining suitable for soybean oil?
- Conventional practice for soybean oil is chemical refining due to crude phosphorus levels of 200–600 ppm. Physical refining is technically possible but requires deep degumming (acid or enzymatic) to bring phosphorus below 5–10 ppm.
- If phosphorus is not adequately reduced, the high deodorisation temperatures cause colour fixation, producing darkened or off-flavoured refined oil.
- Investors should evaluate both options during the DPR stage with realistic crude quality assumptions and laboratory testing on representative samples.
Which refining technology is preferable for palm oil and palmolein?
- Physical refining is the global standard for palm oil and palmolein due to their high FFA content (3.5–4.5% in crude palm oil) and naturally low phospholipid levels.
- Chemical refining of palm oil is possible but typically less economical because soapstock losses are high when FFA exceeds 2%.
- Pre-treatments such as dry degumming are standard; fractionation into palmolein and palm stearin is a separate downstream process.
How do refining losses affect refinery profits and DSCR?
- A 0.50 percentage-point improvement in oil recovery for a 100 TPD plant can generate approximately ₹1.1–1.5 crore additional annual gross margin at illustrative oil prices.
- This flows directly into EBITDA and cash flow available for debt service, potentially improving DSCR from marginal (1.20–1.25×) to comfortable (1.40–1.50×) levels.
- Promoters should focus on guaranteed refining losses in machinery contracts and reflect these in the financial model rather than using optimistic assumptions.
What is the typical operating cost of a 100 TPD edible oil refinery in India?
- There is no single universally applicable benchmark. Actual operating cost depends on the refining route, crude mix, energy source, location and operational efficiency.
- The illustrative per-MT breakdown in this article suggests direct processing costs in the range of ₹1,950–2,690/MT depending on route, before accounting for the economic value of oil losses.
- For serious investment decisions, customised costing through a project-specific DPR is essential.
Which process usually requires higher capital investment?
- For small capacities (≤ 50 TPD), chemical refining typically has lower initial CAPEX because deodorisation equipment is simpler and degumming requirements are less demanding.
- For larger, integrated plants (100 TPD and above), the CAPEX gap narrows as physical refining’s savings on ETP, washing systems and chemical storage offset the higher cost of deodorisers and vacuum systems.
- Complete project cost comparison must include utilities, ETP, automation, civil works and pre-operative expenses – not only core process machinery.
How do FFA and phosphorus influence technology selection?
- High free fatty acid content (above ~2%) tends to favour physical refining because soapstock losses in chemical refining escalate proportionally with FFA.
- High phosphorus and non-hydratable gums push towards chemical refining because the neutralisation step itself reduces phosphorus, compensating for imperfect degumming.
- Laboratory testing and trial runs on representative crude samples are essential. Phosphorus limits for physical refining are stringent (≤ 5–10 ppm post-degumming), making deep-degumming capability crucial.
Can an existing chemical refining plant be converted to physical refining?
- Partial or full conversion is sometimes technically feasible but typically requires major upgrades: enhanced degumming section (acid or enzymatic), upgraded or replaced deodoriser capable of handling deacidification at 220–250 °C, and more robust vacuum systems.
- A detailed engineering study and cost-benefit analysis should precede any conversion decision. The payback depends on feedstock suitability, incremental CAPEX required and projected oil recovery improvement.
- Both process technologists and financial advisers should be involved to evaluate whether the conversion investment delivers adequate returns.
What financial parameters should be evaluated before investing in a refinery?
- Key ratios and indicators include: DSCR (minimum 1.25–1.50× throughout loan tenure), project IRR (should exceed weighted average cost of capital), equity IRR, NPV, payback period, break-even volume and contribution margin per MT.
- Downside scenarios for crude price, oil recovery and capacity utilisation must be tested – a project viable only under optimistic assumptions is not bankable.
- Lenders in India focus heavily on DSCR, realistic working capital assessment and the promoter’s ability to sustain operations during margin compression periods.
What should an edible oil refinery DPR include, particularly regarding refining technology?
- A comprehensive DPR should include: market analysis, technical configuration (with explicit comparison of physical vs chemical refining for the intended crude mix), capacity planning, detailed cost estimates, means of finance, 5–10 year financial projections and ratio analysis.
- The DPR must clearly document crude quality assumptions, expected refining losses, steam and power consumption, chemical requirements and by-product realisations for the chosen route.
- Sensitivity analysis and risk-mitigation strategies are essential components – banks increasingly expect these in project appraisal documentation.
How does refining technology choice affect bank finance and loan approval?
- Banks examine technology robustness, environmental compliance provisions, projected cash flows and DSCR over the entire loan tenure.
- A technology choice that delivers better, more predictable oil recovery and lower controllable OPEX strengthens the project’s viability metrics, improving the chances of loan approval at favourable terms.
- Presenting a well-documented, bankable DPR and CMA Data package – aligned with the chosen technology route and supported by vendor guarantees – is critical for successful project financing.
Does the refining process affect the nutritional quality of edible oils?
- Yes. Refining removes 10–32% of sterols in oils regardless of method, and chemical refining can lead to 26.8–79.4% loss of tocopherols. Refining generates harmful compounds like trans-fatty acids under certain conditions.
- Physical refining retains more nutrients than chemical refining overall, particularly heat-sensitive bioactives like oryzanol in rice bran oil. However, high operational temperatures in physical refining can lead to thermal degradation of oil if not carefully controlled.
- The choice between physical and chemical refining can therefore affect product positioning, premium pricing potential and brand differentiation in health-conscious edible fats and oils markets.
Author: CA Manish Gugliya, FCA, DISA (ICAI) Chartered Accountant | Industrial DPR & Project Finance Advisory ProjectReportBank.com