
A 3-star hotel does not earn money from rooms alone. Revenue flows from multiple operational areas – restaurants, banquets, conferences, laundry, parking and several other services – and the mix between these streams determines the financial viability of the entire project. This article breaks down how each revenue stream works, how to calculate it, and how it fits into a bankable hotel DPR.
Key Takeaways
- A 3 star hotel revenue model covers four major streams: rooms, food and beverage, banquets/events and ancillary services. Projecting only “rooms × tariff” misses 30–50% of actual operating income.
- Room revenue typically accounts for 55% to 70% of total revenue in many Indian mid-scale hotels, though properties with strong banquet operations may see rooms contribute as low as 45–50%.
- Hotel occupancy, ARR/ADR and RevPAR are the three critical assumptions that drive room revenue projections. A realistic occupancy ramp-up over 2–3 years is far more credible to lenders than assuming 70%+ from Year 1.
- Revenue assumptions directly influence gross operating profit, EBITDA, cash accrual and DSCR – the metrics banks scrutinise most in term-loan proposals.
- From a practical DPR perspective, reasonable and internally consistent assumptions (not inflated numbers designed to produce a desired DSCR) are essential for project finance approval.
Explore 3-Star Hotel Project Report Guides
Explore our complete 3-Star Hotel Project Report and DPR guides covering setup cost, equipment, project cost, revenue, financial projections, occupancy, feasibility, project finance and bank loan assessment.
Introduction – 3 Star Hotel Revenue Model from a DPR & Finance Perspective
Three-star hotels occupy the mid-scale market segment in India, serving business travellers, leisure tourists, wedding guests and conference delegates across Tier I, II and III cities, highways and tourist corridors. Whether it is a 30-room boutique property in a district headquarters or a 75-room hotel along a national highway, the revenue model follows a common logic – but the assumptions behind it must reflect local realities.
I write this as CA Manish Gugliya, associated with ProjectReportBank.com, drawing on experience preparing hotel DPRs, CMA data and financial projections for bank loans between 2015 and 2026. What I have consistently observed is that banks, NBFCs and investors do not simply look at topline revenue. They analyse how room revenue, F&B income, banquet bookings and ancillary revenue streams combine to produce gross operating profit and whether the resulting cash accrual can service debt obligations.
This article focuses specifically on revenue modelling – occupancy, ARR, seasonal patterns, guest segments, business mix and constrained demand that shape hotel revenue projections in India. It is worth noting that 81% of hotel executives expect a service model shift, which makes realistic, adaptable revenue assumptions even more critical. For the investment side of the equation, readers can refer to our guides on 3-star hotel setup cost in India and 3-star hotel project cost and means of finance.
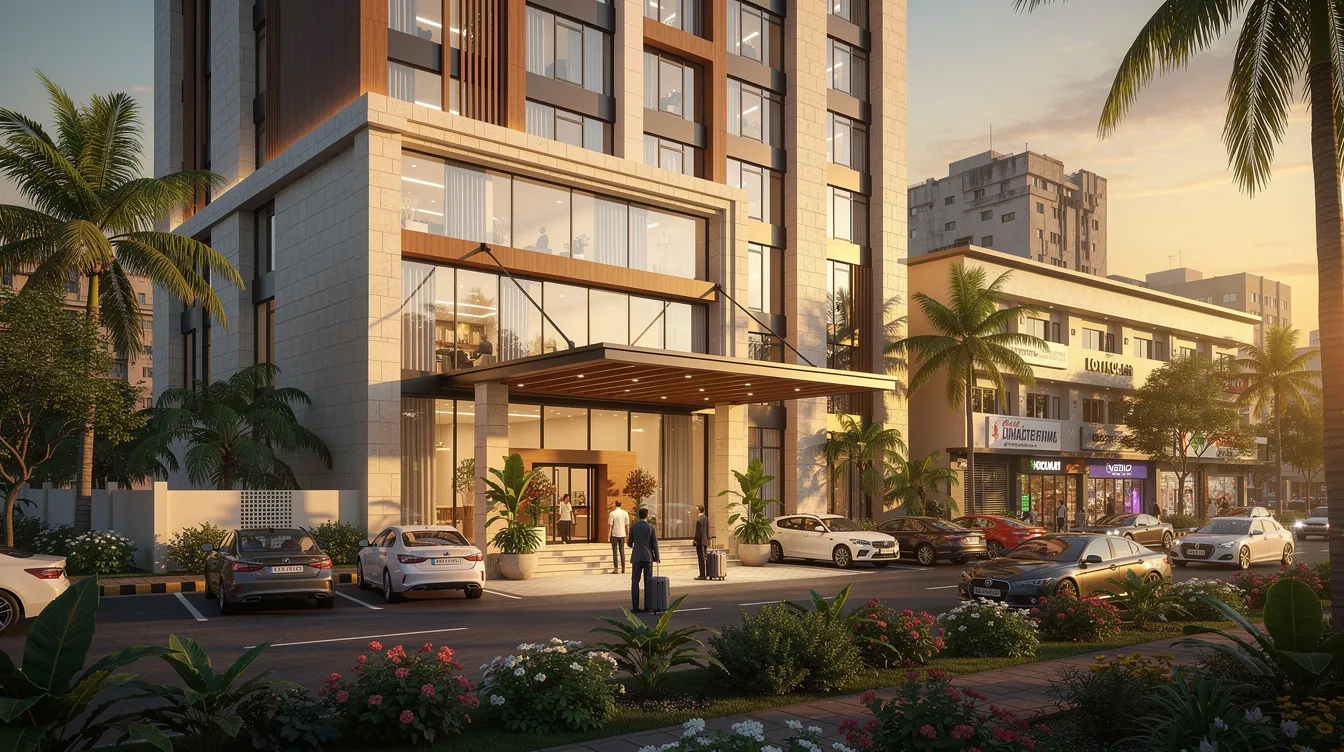
Overview of 3-Star Hotel Revenue Streams
The primary revenue streams of a 3-star hotel include room sales, restaurant and F&B income (breakfast, lunch, dinner, bar, room service), banquet and conference revenue, and ancillary services such as laundry, parking, transport and business centre charges. Three-star hotels use a diverse revenue model centered on rooms, food and beverage, and extra services. Three-star hotels typically offer a balanced core of room and food and beverage revenue, with banquets acting as a variable multiplier.
The revenue mix differs substantially between property types. A city business hotel earns more from weekday corporate room stays and conference bookings, while a leisure or wedding-focused property generates significant weekend banquet revenue. Revenue management optimizes pricing to match travel demand across these different market segments.
| Revenue Stream | Main Driver | Typical Calculation Approach |
|---|---|---|
| Rooms | Rooms × occupancy × ARR | Available room nights × occupancy % × ARR |
| Restaurant / F&B | Covers × average spend | Daily covers × average bill × operating days |
| Banquet / Events | Events × billing | Number of events × average revenue per event |
| Conferences | Delegates / events | Events × average package billing |
| Room Service | Occupied rooms | % of occupied rooms × average spend |
| Laundry / Other | Guest usage | Usage-based or per-occupied-room assumption |
Common KPIs tied to these streams include ADR/ARR, RevPAR, TRevPAR and gross operating profit per available room. The exact revenue composition must be customised for each DPR based on location, facilities and guest segmentation.
Room Revenue – Core of the 3 Star Hotel Revenue Model
Room revenue is usually the single largest revenue line in a 3 star hotel revenue model and the primary driver of cash flow stability. In Indian mid-scale hotels, room revenue contributes roughly 50–65% of total operating income, though this varies with banquet capability. Industry data for Indian mid-scale hotels shows occupancy of approximately 63.6% and ADR around ₹4,806 in 2023.
The key terms every promoter must understand:
- Available Room Nights (ARN) = Number of Rooms × 365
- Occupied Room Nights (ORN) = ARN × Occupancy %
- Room Revenue = ORN × ARR
- RevPAR = Room Revenue ÷ ARN, or equivalently, ARR × Occupancy %
RevPAR balances pricing versus volume and is calculated as ADR times occupancy rate. It is the single most-watched metric in the hotel industry for comparing hotel performance across properties.
Market segmentation helps tailor strategies for different traveler types. Corporate guests, leisure travellers, group bookings, OTA-sourced guests and direct bookings each carry different rate profiles and booking patterns. Segmenting guests by travel reason enhances targeted marketing efforts, while effective segmentation can identify high-value guest groups. Blended segmentation combines booking method and travel reason to give a more nuanced picture. Customer segmentation allows three-star hotels to have different packages for varying customer willingness to pay.
Hotels often try to increase direct bookings while using OTAs to generate demand. Direct bookings generate significantly higher net revenue per reservation, and every percentage point of direct booking share improves net revenue per room. Optimizing online presence can significantly boost direct bookings, and a well-optimized website can increase conversion rates for direct bookings. Repeat guests generate more direct bookings and lower cancellations, which is why loyalty program membership grew 14.5% in 2024, with loyalty programs now having over 675 million members globally. Notably, 48% of loyal customers expect personalized experiences from businesses they are loyal to.
Illustrative Room Revenue Calculation – 50-Room 3-Star Hotel
Consider a 50-room 3-star hotel operating 365 days per year. Available room nights = 50 × 365 = 18,250. Assuming an illustrative ARR of ₹3,200 (a conservative mid-market figure for a Tier II/III city):
| Occupancy % | Occupied Room Nights | Annual Room Revenue (₹) | RevPAR (₹) |
|---|---|---|---|
| 50% | 9,125 | 2,92,00,000 | 1,600 |
| 60% | 10,950 | 3,50,40,000 | 1,920 |
| 70% | 12,775 | 4,08,80,000 | 2,240 |
| 80% | 14,600 | 4,67,20,000 | 2,560 |
All figures are illustrative assumptions, not industry benchmarks.
A 10-percentage-point shift in occupancy moves annual room revenue by approximately ₹58–59 lakhs in this example. Lenders routinely test room revenue projections against such scenarios to assess downside risk. If occupancy drops from 70% to 60%, the hotel loses nearly ₹58 lakhs in room revenue alone – a material impact on cash accrual and DSCR.
Impact of ARR / ADR on Room Revenue
ARR (Average Room Rate) is the average realised room rate net of discounts and commissions. A seemingly modest change of ₹200–₹500 per night can move annual room revenue by lakhs. Higher-star hotels can command substantially higher ADR due to stronger brand positioning, but within the 3-star segment, ARR reflects location, service quality, distribution channels and competitor pricing.
Sensitivity Table: Annual Room Revenue (₹ in Lakhs) for a 50-Room Hotel
| Occupancy | ARR ₹3,000 | ARR ₹3,500 | ARR ₹4,000 |
|---|---|---|---|
| 50% | 273.75 | 319.38 | 365.00 |
| 60% | 328.50 | 383.25 | 438.00 |
| 70% | 383.25 | 447.13 | 511.00 |
| 80% | 438.00 | 511.00 | 584.00 |
Calculated as: 18,250 × Occupancy % × ARR. All figures illustrative.
Dynamic pricing adjusts room rates based on real-time demand signals. In practice, dynamic pricing can change room rates multiple times a day, considers competitor pricing and market demand, and helps maximize occupancy during peak demand periods. AI-enabled revenue management systems can increase RevPAR by 5–10%, making sophisticated technology a worthwhile investment even for independent hotels. ARR in financial projections usually grows gradually year-on-year (5–8%) based on inflation and brand build-up, not through sudden jumps. Employing effective pricing strategies and distribution strategies (balancing OTAs with direct bookings via the hotel’s booking engine) is essential for protecting margin.

Occupancy Ramp-Up & Seasonality for New 3-Star Hotels
A new 3-star hotel should generally not be projected at stabilised 70–75% occupancy from the first financial year. BrandSync’s KPI reference indicates midscale occupancy ranges of 64–76% for established properties, but smaller hotels in less mature markets typically begin lower.
A practical ramp-up framework commonly used in DPRs:
- Year 1 (soft opening): 35–50% occupancy
- Year 2 (brand establishment): 55–65% occupancy
- Year 3 onward (stabilisation): 65–72% occupancy
Seasonality affects room prices during holidays and local festivals. Wedding months (October–February in most of India), peak tourism seasons and local events drive higher bookings, while monsoon and lean months depress both occupancy and room pricing. Weekday vs weekend patterns matter: a business hotel may see strong Monday-to-Thursday bookings but low weekends, while a wedding venue may show the reverse. These seasonal patterns feed into the average annual occupancy used in the 3 star hotel revenue calculation.
Key factors influencing occupancy include location, tourism cycle, corporate presence, highway traffic, online reviews and guest reviews, sales efforts, booking pace and constrained demand during peak nights. Conservative ramp-up assumptions make a hotel revenue model more acceptable during bank appraisal.
Food & Beverage (F&B) Revenue Model for a 3-Star Hotel
Food and beverage usually contributes 20% to 30% of total revenue in Indian 3-star hotels, though properties with strong restaurant operations or bar licenses can push this higher. Three-star hotels provide limited food and beverage options like a casual breakfast or coffee shop compared to luxury properties, but well-managed F&B operations can still generate meaningful revenue.
The core projection formula:
Restaurant Revenue = Average Daily Covers × Average Spend per Cover × Operating Days
F&B revenue should be analysed separately for:
- Resident guest consumption (linked to occupied rooms – for example, 60–70% of occupied rooms may use the restaurant)
- Walk-in customers (depends on location, reputation and local eating-out culture)
- Complimentary vs paid breakfast (complimentary breakfast reduces F&B revenue but may improve room bookings and customer satisfaction)
- Room service revenue (often estimated as ₹150–₹300 per occupied room or as a percentage of total F&B)
The hospitality industry increasingly recognises that 49% of hotel executives agree upselling is critical for revenue. Upselling services – such as upgrading meal plans, bundling spa treatments to encourage guests to spend more, or offering premium dining packages – increases revenue from existing hotel guests without extra marketing spend. Hotels using AI-powered upselling platforms see higher conversion rates on these offers.
F&B revenue should not be assumed as an arbitrary fixed percentage of room revenue. Base it on seating capacity, table turns, guest segmentation and local market demand instead.
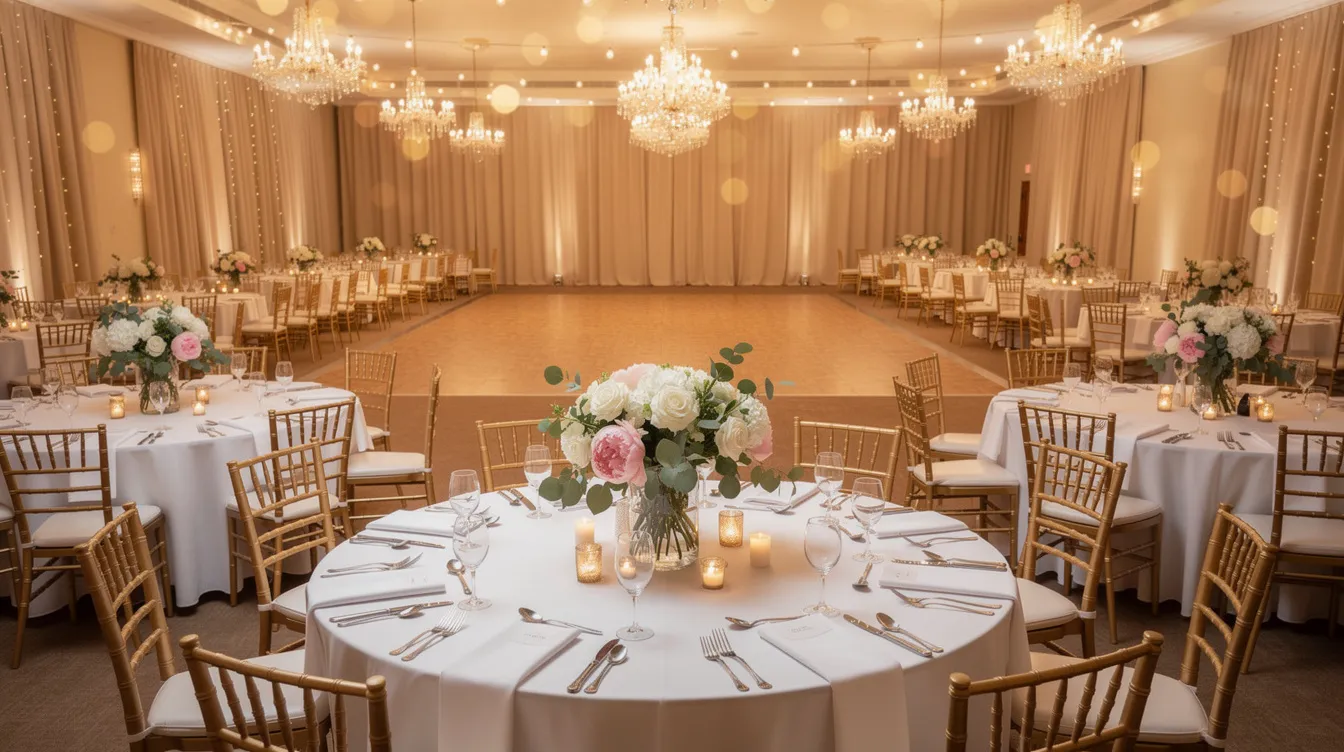
Banquet, Conference & Event Revenue Model
Banquet and conference operations can be a game-changer for 3-star hotels positioned in wedding markets, corporate hubs or district headquarters. Hotels should treat event spaces as a dedicated revenue line rather than a secondary add-on. Event spaces generate high-margin revenue independent of room occupancy – a full conference room can produce income without displacing room nights.
The main formula:
Annual Banquet Revenue = Number of Events per Year × Average Revenue per Event
Revenue components per event may include hall rental, food packages, AV/equipment charges, decoration coordination and service charges.
Event categories to consider:
- Weddings and large social functions (highest billing per event)
- Corporate meetings and training programmes
- Small social gatherings (birthdays, anniversaries)
- Conferences, seminars, local community events
Midweek daytime slots are often high-opportunity gaps for event spaces that many hotels underutilise. Event space revenue can be maximized with tiered packages for different uses – a half-day corporate seminar package priced differently from a full-day wedding venue package.
Capacity constraints matter: hall size, parking availability, kitchen throughput and available room inventory for outstation guests all limit or support banquet revenue potential. Events also generate additional room bookings and incremental F&B revenue, but the DPR should avoid double counting.
Illustrative Banquet Revenue Example for a 3-Star Hotel
Consider a hotel with one main banquet hall (200-person capacity) and one conference room (50-person capacity) in a Tier II city. All figures below are illustrative assumptions:
| Event Category | Events/Year | Avg. Billing (₹) | Annual Revenue (₹) |
|---|---|---|---|
| Weddings / Large Social | 18 | 3,00,000 | 54,00,000 |
| Corporate Events | 24 | 1,00,000 | 24,00,000 |
| Small Social Functions | 30 | 50,000 | 15,00,000 |
| Conferences / Training | 20 | 40,000 | 8,00,000 |
| Total | 92 | 1,01,00,000 |
Wedding events cluster in October–February and again in April–May (regional variations apply). Corporate events tend to spread across the year but dip during holiday seasons. Bankers often ask promoters to justify event assumptions with data on local marriage halls, existing hotel banquet occupancy and engagement with event planners.
Other / Ancillary Revenue Streams in a 3-Star Hotel
Typical ancillary revenue items include laundry, airport transfers, local transport, parking charges, business centre, extra beds, early check-in and late check-out fees, travel desk commissions, and gym or spa revenue where applicable. Ancillary income generates 5% to 10% of total revenue through these minor streams like late check-out fees. Loyalty fees average $5.46 per occupied room in many chain-affiliated properties.
Ancillary revenue is often projected either as a per-occupied-room amount (e.g. ₹200–₹400 per occupied room night) or as a percentage of room revenue. Local partnerships generate revenue through direct commission or referral income – for instance, tie-ups with cab aggregators, travel agents or local tour operators. Hotels partnering with local businesses can offer exclusive experiences, and experience-driven guests increasingly prioritize curated local experiences. Curated local experiences attract higher-value guests to hotels, improving both guest satisfaction and per-guest spending.
Only services the hotel will genuinely provide should be included in the DPR. Inflated “other income” lines are a common red flag during bank appraisal.
Consolidated Revenue Model & Revenue Mix Illustration
Here is an illustrative stabilised-year (Year 3) revenue statement for a 50-room 3-star hotel with banquet facilities:
| Revenue Stream | Annual Revenue (₹ Lakhs) | % of Total |
|---|---|---|
| Room Revenue | 408.80 | 53% |
| F&B Revenue (Restaurant + Room Service) | 176.00 | 23% |
| Banquet / Conference Revenue | 101.00 | 13% |
| Other / Ancillary Income | 84.20 | 11% |
| Total Operating Revenue | 770.00 | 100% |
All figures are illustrative. Actual percentages depend on location, facilities and guest mix.
A highway property may be room-heavy (65–70% from rooms), while a wedding-focused city property may show banquets contributing 20%+ of total revenue. From a project finance viewpoint, lenders prefer a coherent revenue mix where each stream’s assumptions align with available room capacity, halls and F&B infrastructure.
Revenue Model for 30, 50 and 75-Room 3-Star Hotels
Revenue modelling for different hotel sizes cannot be a simple linear multiplication. F&B capacity, banquet space, staffing and fixed costs scale differently.
| Parameter | 30-Room | 50-Room | 75-Room |
|---|---|---|---|
| Restaurant Seats | 30–40 | 50–70 | 80–120 |
| Banquet Capacity | Limited (50–100 pax) or none | 150–250 pax | 300–500 pax |
| Primary Revenue Driver | Rooms (65–70%) | Balanced rooms + banquets | Strong banquet + conference |
| Ancillary Scope | Minimal | Moderate | Higher (spa, gym, transport) |
Larger properties create more scope for dynamic pricing strategies, guest segmentation and business mix optimisation across different market segments, but also require higher occupancy and ARR to cover a stronger fixed cost base. Promoters should align revenue potential with CAPEX using the detailed breakdown in 3-star hotel setup cost in India.
Linking Revenue Model with Project Cost & FF&E Investment
A credible 3 star hotel revenue model cannot be evaluated in isolation from total project cost. CAPEX decisions – the size of the banquet hall, restaurant capacity, whether a spa is included, parking infrastructure – directly influence achievable revenue streams and operating leverage.
Hotel project feasibility is assessed by comparing stabilised revenue and EBITDA with total investment and debt levels. Over-investing in low-yield areas (e.g. an oversized lobby) or under-investing in revenue-generating spaces (e.g. insufficient banquet capacity in a strong wedding market) can weaken the hotel’s profitability. For detailed cost breakdowns, refer to 3-star hotel equipment, furniture and FF&E cost and 3-star hotel project cost and means of finance.
Revenue Assumptions in a Professional Hotel DPR
A professional DPR converts operational assumptions into 5–10 year financial projections for bank submission. Key revenue assumption blocks include:
- Room inventory and room type distribution
- Occupancy ramp-up path (Year 1 through stabilisation)
- ARR trajectory with annual escalation (typically 5–8%)
- F&B seating capacity, average covers, average spend per cover
- Banquet utilisation by event category
- Ancillary income per occupied room or per service
- Guest segmentation and business mix
These feed into projected P&L: Total Revenue → Operating Expenses → Gross Operating Profit → EBITDA → Depreciation & Interest → PAT and Cash Accrual.
Assumptions must be internally consistent. Higher occupancy increases F&B covers, laundry volumes, utilities, OTA commissions and staffing requirements. Banks often apply their own stress tests to the hotel revenue model, moderating overly aggressive assumptions before approving project finance. Using forward looking data and historical data from comparable hotels strengthens credibility. A revenue manager with access to performance data and advanced analytics can predict demand more accurately and identify patterns in booking pace and market trends.
Revenue, Profitability, Break-Even & DSCR
Higher revenue does not automatically mean higher profit. Operating expenses compress net operating income, requiring strict automation and energy efficiency measures. Understanding fixed costs versus variable costs is essential.
Simple Break-Even Example (50-room hotel):
- Annual fixed costs: ₹2.50 crore (staff, rent, insurance, maintenance)
- Contribution per occupied room (after variable costs): ₹1,800
- Break-even occupied room nights = ₹2,50,00,000 ÷ ₹1,800 = 13,889 room nights
- Break-even occupancy = 13,889 ÷ 18,250 = ~76%
This illustrative example shows why most hotels need F&B and banquet revenue to achieve overall break-even at lower occupancy levels. Employing occupancy and room revenue strategies together with F&B and banquet optimisation improves profitability in three-star hotels.
Revenue flows into EBITDA and then into cash accrual, used to service term-loan instalments. DSCR (Debt Service Coverage Ratio) = Cash available for debt service ÷ Total debt service. Lenders typically require DSCR of 1.25–1.50x. A sustainable profitability profile is far more important than showing very high but unachievable turnover.
Sensitivity Analysis of the 3 Star Hotel Revenue Model
Sensitivity analysis tests the impact of changes in key variables on total revenue and cash flow. This is particularly important because hotel revenue is seasonal and subject to competition, macro events and online reputation.
Illustrative Downside Scenarios (Base: ₹7.70 Cr Total Revenue)
| Scenario | Change | Impact on Total Revenue |
|---|---|---|
| Occupancy 10% lower | 70% → 60% | Room revenue drops ~₹58L; total revenue falls ~8% |
| ARR lower by ₹300 | ₹3,200 → ₹2,900 | Room revenue drops ~₹38L; total revenue falls ~5% |
| Banquet + F&B 20% below projection | Revenue cut ₹55L | Total revenue falls ~7% |
| Combined downside | All three together | Total revenue could fall ~18–20% |
Banks and investors expect this analysis in hotel revenue projections for DPRs, especially for larger projects. In real life, room rates and occupancy cannot both be pushed to extremes – current demand and unconstrained demand behave differently. Dynamic pricing helps maximize revenue during peak demand periods but cannot eliminate competitive and seasonal pressures.
Common Mistakes in 3-Star Hotel Revenue Projections
Based on reviewing multiple Indian hotel DPRs, these are recurring errors:
- Assuming 70–80% occupancy from Year 1 without anchor demand or corporate contracts
- Setting ARR above established competitors without justification from room upgrades or superior positioning
- Ignoring seasonality – projecting uniform monthly revenue throughout the year
- Double-counting banquet food revenue within both banquet and F&B lines
- Overestimating walk-in restaurant guests, especially in locations with limited foot traffic
- Underestimating OTA commissions (15–25%) and their impact on net realised ARR and distribution channels cost
- Applying a uniform 10–15% annual growth rate to all revenue streams regardless of market context
- Ignoring competitive supply – new hotels in the same micro-market that will divide the same demand
- Inflating “other income” with services the hotel has no plans to actually provide (spa packages, tour desk commissions without tour operator tie-ups)
- Treating projected turnover as equivalent to profit
Each of these weakens DPR credibility. Ground the 3 star hotel revenue model in verifiable market data, local benchmarking and practical operating norms rather than numbers designed to produce a desired DSCR.
Illustrative Five-Year Revenue Projection – Stabilisation Path
Below is a simplified 5-year illustration for a 50-room 3-star hotel in a Tier II Indian city. All assumptions are illustrative:
| Parameter | Year 1 | Year 2 | Year 3 | Year 4 | Year 5 |
|---|---|---|---|---|---|
| Occupancy % | 45% | 55% | 65% | 68% | 70% |
| ARR (₹) | 3,000 | 3,200 | 3,400 | 3,550 | 3,700 |
| Occupied Room Nights | 8,213 | 10,038 | 11,863 | 12,410 | 12,775 |
| Room Revenue (₹ L) | 246.38 | 321.20 | 403.33 | 440.56 | 472.68 |
| F&B Revenue (₹ L) | 86.23 | 112.42 | 145.20 | 158.60 | 170.46 |
| Banquet Revenue (₹ L) | 55.00 | 75.00 | 101.00 | 110.00 | 118.00 |
| Other Income (₹ L) | 20.00 | 28.00 | 40.00 | 44.00 | 48.00 |
| Total Revenue (₹ L) | 407.61 | 536.62 | 689.53 | 753.16 | 809.14 |
A gradual stabilisation path – occupancy rising from 45% to 70% over five years and ARR growing at 6–8% annually – appears far more credible to bankers than projecting aggressive occupancy immediately. This type of 5-year view helps align revenue growth projections with the repayment schedule, break-even timeline and overall project finance planning.
CA Manish Gugliya’s Practical Perspective
In my experience preparing and reviewing hotel project reports across Indian cities, the most common reason a DPR faces pushback is not that the numbers are too low – it is that they are too high without supporting logic. The objective of a 3 star hotel revenue model is not to maximise numbers but to present reasonable, defendable and internally consistent assumptions.
I encourage promoters and CAs to build projections starting from operational drivers: rooms → occupancy → ARR → room revenue → F&B and banquet volumes → total revenue → gross operating profit → EBITDA → cash accrual → DSCR. Each link in this chain must hold up to scrutiny.
When discussing projections with credit officers and due-diligence teams, I have found that clear explanation of how each figure is derived – guest segmentation, business mix, booking pace, comparison shopping against local competitors, the revenue management strategy adopted – greatly improves confidence in the proposal. A revenue management system backed by market analysis is more convincing than a flat assumption sheet.
Promoters and professionals seeking a detailed, bankable DPR, CMA data or financial projections for a 3-star hotel project may consider reaching out to ProjectReportBank.com for specialised assistance.
FAQs on 3-Star Hotel Revenue Model
What is a realistic room-to-F&B revenue ratio for a 3-star hotel in India?
In many Indian 3-star hotels, rooms contribute around 50–65% of total operating revenue, with F&B and banquets together contributing 30–45%. A transit or highway hotel with limited banquet facilities tends to be more room-heavy, while a wedding-focused property may show F&B and banquet share exceeding 40%. Promoters should benchmark against comparable local hotels rather than relying on generic industry averages.
How do banks and NBFCs verify the revenue projections in a hotel DPR?
Lenders typically compare projected occupancy and ARR with existing hotels in the micro-market, review tourism indicators and corporate demand data, and sometimes commission external feasibility reports. They run their own stress cases – lowering occupancy by 10%, reducing ARR, or cutting banquet volumes – and check consistency between projected revenue, operating costs, gross operating profit and DSCR. Robust guest segmentation and well-supported banquet assumptions make the revenue model easier to accept.
Can dynamic pricing and online travel agencies be reflected in revenue projections?
Dynamic pricing is incorporated through ARR assumptions that account for seasonal variation and gradual rate improvement as the hotel builds online reputation and demand. Revenue models should distinguish between OTA and direct bookings, reflecting different commission costs and net realised rates. While projections use annual average ARR, the underlying narrative should acknowledge rate flexibility based on market demand, booking pace and constrained demand during peak periods.
How much ancillary income is reasonable to assume in a 3-star hotel revenue model?
Ancillary revenue is typically in the range of 3–8% of total operating revenue for most hotels at the 3-star level, depending on services offered. Rather than using a fixed percentage, estimate per-occupied-room income or project based on planned services. Avoid inflating ancillary income to boost revenue – banks usually discount overly optimistic “other income” lines during appraisal.
What basic inputs should a promoter collect before building a 3-star hotel revenue model?
Essentials include: proposed number and types of rooms (room type mix), tentative tariffs, local competitor occupancy and ARR (the average rate index in your micro-market), likely guest segments, restaurant and banquet capacities, expected event volumes, and any planned ancillary services. Promoters should gather recent rate and occupancy data from comparable hotels, speak with travel agents, wedding planners and corporates, and understand seasonal patterns. These inputs help a consultant or CA convert broad ideas into a structured, bankable 3 star hotel revenue model and 5–10 year financial projection.
Explore More 3-Star Hotel Project Report Guides
Continue exploring our 3-Star Hotel DPR guides covering setup cost, equipment, project cost, revenue, financial projections, occupancy, feasibility, project finance and bank loan assessment.