
Key Takeaways
- A 3-star hotel’s financial viability in India depends on the interaction of occupancy rate, average room rate (ARR), RevPAR and break-even occupancy – not on any single metric alone.
- For a 50-room 3-star hotel, increasing occupancy from 50% to 60% at the same ARR of ₹3,500 adds approximately ₹63.9 lakh in annual room revenue, materially improving EBITDA and DSCR for bank finance.
- Hotel RevPAR calculation (ARR × Occupancy or Room Revenue ÷ Available Room Nights) captures both demand and pricing in one number, making it more useful than occupancy or ARR individually for 3-star hotel financial analysis.
- Realistic ramp-up occupancy, blended ARR and cost assumptions are essential in DPRs, CMA data and project reports for securing term loans from Indian banks and NBFCs.
- A professional hotel financial model must connect: Occupancy → Rooms Sold → Room Revenue → EBITDA → Cash Accrual → DSCR → Loan Repayment Capacity.
Introduction: How Many Rooms Must a 3-Star Hotel Sell to Be Viable?
For a promoter building a 30, 50 or 75 room 3-star hotel in India, the fundamental question is straightforward: how many hotel rooms must be sold daily to cover operating costs, service interest and principal, and still leave surplus?
Simply constructing a hotel does not guarantee revenue. Financial performance is driven by: Available Rooms × Occupancy Rate × ARR. The occupancy rate measures capacity utilization – the percentage of available rooms actually sold. ARR captures the average revenue per available room revpar realizes per sold room. RevPAR combines both into one performance metric. And break-even occupancy tells you the minimum utilization needed to cover costs.
This article, written from the perspective of CA Manish Gugliya of ProjectReportBank.com, draws on practical experience with hotel DPRs, financial projections and bank-finance proposals. Sections ahead include worked numerical examples, hotel break even analysis and sensitivity modelling for a 50-room 3-star hotel – directly useful for project reports, CMA data and investor discussions.
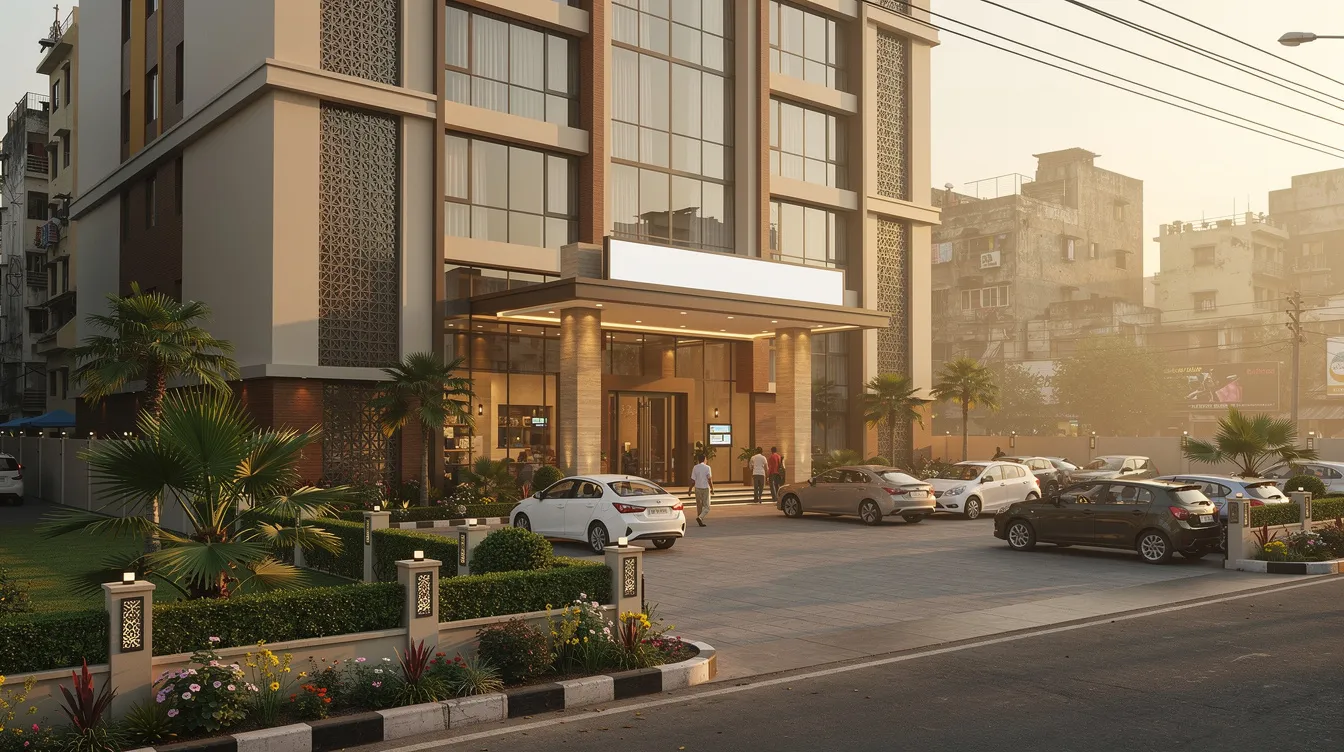
Explore 3-Star Hotel Project Report Guides
Explore our complete 3-Star Hotel Project Report and DPR guides covering setup cost, equipment, project cost, revenue, financial projections, occupancy, feasibility, project finance and bank loan assessment.
What Is Occupancy Rate in a 3-Star Hotel?
Occupancy rate is the percentage of available rooms actually sold in a given period – a core key performance indicator for hotel operators and a direct measure of market demand and capacity utilization.
Occupancy Rate (%) = Rooms Sold ÷ Rooms Available × 100
You can calculate occupancy rate daily, weekly, monthly, or yearly. For instance, an occupancy rate of 80% means 80 out of 100 rooms are occupied on a given night.
Example (50-room 3-star hotel):
- Total available room nights = 50 rooms × 365 days = 18,250 room nights per year
- If 10,950 room nights are sold: Occupancy = 10,950 ÷ 18,250 × 100 = 60%
- For 200 available rooms and 150 occupied rooms on a given night, the occupancy rate would be 75%
Annual occupancy should never be confused with peak-season occupancy. Key considerations:
- Urban hotels see higher weekday occupancy rates due to corporate travel, while leisure destinations peak on weekends and holidays
- Demand fluctuates based on peak tourism seasons and local events – wedding months, pilgrimage seasons and sporting events can create temporary spikes in hotel demand
- Competitor density in the area directly influences both occupancy and pricing power
- Location is a critical factor for hotel occupancy, along with accessibility, airport and railway connectivity
- Higher online ratings and guest reviews correlate with improved occupancy; online reviews significantly impact customer choices at 3-star hotels
- Seasonality can significantly affect hotel occupancy rates – a Rajasthan hotel may see 90% in winter and 30% in summer
The 3-star hotel occupancy rate in India varies substantially across Tier-I, Tier-II and Tier-III cities. According to FHRAI’s 2019-20 survey, average occupancy rates for 3-star hotels nationally were approximately 62.6%. For context, US hotel occupancy reached 63.38% in 2025 post-pandemic. Globally, occupancy is expected to be around 68–70% for 2026. Lenders expect local market justification, not a generic national average.
What Is ARR (Average Room Rate) in a 3-Star Hotel?
ARR is the average room rate actually realized per occupied room – not the printed tariff card. It is a key input for hotel room revenue calculation and revenue projections.
ARR = Total Room Revenue ÷ Number of Rooms Sold
Example: If a 3-star hotel earns ₹30,00,000 in room revenue during a month from 1,000 rooms occupied, then ARR = ₹30,00,000 ÷ 1,000 = ₹3,000 per room per night.
ARR is shaped by multiple factors. Pricing strategy heavily influences booking decisions for mid-scale travelers. Room pricing directly impacts hotel bookings and occupancy. Consider how blended rates emerge:
- Rack rate: ₹4,200
- Corporate rates: ₹3,200
- OTA net rate after discount and commission fees: ≈ ₹2,800
Direct bookings increase profit by avoiding OTA commissions – typically 15–25%. Revenue managers must balance distribution channels, channel mix and direct booking channels against OTA dependency. Using a booking engine and channel manager helps implement dynamic pricing, where room rates adjust based on demand patterns, competitor rates and market conditions.
Luxury hotels often target lower occupancy with higher average daily rate, while budget and economy hotels typically target occupancy rates of 80% or more with lower room rates. For 3-star hotel financial projections, ARR assumptions must reflect realistic blended rates, not optimistic published tariffs.
FHRAI data suggests average room rate for 3-star hotels was approximately ₹3,674 nationally.
ARR vs ADR – Practical Clarification for Indian 3-Star Hotels
ARR and ADR (average daily rate) are often used interchangeably in the hospitality industry, both referring to average revenue per room sold. Some international chains prefer ADR; Indian DPRs typically use ARR.
For financial modelling, the important point is to define the metric once – for example, “Average Room Rate (ARR) = Room Revenue ÷ Rooms Sold” – and use it consistently across all calculations, charts and CMA data. For a 90-day quarter, ADR per day and ARR for the period coincide numerically when based on the same dataset. Auditors, CAs and lenders focus on correctness of the calculation and its linkage with RevPAR and occupancy, rather than debating terminology.
What Is RevPAR and How to Calculate It for a 3-Star Hotel?
RevPAR (revenue per available room) measures revenue generated per available hotel room, combining occupancy and pricing into one metric. RevPAR combines occupancy rates and average daily rates, making it valuable for comparing financial performance across properties of different sizes.
Two ways to calculate RevPAR:
- RevPAR = Total Room Revenue ÷ Total Available Room Nights
- RevPAR = ARR × Occupancy Rate
Example: ARR = ₹4,000, Occupancy = 60%
- RevPAR = ₹4,000 × 0.60 = ₹2,400
- Cross-check: Room Revenue = 50 × 365 × 0.60 × ₹4,000 = ₹4,38,00,000. RevPAR = ₹4,38,00,000 ÷ 18,250 = ₹2,400 ✓
A higher RevPAR indicates better room revenue performance. For this hotel, approximate monthly room revenue at this RevPAR figure = ₹2,400 × 50 × 30 = ₹36,00,000.
Banks and investors prefer RevPAR trends because the metric reflects both demand and pricing efficiency. FHRAI data showed 3-star hotel RevPAR averaging ₹2,302 nationally, while total revenue per available room including F&B was approximately ₹5,381.
Occupancy vs ARR vs RevPAR – Comparative View
These three metrics serve different purposes but must be evaluated together for meaningful 3-star hotel financial analysis.
| Metric | What It Measures | Formula | Why It Matters |
|---|---|---|---|
| Occupancy | Room utilization / demand | Rooms Sold ÷ Available Rooms × 100 | Shows how much of capacity is being used |
| ARR | Average realized room price | Total Room Revenue ÷ Rooms Sold | Reflects pricing power and channel mix |
| RevPAR | Revenue efficiency of total inventory | ARR × Occupancy Rate | Combined performance – the revenue generating index for room business |
Occupancy rate informs pricing strategy and market demand simultaneously. High occupancy with low ARR, or high ARR with very low occupancy, can both produce weak RevPAR and inadequate cash flows. Revenue-management strategies monitor multiple factors to adjust prices and fill rooms effectively. In DPRs and project feasibility documents, projected occupancy, ARR and RevPAR must logically reconcile with hotel room revenue projections.

3-Star Hotel Occupancy Assumptions for Financial Projections
For a new 3-star hotel, occupancy assumptions are among the most scrutinized inputs in financial projections, directly influencing revenue, break even point and DSCR.
Key factors that should guide assumptions:
- City category and micro-location
- Existing and upcoming hotel supply – diverse customer segments can stabilize hotel occupancy over time
- Corporate and industrial base – corporate partnerships can increase mid-week occupancy
- Tourism infrastructure, local attractions and wedding/event culture
- Airport/railway connectivity, hospitals, educational institutions
- Online visibility, loyalty programs and reputation management – basic service expectations influence repeat business and reviews
Occupancy ramp-up is essential. A hypothetical pattern might look like:
| Year | Occupancy (Illustrative) |
|---|---|
| Year 1 | 35% |
| Year 2 | 45% |
| Year 3 | 55% |
| Year 4 | 60% |
| Year 5 | 62% |
3-star hotels typically achieve an occupancy rate range of 65% to 75% at stabilization. A healthy hotel occupancy rate is typically 70–80%. However, upscale hotels average 68–75%, while luxury properties often operate at lower occupancy rates of 55% to 70% with higher pricing. These are reference bands – not guarantees.
Unsupported assumptions like 75% from Year 1 in a Tier-III city weaken DPR credibility. Tier-II and Tier-III cities in India have shown demand growth with occupancy reaching 72–74% for premium hotels, but not immediately for new entrants.
How Occupancy and ARR Jointly Determine Room Revenue
The fundamental formula:
Room Revenue = Number of Rooms × Operating Days × Occupancy Rate × ARR
50-Room 3-Star Hotel Example:
- Available room nights: 50 × 365 = 18,250
- Occupancy: 60% → Occupied room nights: 10,950
- ARR: ₹3,500
- Annual room revenue: 10,950 × ₹3,500 = ₹3,83,25,000 (≈ ₹3.83 crore)
Cross-check via RevPAR: ₹3,500 × 0.60 = ₹2,100. Then ₹2,100 × 18,250 = ₹3,83,25,000 ✓
In a complete hotel financial model, this room revenue becomes the starting point for total revenue after adding F&B, banquet and other income using ratios or separate per-cover assumptions.
Scenario & Sensitivity Analysis for Occupancy and ARR
The following table shows how annual room revenue and RevPAR change across different occupancy and ARR combinations for a 50-room hotel (18,250 available room nights):
| Occupancy | ARR ₹3,000 | ARR ₹3,500 | ARR ₹4,000 |
|---|---|---|---|
| 40% | RevPAR ₹1,200 / Revenue ₹2.19 Cr | RevPAR ₹1,400 / Revenue ₹2.56 Cr | RevPAR ₹1,600 / Revenue ₹2.92 Cr |
| 50% | RevPAR ₹1,500 / Revenue ₹2.74 Cr | RevPAR ₹1,750 / Revenue ₹3.19 Cr | RevPAR ₹2,000 / Revenue ₹3.65 Cr |
| 60% | RevPAR ₹1,800 / Revenue ₹3.29 Cr | RevPAR ₹2,100 / Revenue ₹3.83 Cr | RevPAR ₹2,400 / Revenue ₹4.38 Cr |
| 70% | RevPAR ₹2,100 / Revenue ₹3.83 Cr | RevPAR ₹2,450 / Revenue ₹4.47 Cr | RevPAR ₹2,800 / Revenue ₹5.11 Cr |
| 80% | RevPAR ₹2,400 / Revenue ₹4.38 Cr | RevPAR ₹2,800 / Revenue ₹5.11 Cr | RevPAR ₹3,200 / Revenue ₹5.84 Cr |
In a second scenario where ARR drops by ₹500 while occupancy falls by 10 percentage points simultaneously, revenue can decline by 25–30%. This kind of sensitivity analysis helps lenders assess whether the project can still meet interest and principal obligations under moderately adverse economic conditions.
Dynamic pricing can improve hotel occupancy rates during low demand periods, while minimum stay policies can maximize occupancy during peak periods and peak times.
What Is Break-Even Analysis for a 3-Star Hotel?
Break-even is the occupancy and revenue level at which a hotel’s contribution covers all fixed operating costs – resulting in neither profit nor loss before finance costs and taxes.
Important distinctions:
- Operating break-even (EBITDA = 0): Contribution covers fixed costs
- Cash break-even: Cash inflows cover cash operating outflows (excluding depreciation)
- Debt-service break-even: Cash accrual covers interest plus scheduled principal
Hotel break even analysis requires separating fixed costs (salaries, property taxes, insurance, minimum utilities, maintenance) from variable costs per occupied room (linen, guest amenities, room cleaning, OTA commissions, distribution costs, utilities per room).
Hotel Break-Even Occupancy – Concept and Example
Break even occupancy rate hotel represents the occupancy at which contribution per room night × occupied room nights equals total fixed costs.
Simplified formula:
Break-Even Occupancy (%) = Fixed Costs ÷ (Available Room Nights × (ARR − Variable Cost per Occupied Room)) × 100
Worked example (50-room hotel):
- Annual fixed costs: ₹2.50 crore
- ARR: ₹3,500
- Variable cost per occupied room: ₹900
- Contribution per room sold: ₹3,500 − ₹900 = ₹2,600
- Available room nights: 18,250
- Required contribution: ₹2,50,00,000 ÷ ₹2,600 = 9,615 occupied room nights
- Break-even occupancy: 9,615 ÷ 18,250 × 100 = 52.7%
Even after reaching this operating break-even, the hotel may not generate enough cash for interest and principal payments. Separate DSCR analysis remains essential.
Break-Even Occupancy vs Loan Repayment Capacity (DSCR)
Operating break-even is not the same as financial viability from a banker’s perspective. Lenders evaluate DSCR – debt service coverage ratio.
Numeric outline: At 60% occupancy, assume EBITDA is ₹3.20 crore. If annual interest plus principal equals ₹2.40 crore, then DSCR = ₹3.20 ÷ ₹2.40 = 1.33. A modest 10-percentage-point drop in occupancy could shrink EBITDA to ₹2.20 crore, pushing DSCR below 1.0.
Lenders typically require average DSCR above 1.3–1.5 during the loan tenure. Project promoters and Chartered Accountants should always identify the occupancy at which DSCR drops to 1.0 – not just the operating break-even point.
Impact of Occupancy on 3-Star Hotel Profitability
Because many hotel costs are fixed or semi-fixed, increases in occupancy have a leveraged effect on profitability. Moving from 50% to 60% occupancy adds contribution from approximately 1,825 additional room nights while most fixed costs remain unchanged, making the hotel earn more money disproportionately at the margin.
Typical fixed or semi-fixed costs in Indian 3-star hotels include front office and management salaries, building rent or interest, property tax, insurance, annual maintenance contracts, minimum electricity, DG costs and marketing retainers.
Variable or semi-variable items include laundry, linen replacement, toiletries, breakfast supplies, housekeeping labour, OTA commissions and transaction fees. High occupancy rates can reduce overall profitability if room rates drop too aggressively to fill rooms – so balance is essential.
Impact of ARR and Pricing Strategy on Profitability
An increase in ARR without significant occupancy loss directly improves contribution per occupied room and accelerates recovery of fixed costs. Revenue management strategy should align higher pricing with demand patterns.
Comparison at 60% occupancy (50 rooms):
| Metric | ARR ₹3,200 | ARR ₹3,600 |
|---|---|---|
| Annual Room Revenue | ₹3.50 Cr | ₹3.94 Cr |
| Revenue Difference | – | +₹43.8 Lakh |
Much of this ₹43.8 lakh increase flows directly to EBITDA after deducting small incremental variable costs. However, aggressive pricing can push occupancy down in competitive markets. Promoters should encourage guests to book through direct booking channels and implement dynamic pricing to balance occupancy and rate.
Competition among hotels affects both occupancy and pricing power. Distribution channels affect the reach and occupancy of hotels, and the right channel mix between OTAs, corporate contracts and walk-ins influences net ARR significantly.
Why RevPAR Is Often More Insightful Than Occupancy Alone
Comparative example:
- Hotel A: 80% occupancy, ARR ₹2,800 → Hotel’s RevPAR = ₹2,240
- Hotel B: 60% occupancy, ARR ₹4,000 → Hotel’s RevPAR = ₹2,400
Hotel B generates higher revenue per available room despite selling fewer rooms. Judging performance only by occupancy would be misleading – a high-discount, high-volume strategy may yield weaker average revenue per available room than a balanced pricing approach. This is why increasing RevPAR is often a better objective than simply chasing higher occupancy.
The RevPAR index and RevPAR formula remain central to hotel operating performance metrics, commonly reviewed by brand managers, investors and banks. However, for full profitability analysis, RevPAR should be considered alongside operating expenses, gross operating profit margins and overall EBITDA.

Revenue Beyond Rooms: Total 3-Star Hotel Revenue Model
RevPAR measures only room performance. A complete feasibility must incorporate additional revenue streams: restaurant and F&B revenue, banquets, conferences, weddings, room service, laundry, spa services and other services.
Illustrative revenue split for a 3-star hotel in India:
| Revenue Source | Share of Total Revenue |
|---|---|
| Room Revenue | 55–65% |
| F&B and Banquets | 30–40% |
| Other Income (laundry, spa, etc.) | 5–10% |
Hotels with moderate occupancy can still be viable if banquet and event revenues are strong – an important consideration for hotel type and positioning. Lenders examine total revenue, not just room income. For a deeper understanding of non-room revenue sources and their margins, refer to 3-Star Hotel Revenue Model – Rooms, F&B, Banquet & Other Income.
Occupancy, ARR & Revenue Assumptions in a Bankable DPR
In practice, a Chartered Accountant or project consultant builds the financial model starting from room inventory, available room nights and ramp-up occupancy, then deriving annual room revenue for each projection year. F&B and banquet revenue lines are estimated using per-cover or per-square-foot assumptions linked to occupancy and local demand.
The P&L flow follows: Room Revenue → Total Operating Revenue → Variable and Fixed Expenses → EBITDA → Interest and Depreciation → Profit Before Tax → Cash Accrual → DSCR.
All assumptions must be internally consistent. A very high projected ARR must be supported by investment level, brand standards and location. Demand for how much revenue F&B generates should be realistic relative to rooms and banquet capacity. Market trends and economic conditions should inform growth rates.
Relationship with 3-Star Hotel Setup Cost and Investment Level
Occupancy and ARR targets cannot be determined without considering the total investment per room. A very high setup cost per room in a moderate-ARR market will pressure viability and debt servicing. Hotels with land-owner tie-ups or existing buildings have different cost structures and therefore different acceptable occupancy-ARR combinations.
Promoters should study 3-Star Hotel Setup Cost in India – 30, 50 & 75 Room Hotels to understand per-room investment benchmarks. Bank appraisals compare projected profitability with total project cost to assess return and repayment risk.
Impact of FF&E and Equipment Investment on ARR Positioning
The quality of furniture, fixtures and equipment – beds, linen, air-conditioning, bathroom fittings – directly influences achievable ARR. Under-investing in FF&E may cap room rates, while over-investing in luxury properties beyond what market demand supports can hurt returns. Even boutique hotels must align FF&E quality with the desired ARR band. More rooms at higher standards mean higher revenue potential but also higher CAPEX.
Refer to 3-Star Hotel Equipment, Furniture & FF&E List with Cost for detailed planning.
Project Cost, Means of Finance and Their Effect on Break-Even
Total project cost and financing structure directly affect required cash flows. Higher term-loan amounts and shorter tenures increase annual debt service, requiring higher occupancy, higher ARR or stronger F&B revenue to maintain a healthy DSCR.
A well-balanced mix of promoter contribution and bank finance, as discussed in 3-Star Hotel Project Cost & Means of Finance, reduces pressure on early-year occupancy. In hotel project reports for bank loans, it is standard to show projected DSCR with stress-testing for lower-than-expected performance.
Sensitivity Analysis for a 3-Star Hotel – Occupancy, ARR and Costs
| Scenario | Occupancy | ARR | Room Revenue | EBITDA (Est.) | DSCR (Est.) |
|---|---|---|---|---|---|
| Base Case | 60% | ₹3,500 | ₹3.83 Cr | ₹3.20 Cr | 1.33 |
| Mild Downside | 55% | ₹3,200 | ₹3.21 Cr | ₹2.40 Cr | 1.00 |
| Severe Downside | 50% | ₹3,000 | ₹2.74 Cr | ₹1.80 Cr | 0.75 |
| Upside | 65% | ₹3,800 | ₹4.51 Cr | ₹3.85 Cr | 1.60 |
If a modest fall in occupancy or ARR makes DSCR fall below 1.0 for multiple years, the project carries elevated risk. Promoters should review downside scenarios before finalizing investment decisions. Occupancy is influenced by various interacting factors including location, demand, competition and market conditions.
Common Mistakes in Occupancy, ARR, RevPAR & Break-Even Projections
- Assuming unrealistically high occupancy from Year 1 without ramp-up
- Copying metro occupancy rates to small towns without local validation
- Using published rack rates instead of realistic blended ARR
- Ignoring OTA discounts, commission fees and distribution costs in the RevPAR calculation
- Projecting flat annual occupancy without monthly variation for low demand periods
- Confusing occupancy with profitability – a hotel can fill rooms and still lose money if rates are too low
- Underestimating operating expenses and working capital requirements
- Treating operating break-even as equivalent to having sufficient cash for loan repayment
- Using optimistic assumptions merely to make a hotel project report for bank loan look attractive
Conservative, well-supported assumptions create more credible CMA data and are generally appreciated by bank credit officers.
Practical Example – Integrated 50-Room 3-Star Hotel Financial Snapshot
All numbers below are illustrative only.
| Parameter | Value |
|---|---|
| Hotel Rooms | 50 |
| Operating Days | 365 |
| Available Room Nights | 18,250 |
| Assumed Occupancy | 60% |
| Occupied Room Nights | 10,950 |
| ARR | ₹3,500 |
| RevPAR | ₹2,100 |
| Annual Room Revenue | ₹3.83 Crore |
| F&B/Banquet & Other Income (~45% of rooms) | ₹1.72 Crore |
| Total Revenue | ₹5.55 Crore |
| Variable Costs (~30% of total revenue) | ₹1.67 Crore |
| Fixed Operating Costs | ₹2.50 Crore |
| EBITDA | ₹1.38 Crore |
| Break-Even Occupancy (Operating) | ~52.7% |
This EBITDA would support debt service depending on loan quantum and tenure. At ₹2.40 crore annual debt service, DSCR would be approximately 0.58 at this EBITDA level from room revenue alone – highlighting why total revenue including F&B is critical.
Performance at 40%, 50%, 60%, 70% and 80% Occupancy
Holding ARR constant at ₹3,500 for the 50-room hotel:
| Occupancy | Room Nights Sold | Room Revenue (₹ Cr) | RevPAR (₹) | Contribution (₹ Cr)* | Operating Surplus (₹ Cr)** |
|---|---|---|---|---|---|
| 40% | 7,300 | 2.56 | 1,400 | 1.90 | (0.60) |
| 50% | 9,125 | 3.19 | 1,750 | 2.37 | (0.13) |
| 60% | 10,950 | 3.83 | 2,100 | 2.85 | 0.35 |
| 70% | 12,775 | 4.47 | 2,450 | 3.32 | 0.82 |
| 80% | 14,600 | 5.11 | 2,800 | 3.80 | 1.30 |
Contribution = Room Revenue minus variable costs at ₹900 per occupied room *Operating Surplus = Contribution minus ₹2.50 Cr fixed costs
Operating break-even falls near 53% occupancy, consistent with the earlier calculation. Note that real hotels may not maintain exactly the same ARR at 40% and 80% – pricing often varies with demand – but this simplified table directionally shows how occupancy drives financial outcomes.
When Does a 3-Star Hotel Become Financially Viable?
There is no universal occupancy percentage at which every 3-star hotel becomes viable. Two hotels with identical occupancy and ARR can show very different profitability if one has significantly higher land and building costs or more expensive debt.
Viability depends on project cost, means of finance, ARR, occupancy, F&B and banquet performance, operating efficiency, interest rates and loan tenure. Promoters should evaluate viability through EBITDA margins, cash accrual, DSCR profile and return on capital employed – not single metrics. A structured hotel financial model testing multiple combinations of occupancy and ARR against the specific project’s cost and loan structure is far more reliable than generic rules of thumb.
Professional Perspective – CA Manish Gugliya on Hotel Metrics
In my experience preparing DPRs and financial projections for hotel projects, I have observed that lenders spend considerable time examining occupancy and ARR assumptions before accepting RevPAR and DSCR projections. These are not mere Excel inputs – they are strategic financial assumptions requiring justification through market data, competitor analysis and demand assessment.
The chain is unforgiving: Occupancy → Rooms Sold → Room Revenue → Gross Operating Profit / EBITDA → Cash Accrual → DSCR → Loan Repayment Capacity. Any unrealistic assumption at the top cascades through the entire model. Promoters should treat these metrics as management tools to design a resilient project – not just numbers to make a proposal look attractive on paper.
FAQs – Occupancy, ARR, RevPAR and Break-Even in 3-Star Hotels
Is there a standard “good” occupancy rate for a 3-star hotel in India?
There is no single standard. While many stabilized 3-star hotels may target 55–70% annual occupancy, the typical occupancy rate for a healthy 3-star hotel is between 65% and 78%. What truly matters is whether projected occupancy and ARR together produce sufficient RevPAR, EBITDA and DSCR relative to the project’s cost and debt level.
Can a hotel be profitable at low occupancy if ARR is high?
Yes. A hotel with relatively low occupancy can still be profitable if ARR and contribution per room are high enough to cover fixed costs. This is particularly true for niche boutique hotels and strong banquet-driven properties. However, extremely high ARR with very low occupancy is risky if demand is overestimated. The balance must be validated with market studies and competitor analysis.
Does hotel break-even analysis include loan repayment?
Basic operating break-even covers only operating fixed costs, not interest and principal. True financial sustainability requires checking whether cash accrual after operating costs is sufficient for full debt service. Serious hotel feasibility studies should include both operating break-even and debt-service break-even or DSCR analysis.
How frequently should a 3-star hotel monitor occupancy, ARR and RevPAR?
Daily monitoring is recommended for internal management, with weekly and monthly summaries enabling timely adjustments to pricing, promotions and channel mix. Banks and investors usually review monthly or quarterly performance, but revenue managers should track these KPIs more frequently to respond to how demand fluctuates across peak periods and off-seasons.
How can a promoter get professional help with a 3-star hotel financial model?
Promoters should consult a Chartered Accountant or project finance consultant experienced in hotel DPRs, CMA data and term-loan proposals, who can build a detailed financial model incorporating occupancy, ARR, RevPAR, break-even and DSCR. ProjectReportBank.com specializes in such hotel project reports and financial analysis, supporting more informed investment decisions and stronger presentations to banks and investors.
Explore More 3-Star Hotel Project Report Guides
Continue exploring our 3-Star Hotel DPR guides covering setup cost, equipment, project cost, revenue, financial projections, occupancy, feasibility, project finance and bank loan assessment.