
Key Takeaways
- Realistic 3 star hotel financial projections for DPR are the single most critical component for securing a bank term loan or project finance in India. Without coherent projections, no lender will evaluate your hotel project seriously.
- Every projection must logically flow from room inventory, occupancy, ARR/ADR and RevPAR through to revenue, operating expenses, EBITDA, cash flow, DSCR and loan repayment capacity – not from isolated guesses.
- A bankable 3 star hotel financial model should include a projected profit & loss account, projected balance sheet, cash flow statement, term-loan repayment schedule and sensitivity analysis, all reconciling with each other.
- Assumptions on occupancy ramp-up, tariffs, operating costs, project cost and debt–equity structure must be commercially justified for the specific location, room inventory and market positioning of the proposed hotel.
- As a practising Chartered Accountant, I use integrated financial models to prepare detailed project reports, CMA data and project finance proposals for hotel projects across India.
Introduction: Why Financial Projections Drive a 3-Star Hotel DPR
When a promoter approaches a bank with a 3-star hotel project report, the lender spends relatively little time on architectural drawings or interior concepts. What gets scrutinised is the financial model – the projected revenue, expenses, cash flow and debt-servicing capacity. Financial statements are essential for securing hotel business loans, and a well-constructed projection is what separates a bankable DPR from a rejected one.
The logical chain that drives every hotel financial projection looks like this: Room Inventory → Occupancy → ARR/ADR → RevPAR → Revenue → Operating Costs → EBITDA → Depreciation & Interest → Profit → Cash Accrual → Debt Repayment → DSCR. Each link must hold. If your occupancy assumption is unrealistic, every downstream number – from total revenue to DSCR – collapses.
Creating financial projections for a 3-star hotel involves forecasting revenues and expenses over a meaningful horizon – typically 7 to 10 operating years – to capture the ramp-up phase, stabilization and long-term financial performance. In 2023, the global hotel industry was valued at approximately $1.21 trillion, and India’s hospitality sector is growing rapidly, particularly in Tier-II and Tier-III cities. Yet total project cost or proposed room tariff alone cannot prove financial viability. A complete 3 star hotel project report financial projections section is mandatory for bank appraisal.
Explore 3-Star Hotel Project Report Guides
Explore our complete 3-Star Hotel Project Report and DPR guides covering setup cost, equipment, project cost, revenue, financial projections, occupancy, feasibility, project finance and bank loan assessment.
What Are Financial Projections in a 3-Star Hotel DPR?
Financial projections in a detailed project report are forward-looking estimates of revenue, expenses, profit, assets, liabilities and cash flow, all derived from explicit hotel-specific assumptions. Hotel financial statements provide insights into business profitability, and for a 3-star hotel DPR, these projections serve three purposes: establishing project feasibility, supporting valuation, and demonstrating loan repayment capacity through DSCR analysis.
It is important to distinguish between an assumption and a derived result. An assumption is an input you define – for example, 55% occupancy in Year 3 or ₹4,000 ARR. A derived result is the output the model calculates – for example, ₹4.0 crore room revenue or ₹1.2 crore EBITDA. Banks examine both: whether your assumptions are reasonable and whether the derived financial data supports the loan proposal.
Forecasting for a hotel includes cash flows over a 3- to 5-year horizon at minimum, but most Indian banks require projected financial statements – projected profit & loss account, projected balance sheet and projected cash flow statement – for at least 7 years including the moratorium period. Projections must reflect the stabilization phase (often from Year 3–4 onwards), not just the optimistic first year of hotel operations.
Key Assumptions Required Before Building the Financial Model
A robust 3 star hotel financial model starts with a clearly documented assumption sheet. Every number in the DPR traces back to this sheet. Assumptions should be interconnected – F&B revenue driven by occupied rooms, staff cost driven by room inventory – rather than guessed independently.
Operating Assumptions:
- Number of rooms (e.g., 50 keys)
- Operational days per year (typically 365)
- Occupancy ramp-up: Year 1 at 45%, Year 2 at 55%, Year 3 at 60%, stabilizing at 62–65%
- ARR/ADR by season, starting around ₹3,800–₹4,200, with 5–7% annual escalation
- Expected RevPAR range and demand mix (leisure vs. business segments)
Revenue Assumptions:
- Room revenue calculated from occupancy × ARR
- F&B revenue as 40–55% of room revenue or per occupied room
- Banquet/event revenue based on expected functions per month
- Other operating income: laundry, travel desk, parking (3–5% of room revenue)
Operating Cost Assumptions:
- Employee cost: 22–25% of total revenue (labor costs typically represent 25% to 32% of total revenue in hotels globally; Indian 3-star properties with leaner staffing may operate at the lower end)
- Power & fuel: 7–9% of total revenue
- Food cost: 35–40% of F&B revenue
- OTA commissions: 4–6% of room revenue
- Repairs & maintenance, sales & marketing, admin overheads
Project Finance Assumptions:
Starting a hotel requires an initial investment of hundreds of thousands to millions, and the financing structure must be clearly laid out. Down payments for hotel loans typically range from 20% to 40% of property value. Key inputs include total project cost, debt–equity ratio, term loan amount, promoter’s contribution, interest rate, moratorium period and repayment tenure. For a detailed breakdown, refer to the article on 3-Star Hotel project cost and means of finance.
Accounting Assumptions:
- Depreciation rates on building, interiors and FF&E as per applicable schedules
- Income tax rate as per current corporate tax law
- Working capital margin, credit period for receivables and payables
Illustrative 3-Star Hotel Financial Model: 50-Room Example
This section presents an internally consistent but purely illustrative 3 star hotel financial model for a 50-room property in a Tier-II Indian city. All numbers are approximate and for learning purposes only. Actual projections depend on location, property size, land arrangement, room mix, amenities and financing structure.
Property Profile: 50 keys, one multi-cuisine restaurant, small bar (where legally permissible), one banquet hall seating approximately 200–250 guests, limited spa/gym, targeting mid-market corporate and domestic leisure guests.
Core Assumptions:
- Rooms: 50; Available room nights: 18,250
- Year 1 occupancy: 45%; Year 2: 55%; Year 3: 60%; Year 4: 62%; Year 5: 65%
- Starting ARR: ₹3,800 with 5–6% annual escalation
- F&B revenue: ~50% of room revenue in early years
- Banquet income: 8–10 events/month at average billing of ₹40,000–₹60,000
- Other income: ~4% of room revenue
Initial hotel investments can range from hundreds of thousands to millions of dollars depending on city and specifications. For per-room investment benchmarks including building and FF&E, refer to the 3-Star Hotel setup cost in India and hotel equipment investment articles. The operating expense structure targets 65–70% of total revenue initially, with the proportion decreasing as occupancy stabilizes.
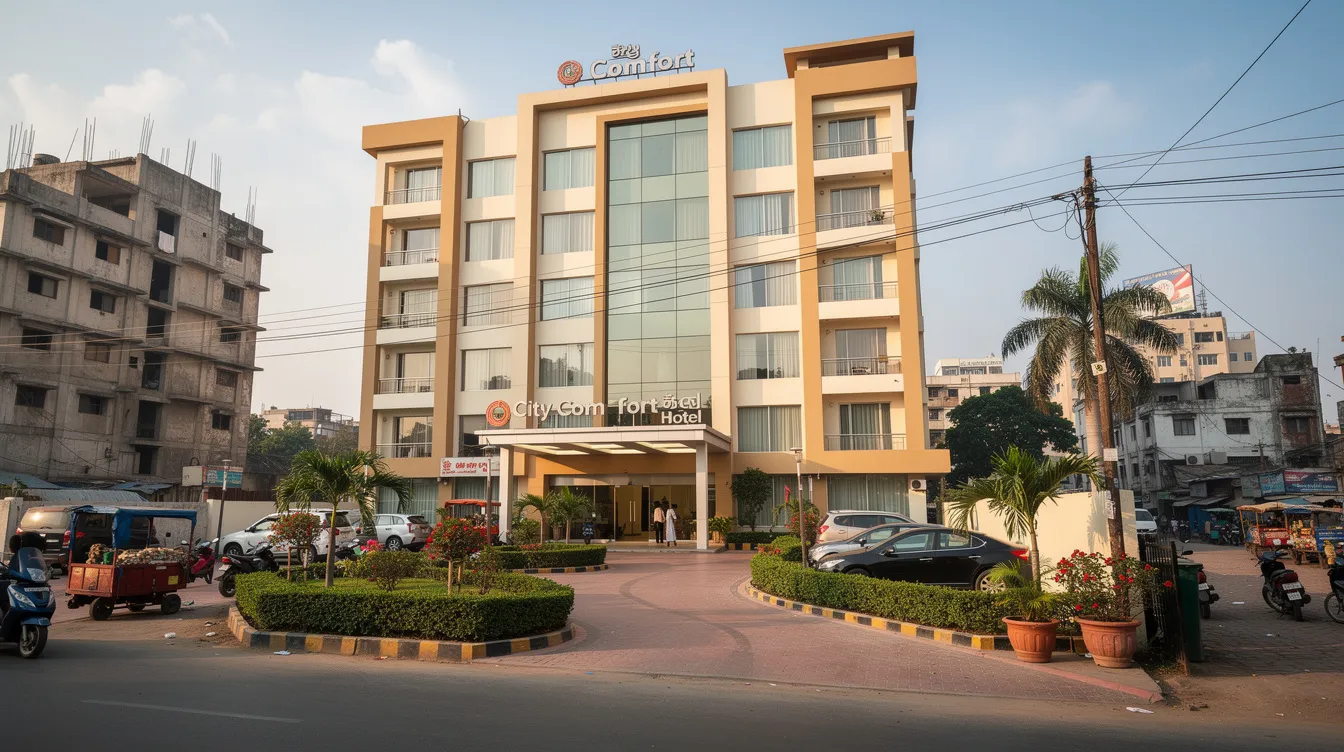
Room Revenue Projection: Occupancy, ARR and Available Room Nights
Room revenue is the backbone of any 3 star hotel project report and drives the majority of financial projections for DPR. The occupancy rate is the percentage of available rooms occupied over a specific period, and it directly determines revenue generated.
Key Formulas:
- Available Room Nights = Number of Rooms × 365
- Occupied Room Nights = Available Room Nights × Occupancy %
- Room Revenue = Occupied Room Nights × ARR/ADR
Illustrative Room Revenue Table (50 Rooms):
| Year | Occupancy | ARR (₹) | Occupied Room Nights | Room Revenue (₹ Crore) |
|---|---|---|---|---|
| 1 | 45% | 3,800 | 8,213 | 3.12 |
| 2 | 55% | 4,000 | 10,038 | 4.02 |
| 3 | 60% | 4,200 | 10,950 | 4.60 |
| 4 | 62% | 4,450 | 11,315 | 5.04 |
| 5 | 65% | 4,700 | 11,863 | 5.58 |
Even a 5% change in occupancy or a ₹200 change in ARR can shift annual total room revenue by ₹40–60 lakh – enough to alter DSCR from comfortable to tight. Banks analyse room revenue projections carefully, comparing occupancy and ARR assumptions with market data and benchmarks for the micro-location. According to the FHRAI 2019-20 survey, 3-star hotels in India showed occupancy of ~62.6% and ADR of ~₹3,674 – useful lower-to-mid benchmarks for validation.
ARR, ADR and RevPAR in a 3-Star Hotel Financial Model
ARR (Average Room Rate) and ADR (Average Daily Rate) represent the average realized tariff per occupied room per night. In Indian hotel finance practice, the terms are generally used interchangeably. A typical 3-star hotel projects an ADR scaled to local mid-tier markets, reflecting positioning between budget and upscale segments.
RevPAR measures revenue per available room and is calculated as ADR multiplied by occupancy rate. Alternatively: RevPAR = Room Revenue ÷ Available Room Nights. RevPAR is crucial for investment analysis rather than occupancy alone because it captures both pricing power and utilization simultaneously.
Using the Year 3 example: ARR of ₹4,200 × 60% occupancy = RevPAR of ₹2,520. Compare this with the industry benchmark: RevPAR for 3-star hotels moved from ~₹2,619 in FY23 to ~₹2,912 in FY24. Banks and hotel investors prefer realistic ARR and RevPAR growth curves; steep jumps without market justification are treated as aggressive and weaken the DPR’s credibility. For deeper occupancy and RevPAR benchmarking, refer to the dedicated 3-Star Hotel occupancy, ARR and RevPAR analysis.
F&B, Banquet and Other Hotel Revenue Projections
For a 3-star hotel, room revenue is primary, but F&B, banquet and ancillary revenue significantly impact EBITDA and DSCR. A complete breakdown of hotel revenue streams is available in the 3-Star Hotel revenue model article.
F&B Revenue: Can be estimated as (a) 40–55% of room revenue, (b) average revenue per cover multiplied by expected covers, or (c) package-based estimates for breakfast and meal plans linked to occupancy. Sources include the in-house restaurant, room service, bar and walk-in customers.
Banquet and Event Revenue: Projections should be based on banquet hall capacity, expected number of social and corporate events per month, average billing per event and seasonality. Market demand fluctuates seasonally, impacting both occupancy and ADR – and banquet demand follows similar patterns. Some 3-star hotels have modest banquet income while others in wedding or MICE markets earn substantially.
Other Operating Income: Typical heads include laundry, minibar, parking, airport transfers, travel desk commission and business centre usage. This ancillary revenue should not be overstated – typically 3–5% of room revenue.
Illustrative Year 3 Revenue Mix: Rooms 55%, F&B 30%, Banquet 10%, Other 5%.
Total Revenue Projection and Operating Expense Structure
Total operating revenue in the 3 star hotel financial model is the sum of room revenue, F&B, banquet and other income.
Illustrative Total Revenue (₹ Crore):
| Year | Room Revenue | F&B | Banquet | Other | Total Revenue |
|---|---|---|---|---|---|
| 1 | 3.12 | 1.56 | 0.38 | 0.13 | 5.19 |
| 2 | 4.02 | 2.01 | 0.50 | 0.16 | 6.69 |
| 3 | 4.60 | 2.30 | 0.58 | 0.18 | 7.66 |
| 4 | 5.04 | 2.52 | 0.63 | 0.20 | 8.39 |
| 5 | 5.58 | 2.79 | 0.70 | 0.22 | 9.29 |
Major operating expense categories include salaries and wages, food and beverage consumption cost, power and fuel, housekeeping and laundry, repairs and maintenance, sales and marketing, OTA commissions, administrative expenses, insurance, property taxes and licence fees. The Uniform System of Accounts for the Lodging Industry standardizes hotel financial reporting and provides a useful framework for categorizing departmental expenses tied to generating hotel revenue.
Expenses can be classified as:
- Fixed costs: minimum staffing, security, insurance, some admin costs
- Variable costs: food cost, linen usage, guest supplies per occupied room
- Semi-variable: power and fuel, marketing spend
Benchmark ranges vary by city and design, but broad indicators include staff cost at 22–28% of revenue, food cost at 35–40% of F&B revenue, and power at 7–9% of total revenue. High operational costs in the early years – when occupancy is low but fixed costs remain constant – squeeze margins significantly.

EBITDA, Depreciation and Interest: Linking Operations to Profit
EBITDA reflects earnings before interest, taxes, depreciation and amortization. In hotel finance, it is calculated as: EBITDA = Operating Revenue – Operating Expenses. EBITDA margin shows core profitability of hotel operations and is the first metric lenders examine to assess operational efficiency.
GOPPAR indicates gross operating profit per available room and provides a per-room efficiency measure. GOP margin for a well-run 3-star hotel typically ranges between 30% to 40%, while GOP margin for limited service hotels ranges from 40% to 55%. The average hotel profit margin was around 18% as of June 2020 – a figure depressed by pandemic conditions, but useful as a conservative reference.
In the illustrative model, EBITDA margin should improve as occupancy ramps up: approximately 22–25% in Year 1, rising to 28–32% by Year 4–5 as fixed expenses are distributed over a larger revenue base.
Depreciation covers major asset blocks: building, interiors, hotel furniture, fixtures and equipment, HVAC, lifts and kitchen equipment. Detailed asset-wise costing can be referenced from the 3-Star Hotel equipment and FF&E cost article. Depreciation reduces accounting profit but does not reduce cash flow – which is why cash accrual (PAT + depreciation) is used to test loan repayment capacity.
Interest on term loan is calculated on the opening outstanding loan each year, reducing as principal is repaid. It should be modelled according to the agreed repayment schedule rather than kept flat across years. Accurate incorporation of both depreciation and interest is essential for realistic net income, gross operating profit and DSCR calculations.
Projected Profit & Loss, Cash Flow and Balance Sheet
The three core projected financial statements – projected P&L, projected cash flow statement and projected balance sheet – must be internally consistent with the underlying hotel financial model.
Projected P&L Structure:
A hotel income statement measures financial performance over specific periods. The structure follows:
| Line Item | Year 1 (₹ Cr) | Year 3 (₹ Cr) | Year 5 (₹ Cr) |
|---|---|---|---|
| Total Revenue | 5.19 | 7.66 | 9.29 |
| Operating Expenses | 3.63 | 5.13 | 6.03 |
| EBITDA | 1.56 | 2.53 | 3.26 |
| Depreciation | 0.65 | 0.65 | 0.65 |
| Interest | 0.86 | 0.70 | 0.48 |
| PBT | 0.05 | 1.18 | 2.13 |
| Tax (~25%) | 0.01 | 0.30 | 0.53 |
| PAT | 0.04 | 0.88 | 1.60 |
Projected Cash Flow: A hotel’s cash flow statement shows cash inflows and outflows over time. It reconciles accounting profit with actual cash generation by adjusting for non-cash expenses incurred (primarily depreciation), changes in working capital, capital expenditure and loan principal repayments. Negative cash flow in early years is possible if principal repayments begin before occupancy stabilizes – a critical risk to model carefully.
Projected Balance Sheet: A balance sheet summarizes a hotel’s assets and liabilities at a point in time. Major asset heads include gross fixed assets, accumulated depreciation, inventories, receivables and cash. Liabilities include promoter capital, term loan outstanding, working capital borrowing, creditors, other current liabilities and retained earnings. The hotel balance sheet must always balance – assets must equal liabilities plus equity.
Banks examine these three hotel financial statements together to understand the hotel’s financial performance, solvency, liquidity and long-term financial standing.
Term Loan Schedule, DSCR and Break-Even Analysis
Term Loan Schedule (Illustrative – ₹7.2 Crore Loan, 12% Interest, 8-Year Repayment after 1-Year Moratorium):
| Year | Opening Balance (₹ Cr) | Principal Repaid | Interest | Closing Balance |
|---|---|---|---|---|
| 1 (Moratorium) | 7.20 | 0.00 | 0.86 | 7.20 |
| 2 | 7.20 | 0.90 | 0.86 | 6.30 |
| 3 | 6.30 | 0.90 | 0.76 | 5.40 |
| 4 | 5.40 | 0.90 | 0.65 | 4.50 |
| 5 | 4.50 | 0.90 | 0.54 | 3.60 |
DSCR Formula: DSCR = (PAT + Depreciation + Interest on Term Loan) ÷ (Interest on Term Loan + Principal Repayment). A higher debt-service coverage ratio indicates better ability to meet debt obligations. Financial institutions typically expect annual DSCR ≥ 1.0 in every operating year and average DSCR over the loan tenure ≥ 1.2, as reinforced by RBI lending norms.
Using Year 3 data: DSCR = (0.88 + 0.65 + 0.76) ÷ (0.76 + 0.90) = 2.29 ÷ 1.66 ≈ 1.38 – a comfortable level.
Break-Even Analysis: A hotel’s break-even point indicates the sales needed to cover costs. Break-even occupancy is calculated by determining the occupancy level at which total revenue covers all fixed costs, variable costs and debt service. In the illustrative model, with fixed costs of approximately ₹2.8 crore and contribution margin per occupied room of approximately ₹2,800, break-even occupancy works out to roughly 55%. If break-even occupancy exceeds 60% for a 3-star hotel, lenders view the project as high-risk. For detailed break-even working, refer to the hotel break-even occupancy analysis.
Sensitivity Analysis and Scenario Planning
Financial planning includes budgeting, forecasting and risk assessment. A 3 star hotel financial projections for DPR should never rely on a single optimistic case – banks increasingly expect downside and stress scenarios.
Key Sensitivity Dimensions:
| Scenario | Impact on Year 3 EBITDA | Impact on DSCR |
|---|---|---|
| Occupancy 5% lower | ~₹35–40 lakh reduction | Drops by ~0.15 |
| Occupancy 10% lower | ~₹70–80 lakh reduction | Drops by ~0.30 |
| ARR 5% lower | ~₹25–30 lakh reduction | Drops by ~0.10 |
| OpEx 10% higher | ~₹50 lakh reduction | Drops by ~0.20 |
| Interest rate +2% | ~₹12–15 lakh more interest | Drops by ~0.08 |
| 6-month delay in stabilization | Year 2 revenue affected | Year 2 DSCR squeezed |
Well-documented sensitivity analysis adds credibility to the DPR and helps promoters understand the real risk–reward profile. Private investors and lenders prefer DPRs where promoters have examined moderate-downside cases rather than presenting only optimistic projections. Well-managed hotels can yield annual returns of 10–15%, but only when the underlying investment strategy accounts for realistic risk scenarios.
How Banks Evaluate 3-Star Hotel Financial Projections
Banks look beyond headline profit figures when appraising a hotel project finance proposal. The appraisal team examines assumptions, ratios and cash flow quality to assess the hotel’s ability to service debt and sustain long-term operations. Market research conducted independently by the bank or through TEV studies is compared against the promoter’s projections.
Key Points Lenders Check:
- Reasonableness of occupancy and ARR assumptions relative to location and competition
- Revenue mix between rooms, F&B and banquet; whether the cost structure is realistic
- Operating margin trends and whether EBITDA improvement is logically linked to occupancy growth
- Promoter contribution and overall hotel funding structure; debt–equity ratio (typically ≤ 2:1, often ≤ 1.5:1 for riskier projects)
- DSCR, interest coverage, break-even occupancy, EBITDA margin and leverage ratios from the projected balance sheet
- Whether hotel development timelines and project cost estimates are realistic
A hotel with $800,000 in stabilized NOI valued at a 7% cap rate is worth $11.4 million – illustrating how hotel investments are valued based on operating performance, not just property value. Merely presenting attractive projected profits does not make a proposal bankable. The hotel’s financial health must be demonstrated through coherent, reconciled financial analysis.
Common Mistakes in 3-Star Hotel Financial Projections
- Assuming 70–80% occupancy from Year 1 without justification – market trends in most Tier-II cities support 40–50% initial occupancy for new properties
- Projecting ARR escalation of 10–15% annually without competitive benchmarking
- Ignoring seasonality and assuming uniform monthly revenue
- Overstating banquet and F&B revenue without matching market demand data
- Underestimating salaries, power bills and OTA commissions; many models allocate too much money to revenue-generating activities while underbudgeting undistributed operating expenses
- Using incorrect depreciation rates or grouping all assets under a single depreciation schedule
- Keeping interest expense flat across years despite reducing term-loan balance
- Mismatch between projected P&L, cash flow and balance sheet – the income statement and balance sheet must reconcile
- Inadequate working capital provision, leading to cash-flow strain despite positive profit
- Artificially inflated DSCR calculations and no sensitivity analysis
All financial obligations and ratios should be cross-checked before submission. Prepare projections within an integrated financial model rather than isolated spreadsheets.
Financial Projections, CMA Data and Professional Support
CMA (Credit Monitoring Arrangement) data is a structured format used by Indian banks summarising past financial performance and future projections. It is related to but not identical with the DPR financial model – CMA data usually presents 5–7 years of financial statements, whereas a full 3 star hotel DPR financial model may run for a longer horizon and include detailed operating schedules, DSCR and sensitivity workings.
While a Chartered Accountant can prepare or assist in preparing the 3 star hotel financial projections, CMA data and project finance proposal, the projected numbers remain management estimates based on agreed assumptions – they should not be described as “certified” by a CA. The project report should clearly state the basis of preparation and the responsibility for underlying assumptions. A hotel feasibility study prepared early helps align project cost, means of finance, loan structuring and operational assumptions into a coherent business plan.
How CA Manish Gugliya Can Assist with 3-Star Hotel DPR and Financial Projections
I specialise in preparing detailed project reports, CMA data, 3 star hotel financial models and bankable project reports for hotel and hospitality projects across India. My work covers end-to-end financial aspects of hotel development – from project conceptualization to bank presentation.
Key support areas include:
- Complete 3 star hotel project report with realistic financial projections
- Structured projected profit & loss, balance sheet and cash flow statement
- Integrated DSCR and loan-repayment analysis with year-wise schedules
- Project cost assessment referencing realistic 3-Star Hotel setup cost in India benchmarks
- Revenue models built on occupancy, ARR, RevPAR, F&B and banquet assumptions
- Break-even occupancy analysis and sensitivity scenarios meeting bank appraisal standards
- CMA data preparation, bank query handling and profitability analysis refinement
- Assistance in preparing documentation for hotel management and franchise fee structures
- Support with working capital assessment and secure loans structuring
The goal is to prepare a DPR where the hotel’s financial standing is clear, the financial model is internally consistent, and the projections are practically achievable.
Conclusion: Making 3-Star Hotel Financial Projections Bankable
Strong 3 star hotel financial projections for DPR must be grounded in realistic assumptions on occupancy, ARR, RevPAR, revenue mix, operational costs and financing structure. The average revenue, operating expenses, EBITDA and cash accrual figures must connect logically across all projected years and across all three financial statements.
The ultimate objective of the financial model is not to show attractive accounting profit but to demonstrate sufficient cash flow for timely debt servicing, acceptable DSCR and long-term financial sustainability. A hotel’s profitability on paper means little if how much cash is actually available for loan repayment falls short.
Treat the DPR as a decision-making tool rather than a formality. Use the projections to refine project design, tariff strategy and cost structure before committing capital. Carefully prepared 3 star hotel project report financial projections – covering the complete hotel business from operational efficiency to long term investments in maintenance and renewal – can significantly improve both the bankability and eventual financial performance of your star hotel project.
Frequently Asked Questions (FAQ)
The following FAQs address practical doubts promoters often raise while preparing 3 star hotel financial projections for DPR and bank loan proposals. Each answer is concise and supplements the detailed discussion above.
How many years of financial projections should I include in a 3-star hotel DPR?
Most Indian banks are comfortable with at least 7 years of projections, covering construction completion, ramp-up and stabilization. Some project finance cases may require 10 years to match the full loan tenure. The projection period should at least cover the entire term-loan repayment schedule so that DSCR can be evaluated for every year. According to ICRA’s hospitality sector outlook, industry demand remains robust in domestic markets, but projections should still account for potential slowdowns over longer horizons.
Should land cost be included in the project cost and financial projections?
Treatment of land varies. Some DPRs show land at historical or market value in the project cost, while others treat it as promoter’s contribution in kind. Both approaches are acceptable but must be disclosed clearly. From a lender’s perspective, including land strengthens security cover, but banks primarily focus on whether hotel operations can service debt from internal cash generation – not from the property value of the land alone.
How do I factor GST and other taxes into hotel financial projections?
Room and F&B revenues should generally be shown net of GST in the P&L, with GST liability and input credits reflected in working capital and tax reconciliation rather than as part of income. Income tax on profit should be modelled using the applicable corporate tax regime. Investment opportunities may exist under specific state tourism policies, but promoters should consult their CA for current rates and any sector-specific concessions applicable to hotel owners in their state.
Can I use franchise or management fees in the DPR projections, and how are they treated?
If the hotel will be operated under a brand or professional operator, the management fees – often a base percentage of revenue plus incentive percentage of GOP – must be explicitly included in operating expenses. Banks scrutinise these fees carefully because they directly reduce EBITDA and cash available for debt servicing. The franchise agreement assumptions must be realistic, disclosed, and the costs involved should be clearly itemised in the P&L.
How often should I revise my hotel financial projections after the project starts?
Treat the original DPR model as a baseline and prepare revised rolling projections at least annually – or more frequently during the first 2–3 years of operations. Comparing actual performance against projections helps with early identification of deviations in occupancy, ARR or cost structure. This approach supports timely corrective actions and maintains the hotel’s financial health relative to the original financial model used to secure the bank loan.
Explore More 3-Star Hotel Project Report Guides
Continue exploring our 3-Star Hotel DPR guides covering setup cost, equipment, project cost, revenue, financial projections, occupancy, feasibility, project finance and bank loan assessment.