Key Takeaways
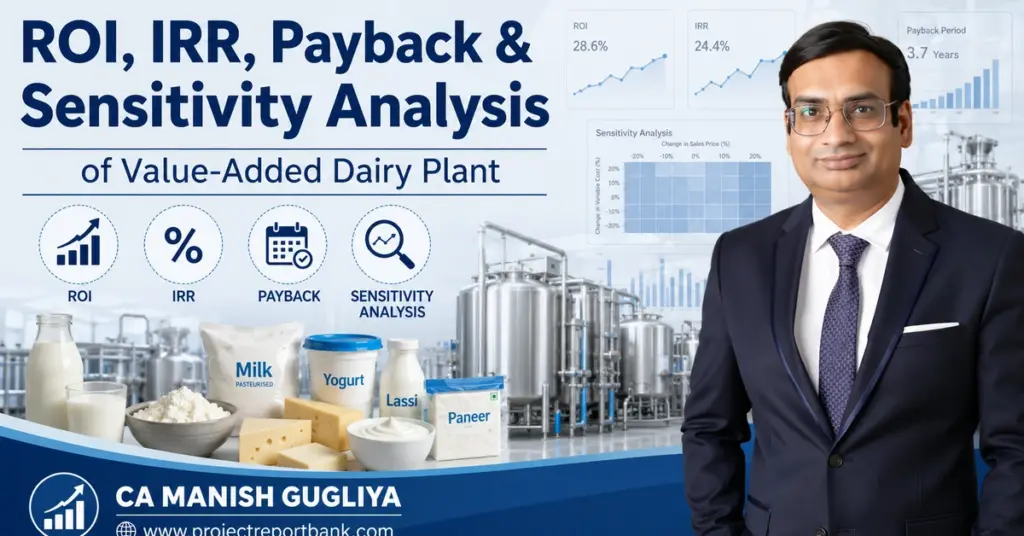
- This article explains how Value-Added Dairy Plant ROI, IRR, payback period and sensitivity analysis are calculated and interpreted for medium-to-large Indian dairy manufacturing projects, using practical project finance language rather than academic theory.
- Net present value, discount rate and projected cash flows are central to dairy plant investment analysis – projected turnover or installed capacity alone cannot establish whether a project is financially viable.
- Milk procurement cost, product mix (paneer, curd, lassi, ghee, probiotic yogurt and others) and capacity utilisation are typically the largest drivers of project returns, and even small percentage changes in these variables can shift IRR and payback by meaningful amounts.
- Banks and investors evaluate a combination of ROI, IRR, DSCR, payback period and sensitivity or downside scenarios before sanctioning term loans or committing equity to dairy plants.
- A customised DPR and financial model prepared by CA Manish Gugliya through ProjectReportBank.com helps promoters take data-driven, informed decisions before committing ₹10 crore or more to a value-added dairy plant.
Introduction: Why ROI & IRR Matter for a Value-Added Dairy Plant
Establishing a modern value-added dairy plant – one that converts raw milk into paneer, curd, lassi, yogurt, ghee, probiotic drinks, flavoured milk or other processed milk products – requires substantial capital expenditure in land, civil construction, milk processing equipment, cold chain infrastructure, utilities, packaging lines and distribution systems. Building a value-added dairy plant requires significant capital expenditure, and the financial commitment can range from ₹10 crore to ₹50 crore or more depending on scale and product portfolio. Dairy processing is extremely energy-intensive, requiring continuous heating and refrigeration, which adds further to the cost base.
Projected turnover or installed capacity does not, by itself, prove that a dairy project will generate adequate returns or repay its term loan. Promoters, investors and lenders need structured answers to harder questions: What is the expected Value-Added Dairy Plant ROI? What does the dairy plant IRR analysis indicate about long-term viability? How quickly will the investment be recovered? And what happens to profitability if milk prices rise or selling prices fall?
Four tools answer these questions in a bankable DPR: ROI (a snapshot measure of annual return on capital), IRR (the discount rate at which net present value of all project cash flows equals zero), Payback Period (time to recover the original investment) and Sensitivity Analysis (testing how results change under different assumptions). Banks and financial institutions in India routinely require all four in a dairy plant project report before considering term loan sanction.
This article is written from the perspective of CA Manish Gugliya, Chartered Accountant and project finance consultant, for promoters, MSMEs and food processors evaluating industrial-scale value addition – not for small household dairy farms. While a traditional dairy farm in many global markets may require an average investment of approximately €142,000, an Indian value-added dairy manufacturing project operates at an entirely different financial scale and requires a more structured, banker-friendly evaluation framework. Globally, milk yield per cow ranges from 3,050 to 4,175 litres annually, but in an industrial processing context, the focus shifts from farm management and herd size to processing efficiency, product margins and investment analysis.
Investment Economics of a Value-Added Dairy Plant
For a medium-scale value-added dairy plant in India – processing milk into paneer, curd, yogurt, lassi, ghee and flavoured milk – illustrative project costs typically fall in the ₹10–₹40 crore range, with larger integrated plants reaching ₹50–₹100 crore. A 50,000 litre-per-day plant with multiple product lines, for example, may involve a total project cost of approximately ₹30 crore, with around 65% financed through a term loan and the balance through promoter equity and margin money.
Key capital cost heads in a typical value-added dairy plant include:
- Land acquisition and site development
- Factory building and civil works
- Milk reception dock and chilling systems
- Pasteurisation and homogenisation equipment
- Product-specific lines – paneer, curd, lassi, yogurt, flavoured milk
- Ghee and butter processing equipment
- Refrigeration plant and cold rooms
- Packaging machinery (pouches, cups, bottles)
- Laboratory and quality control setup
- Effluent treatment plant (high Biological Oxygen Demand wastewater can incur heavy disposal costs if not processed properly)
- Electrical installation and utilities (boiler, water treatment, DG sets)
- Milking machines or milk collection infrastructure where applicable
- Pre-operative expenses and contingencies (typically 5–10% of equipment cost)
Working capital margin requirements cover daily raw milk procurement, packaging material stock, finished goods inventory held in cold rooms and receivables from distributors. These components tie up cash and directly affect cash flows and net present value calculations.
ROI and IRR depend jointly on total project cost, means of finance, ramp-up of capacity utilisation, operational efficiency and realised selling prices of value-added products. For a detailed breakdown of capex heads and funding structure, refer to the article on Value-Added Dairy Plant Project Cost & Means of Finance.
What Is ROI in a Value-Added Dairy Plant?
Return on Investment in the context of a dairy processing plant measures the annual financial return generated relative to the total capital deployed. ROI for a value-added dairy plant is calculated by dividing annual net profit by total capital investment and expressing the result as a percentage.
ROI = (Annual Return ÷ Total Project Cost) × 100
Different DPRs may compute ROI using different numerators – profit after tax (PAT), cash profit (PAT plus depreciation), EBIT or EBITDA – and the denominator may be total project cost, average capital employed or equity investment alone. This variation is why a DPR must always explicitly state which “return” and which “investment” figures have been used to compute ROI, so that promoters, consultants and bankers are comparing the same metric.
Illustrative example (numbers are purely hypothetical):
- Total project cost: ₹20 crore
- Annual cash profit after stabilisation (Year 3): ₹3 crore
- ROI = (3 / 20) × 100 = 15%
This is a simplified snapshot. If EBITDA were used instead of cash profit, the percentage would differ. Value-added dairy products can achieve gross margins of 18–25%, but ROI is computed on net returns after deducting all operating expenses, depreciation, interest and taxes.
ROI is typically calculated once the plant reaches stabilised capacity utilisation – usually by Year 3 or Year 4 – rather than during the initial ramp-up period when revenue is still building.
Factors Affecting Dairy Plant ROI
ROI is not a static number. It moves in response to real-world cost and revenue dynamics that every dairy plant promoter must understand before committing investment. Dairy farm profitability – and by extension, processing plant profitability – is affected by fluctuations in input prices, selling prices and operational variables.
Key drivers of dairy plant ROI include:
- Raw milk procurement price: Raw milk typically accounts for 60% to 80% of total variable production costs. At the farm level, feed costs account for 65–70% of total milk production costs, and in the early 2020s, feed costs rose faster than milk prices, squeezing farmers and pushing up procurement rates for processors. Even a small percentage change in milk cost has an outsized effect on margins.
- Product mix: Higher-value products can generate substantially better margins than commodity liquid milk. Moving from basic fluid milk to high-margin products can exponentially increase revenue potential. A plant’s profitability is heavily influenced by product diversification and value addition.
- Selling prices and market positioning: Competition, brand strength, direct marketing channels and consumer preferences determine realisable prices for paneer, curd, lassi, yogurt and ghee.
- Yields and processing losses: A 1% improvement in yield can translate directly into additional saleable output. Small percentage improvements in processing yield can yield massive financial differences at scale.
- Capacity utilisation trajectory: Operating a plant below 70% to 80% capacity severely penalises ROI. The ramp-up curve in years 1–3 determines how quickly the plant covers its fixed costs.
- Energy and refrigeration cost: Energy-heat recovery systems can drastically cut thermal and electrical utility costs, directly improving margins. Implementing automation minimises human error in dairy processing equipment and reduces waste.
- Packaging material, labour costs and logistics: Labour expenses for some analysed dairy operations average approximately €11,000, but in an Indian value-added plant, the absolute figures vary based on scale and automation level. Distribution margins, cold chain costs and spoilage rates all erode expected returns.
- Interest burden and loan repayment: Even when operational margins look strong, interest cost and principal repayment schedules can reduce accounting profit significantly, tying ROI to capital structure.
For detailed profitability and break-even calculations, refer to the article on Value-Added Dairy Plant Profitability & Break-Even Analysis.
Understanding IRR in a Dairy Manufacturing Project
Internal Rate of Return is the discount rate at which the net present value of all projected cash flows – both outflows and inflows – over the project’s economic life equals zero. In simpler terms, IRR answers the question: what annualised rate of return does this project generate when you account for both the timing and the magnitude of every cash flow?
Net present value measures investment profitability, and NPV is calculated by discounting future cash flows to their present value. A positive NPV indicates a profitable investment opportunity. IRR is essentially the rate at which NPV crosses zero, making it a direct extension of the NPV framework.
IRR inherently incorporates the time value of money: ₹1 crore received in Year 5 is worth less than ₹1 crore received in Year 1. This is why dairy plant IRR analysis is generally considered more refined than simple ROI – it uses entire project-life cash flows over 10–12 years rather than one year’s profit. Investing in processing facilities can lead to higher cash flows, which in turn improves IRR.
For context, the average internal rate of return across analysed small dairy farms globally is only about 3.72%, and the average NPV for such farms was negative – reflecting that traditional small-scale farming without value addition often struggles to cover its cost of capital. Industrial value-added dairy plants, by contrast, target substantially higher IRR through scale, product diversification and processing efficiency.
IRR is a decision tool: if the project IRR exceeds the investor’s required rate of return or the weighted average cost of capital, the project is financially attractive in principle – subject to risk assessment and sensitivity analysis.
Project IRR vs Equity IRR
Lenders and equity investors often ask for both project IRR and equity IRR in a dairy project financial feasibility report, and confusing the two is a common error.
Project IRR reflects the return generated by total project cash flows before considering the financing structure. It treats the entire investment as if it were funded from a single pool and measures how well the underlying business performs. This is useful for comparing projects of different sizes and leverage levels.
Equity IRR measures the return specifically on the promoter’s equity investment after accounting for term loan interest, principal repayment and taxes. Because equity represents a smaller portion of the total project cost (often 25–35%), leverage amplifies equity returns when the project performs well. Conversely, leverage magnifies losses under a downside scenario, making equity IRR more volatile than project IRR.
Consider a simplified scenario: a project with ₹30 crore total cost and a project IRR of 18%. If funded with 35% equity (₹10.5 crore) and 65% debt, the equity IRR might come out to 22–25% in a strong operating year. But if capacity utilisation falls short or milk costs spike, the same equity IRR could drop sharply because debt-servicing obligations remain fixed regardless of revenue.
There is no universal “good” IRR figure. The required return depends on project risk profile, dairy product category, competitive intensity, scale, cost of capital, location and promoter expectations. A probiotic yogurt line in a competitive metro market carries different risk than a ghee plant near a reliable milk shed.
How IRR Is Calculated in a Dairy Plant DPR
IRR is derived from detailed yearly cash flow projections prepared within the DPR financial model – not from guesswork or industry averages. NPV analysis requires initial investment and projected cash flows laid out systematically across the project’s economic life.
Key elements of the cash flow model include:
- Projected revenues by product line (paneer, curd, lassi, yogurt, ghee, UHT milk, etc.)
- Operating expenses: raw milk procurement, ingredients, packaging, energy, labour, maintenance
- EBITDA and operating margins
- Depreciation and taxation
- Interest and principal repayments (for equity IRR calculation)
- Capital expenditure – both initial and replacement or maintenance capex
- Working capital changes year-on-year
- Terminal or residual value where justified
For project IRR, cash flows before interest and principal are used. For equity IRR, only cash flows available to equity holders after debt servicing are considered. Excel’s IRR or XIRR functions are typically applied once the full sequence of net cash flows – starting with negative investment outflows at Year 0 – is assembled.
For a deeper understanding of the assumptions and structure behind these projections, refer to Value-Added Dairy Plant Financial Projections for DPR.
Dairy Plant Payback Period: Simple & Discounted
Dairy plant payback period is the time required for cumulative net cash inflows to recover the original investment. It directly addresses the promoter’s concern: “How many years until I get my money back?”
Simple payback is the most straightforward calculation. You add annual net cash inflows until their cumulative total equals the initial project outlay. For example:
- Total project cost: ₹25 crore
- Annual net cash inflow after stabilisation: ₹5 crore per year
- Simple payback = ₹25 crore ÷ ₹5 crore = 5 years
This ignores the time value of money entirely.
Discounted payback period applies a discount rate (say 12%, representing the approximate cost of capital) to each year’s cash inflow before accumulating. Because discounted cash flows are smaller than nominal flows, the discounted payback period is always longer – typically stretching to 6–7 years in the same example.
Payback period does not measure overall profitability or returns beyond the payback year. A plant may recover its investment in 5 years but generate strong surpluses for 15 more years – information that payback alone does not capture. Banks may view a shorter payback positively, but they still rely more heavily on DSCR and full-term viability for loan appraisal.
ROI vs IRR vs Payback Period: Practical Comparison
Promoters often confuse ROI, IRR and payback period, or treat them as interchangeable. They are not. Each serves a different purpose in dairy plant investment return analysis and should be presented together in a DPR.
| Parameter | ROI | IRR | Payback Period |
|---|---|---|---|
| Primary purpose | Annual return snapshot | Lifetime annualised return | Capital recovery timeline |
| Time value of money | Not considered | Fully incorporated | Only in discounted version |
| Ease of calculation | Simple | Requires full cash flow model | Relatively simple |
| Snapshot vs full life | Single year or stabilised year | Entire project life | Up to recovery point only |
| Use by bankers | Quick reference | Key appraisal metric | Risk and liquidity indicator |
| Use by investors | Rough assessment | Primary decision metric | Capital exposure duration |
| Main limitation | Ignores cash flow timing | Sensitive to assumptions | Ignores post-payback returns |
No single metric should be used in isolation. A value-added dairy plant DPR should present all three alongside net present value, DSCR and break-even capacity utilisation to give promoters and lenders a balanced, multi-dimensional view.
What Is Sensitivity Analysis in a Dairy Project?
Dairy plant sensitivity analysis is the systematic testing of how key financial results – EBITDA, profit after tax, DSCR, ROI, IRR and payback period – change when one or more major assumptions are varied from their base-case values.
Typical parameters tested include:
- Raw milk procurement price
- Selling prices of major SKUs
- Capacity utilisation ramp-up trajectory
- Project cost overrun
- Packaging and energy costs
- Wage and labour cost escalation
- Interest rate changes
- Implementation delays
- Working capital cycle stretch
This is critical for dairy plants because fluctuations in raw milk prices directly compress or expand profit margins. Seasonal supply variation, competition-led price cuts, rising input costs, and volatile power and fuel expenses can materially change returns from one year to the next.
Lenders look closely at downside sensitivity to understand how robust a project’s value-added dairy plant investment feasibility really is under less favourable market conditions. At minimum, a bankable DPR should evaluate a base case, a moderate downside case and a severe downside case.
Key Variables for Dairy Plant Sensitivity Analysis
This section outlines which assumptions typically have the largest impact on dairy plant profitability and how to structure their testing in a DPR.
Milk Procurement Price
Raw milk is usually the single largest cost line, often comprising 80–90% of total production cost in many dairy product lines. Establishing direct contracts with local farmers can stabilise milk procurement pricing, but price risk remains significant. Establishing long-term sourcing contracts locks in predictable input pricing and reduces exposure. Sensitivity tests should model procurement cost increases of, say, 5%, 10% and 15% above the base case and observe the impact on margins per litre, EBITDA, IRR and DSCR.
Capacity Utilisation
Many DPRs assume 60–70% utilisation in Year 1, scaling to 80–90% by Year 3 or 4. Sensitivity testing should examine what happens if ramp-up is slower – for instance, 45–50% in Year 1 and 65% in Year 2. Operating a plant below 70% to 80% capacity severely penalises ROI because fixed costs remain largely unchanged. The effect on equity IRR is immediate and significant. For a discussion on capacity planning methodology, see Value-Added Dairy Plant Capacity Planning & Product Mix.
Selling Price of Dairy Products
Even a small percentage drop – say 3–5% – in selling prices of high-volume SKUs like paneer, curd or flavoured milk can substantially reduce contribution margins. Fixed costs are largely unchanged, so revenue reductions flow almost directly to the bottom line. Brand positioning and cold-chain logistics dictate how much product reaches consumers before spoilage, further influencing realised revenue.
Product Mix
A higher share of value-added products (paneer, probiotic yogurt, branded ghee) versus low-margin SKUs (plain pouch milk, loose curd) changes contribution per litre of milk processed. Flexibility in processing lines allows for adjustment to seasonal demand, which is why multi-product plants can manage revenue volatility better. Product mix sensitivity should be modelled as part of the Value-Added Dairy Products Revenue Model & Market Strategy.
Project Cost Overrun, Operating Cost Increase and Interest Rate Changes
- Project cost overrun of 8–10% increases debt requirement, equity contribution, depreciation and interest, simultaneously reducing ROI, IRR and stretching payback.
- Operating cost escalation – energy, packaging material, labour, logistics, maintenance – erodes EBITDA margins over time. Total cash expenditures for some dairy operations have averaged €396,099 over the project period, underscoring how cost management is a key factor in profitability.
- Interest rate changes on floating-rate term loans can shift annual debt-servicing obligations and squeeze DSCR in early years when cash flows are already tight.
Example Sensitivity Analysis Matrix for a Dairy Plant
The following matrix illustrates how key financial metrics might move under different scenarios. All values are directional and hypothetical – actual results depend entirely on each plant’s size, location, procurement model, product basket and financing structure.
| Scenario | EBITDA Margin | Profit (PAT) | DSCR (Year 2) | ROI | IRR | Payback Period |
|---|---|---|---|---|---|---|
| Base Case | Healthy | Positive | Above 1.25 | Moderate-Good | Above cost of capital | 5–7 years |
| Milk Cost +10% | Declines notably | Sharp decline | May slip below 1.25 | Declines 3–5% | Falls by 2–4% | Extends 1–2 years |
| Selling Price −5% | Moderate decline | Significant impact | Declines | Declines 2–4% | Falls by 2–3% | Extends 1 year |
| Utilisation −15 pts | Sharp decline | May turn negative early | May breach minimum | Sharp decline | Falls by 3–5% | Extends 2–3 years |
| Project Cost +8% | Marginal impact | Moderate decline | Moderate pressure | Declines | Falls by 1–2% | Extends 6–12 months |
| Combined Downside | Severe contraction | Possibly negative | May fall below 1.10 | Significantly weak | May approach cost of capital | Extends 3+ years |
Such sensitivity matrices are standard features in a professional dairy project report financial analysis prepared for banks and investors. They enable credit committees to visualise how robust the project is under real-world stress.
Scenario Analysis vs Sensitivity Analysis
Sensitivity analysis changes one variable at a time while holding others constant. Scenario analysis changes multiple correlated variables together to simulate realistic market situations – because in practice, a bad year rarely affects only one cost line.
Base Case: Assumes realistic but neutral projections – market-rate milk procurement, moderate selling prices, phased capacity ramp-up, standard operating cost escalation. This is the central projection in the DPR.
Optimistic Case: Better milk procurement terms (perhaps through direct farmer contracts), faster market acceptance of value-added SKUs, slightly higher average selling prices and smoother operations. This shows the upside potential but should not be the basis for loan sizing.
Downside Case: Delayed ramp-up by 6 months, 8–10% higher raw milk procurement rates, increased price competition from large dairies and slightly higher packaging and fuel costs. Lenders review this closely to judge whether the project survives a difficult period without defaulting on debt obligations.
For large dairy investments above ₹10–15 crore, some promoters also run “severe downside” or stress-test scenarios before finalising plant capacity and debt levels. This is prudent financial planning, not lack of confidence.
Relationship Between ROI, IRR and Break-Even
Break-even analysis determines the capacity utilisation or sales volume at which the plant covers all its costs – fixed and variable – before generating any surplus. It sits alongside ROI and IRR as a complementary tool in dairy plant project viability analysis.
- Early break-even (at lower utilisation, say 50–55%) generally supports better ROI and IRR because the plant spends fewer loss-making years before generating surplus cash flows.
- However, a plant can achieve relatively early accounting break-even but still show modest IRR if the initial capex is very high relative to annual cash profits.
- Banks often cross-check ROI and IRR results with break-even capacity to ensure that assumptions about market absorption and milk procurement are realistic and that the break-even point is achievable within the first 2–3 years.
Working Capital, Cash Flows and Effective Returns
Working capital is critical in dairy processing because of daily milk procurement cycles, rapid production turnaround and credit sales to distributors, modern trade and institutional buyers. Higher profit margins are achievable by transforming raw milk into specialised products, but the cash must be available to fund the procurement-to-collection cycle.
Typical working capital components include:
- Daily milk purchases and other raw material costs
- Packaging material stock (pouches, cups, laminates)
- Finished goods inventory held in cold rooms
- Receivables from distributors and retailers (often 15–30 days or more)
- Minimum cash balances for operational contingencies
Even a profitable value-added dairy project can face cash-flow stress and weak effective returns if the working capital cycle is long or under-funded. Higher working capital requirement effectively increases the total investment base, lowering ROI if not planned correctly and reducing net present value.
For a detailed methodology on computing working capital for milk processing operations, refer to Working Capital Requirement for Value-Added Dairy Products Plant.
Relationship Between IRR and DSCR in Dairy Projects
DSCR, or Debt Service Coverage Ratio, is the ratio of cash available for loan servicing (typically net cash accrual) divided by the sum of interest and principal payable in a given year. Banks typically require a minimum DSCR of 1.25–1.50, with the average DSCR across the loan life being higher.
IRR measures investment attractiveness over the project life. DSCR measures year-wise ability to repay bank loans from project cash flows. They answer different questions.
A project may have a decent long-term IRR of, say, 18% but show a low DSCR of 1.10 or less in Years 1 and 2 due to aggressive repayment scheduling, high initial interest burden and low early-year capacity utilisation. This causes lender concern despite attractive long-term profitability. Loan structuring – moratoriums, stepped repayments, longer tenure – can alleviate DSCR pressure in early years without necessarily altering IRR.
Banks stipulate both minimum average DSCR and minimum annual DSCR thresholds. IRR alone cannot offset a weak DSCR in loan appraisal. For detailed DSCR structuring, see DSCR & Loan Repayment Capacity for Value-Added Dairy Project.
How Banks Evaluate Financial Viability of a Dairy Plant
Banks in India evaluate dairy plant bank loan viability on multiple parameters – not just headline ROI figures.
Core appraisal aspects include:
- Promoter profile, track record and experience in the dairy sector or agriculture
- Total project cost and means of finance (debt-equity ratio typically up to 2.5:1 or 3:1)
- Profitability projections with conservative revenue assumptions
- Year-wise DSCR and average DSCR across the loan tenure
- Break-even capacity utilisation and timeline to achieve it
- Working capital cycle and funding arrangements
- Security, collateral and margin money adequacy
- Industry risk, market competition and regulatory compliance
- Sensitivity and scenario analysis results showing downside resilience
Bankers review value-added dairy project profitability analysis together with sensitivity results. A high projected IRR or ROI does not automatically lead to term loan approval if other parameters are weak – insufficient margin money, unrealistic ramp-up assumptions, poor DSCR in initial years or inadequate risk mitigation.
For a deeper understanding of lending requirements, see Bank Loan & Project Finance for Value-Added Dairy Products Plant.
Term Loan Structure and Its Impact on Project Returns
The structure of the term loan – amount, interest rate, repayment tenure, moratorium period and instalment pattern – directly affects annual debt servicing and therefore project cash flows.
A longer tenure with an appropriate moratorium (often 12–18 months for greenfield dairy plants) can alleviate DSCR pressure in early years when capacity utilisation is still ramping up. The trade-off is that total interest outgo over the loan life increases.
Different repayment structures – equal instalments, stepped-up or balloon payments – can change equity IRR and payback period even when project IRR remains broadly similar. For example, a back-loaded repayment schedule improves early-year cash flows and DSCR but increases financial risk in later years.
Realistic loan structuring must align with the plant’s capacity ramp-up curve and seasonal cash flows from value-added products. Milk sales and production volumes fluctuate seasonally, and repayment schedules should account for this. For more on loan structuring, see Term Loan Assessment for Value-Added Dairy Manufacturing Plant.
Overall Financial Feasibility of a Value-Added Dairy Project
Final investment decisions should consider an integrated view of revenue potential, cost structure and financing – not stand-alone ratios viewed in isolation.
Key feasibility indicators to review together:
- Projected turnover and contribution margins by product line
- EBITDA margin and trend over the projection period
- Break-even capacity and timeline
- Cash accruals and free cash flows
- DSCR trends across the loan tenure
- ROI, project IRR and equity IRR
- Payback period (simple and discounted)
- Net present value at the required discount rate
- Sensitivity results across key variables
- Qualitative risk assessment (milk procurement risk, market competition, regulatory compliance)
Location factors (proximity to the milk shed, access to consumer markets), procurement route (direct from farmers versus through aggregators or cooperatives – in some regions, over 50% of raw milk comes from small farms) and product portfolio (fresh versus long-shelf-life products) materially affect feasibility. Short food supply chains enhance dairy product prices by capturing margins that would otherwise go to intermediaries.
Value-Added Dairy Plant ROI that looks attractive on paper must be stress-tested for fluctuations in milk procurement cost, fuel prices, packaging costs and selling prices before promoters commit capital. For a comprehensive discussion, see Value-Added Dairy Plant Feasibility & Project Viability.
How Product Selection Shapes Investment Returns
Different value-added dairy products generate different margins, working capital needs and shelf-life risks, making product selection a critical lever in dairy plant investment return analysis.
- Paneer: A high-contribution product with strong urban demand but limited shelf life (5–7 days without preservation techniques). Requires strict quality assurance practices to prevent costly mass-contamination recalls. Higher profit margins are achievable compared to fluid milk. Refer to the Industrial Paneer Manufacturing Plant Project Report for product-specific analysis.
- Curd / Dahi: Moderate margins, large volumes, short shelf life. Branded cup-format dahi commands better pricing than loose curd. See the Curd / Dahi Manufacturing Plant Project Report for detailed economics.
- Lassi: Seasonal demand peaks in summer months. Flavoured lassi variants improve per-litre realisation. Refer to the Industrial Lassi Manufacturing Plant Project Report.
- Probiotic products: Higher margins and growing consumer interest, but require specialised cultures, stricter quality control and stronger cold-chain discipline. See the Probiotic Dairy Products Manufacturing Plant Project Report.
- Ghee and butter: Longer shelf life, lower cold-chain dependency. Diversifying into cheese or fresh cheese processing can also improve profitability – cheese production can yield €0.688 more profit per litre than milk, and diversification into cheese processing is economically feasible even for small farms. For ghee and butter economics, see the Ghee, Butter & Milk Fat Processing Plant Project Report.
Product mix choices affect capacity utilisation patterns, seasonal demand peaks and cash flow timing, all influencing net present value and payback dynamics. Strategic value addition – moving from bulk curd to branded cups, or from loose ghee to packaged retail SKUs – can significantly improve per-litre realisation through direct sales channels, thereby lifting ROI and IRR.
Common Mistakes in Calculating ROI, IRR and Payback
Based on reviewing multiple dairy project financial models, certain errors recur frequently. These mistakes can make a project appear more attractive than it realistically is, leading to funding difficulties or execution challenges after commissioning.
Common errors include:
- Assuming 90–100% capacity utilisation from the first year of operations
- Underestimating milk procurement price and ignoring seasonal spikes in cost
- Overestimating selling prices without accounting for distributor margins, promotional discounts and competitive pressure in a volatile market
- Underestimating packaging and cold-chain costs, especially refrigerated transport
- Ignoring maintenance capex and periodic replacement of critical equipment (homogenisers, pasteurisers, compressors)
- Neglecting taxation impact on cash flows and net present value
- Confusing accounting profit with project cash flows – cash flow is what services debt, not book profit
- Misclassifying working capital as revenue rather than an investment that ties up cash
- Mixing up project IRR and equity IRR in presentations to bankers – these are structurally different metrics
- Using unrealistic loan repayment assumptions that do not align with the capacity ramp-up curve
- Ignoring by-product revenue (whey, buttermilk) or overestimating its contribution
- Ignoring the economic effects of spoilage, transit losses and inventory write-offs
These errors can mislead promoters into over-sizing plants, over-leveraging or committing to products without adequate demand validation.
Why Sensitivity Analysis Is Essential for ₹10 Crore+ Dairy Investments
Medium-to-large value-added dairy plants in India routinely involve investments well above ₹10 crore and may use significant bank term loans with tenures of 7–10 years. At this scale, robust dairy project risk analysis is not optional – it is mandatory for both prudent decision-making and lender confidence.
Even a 5% change in average milk procurement price or a 10-percentage-point shortfall in capacity utilisation can translate into crores of rupees over the project life, materially shifting ROI, IRR and DSCR. Sensitivity and downside scenario analysis serve as decision-support tools that help promoters fine-tune plant size, expand or contract debt levels and refine product mix before locking in capex and loan documents.
Such analysis also strengthens the DPR’s credibility in front of credit committees and investment partners because it demonstrates that the promoter has thought through real-world volatility – not just optimistic projections. When promoters revisit assumptions after reviewing sensitivity results (for example, phasing expansion or moderating initial capacity), it is a sign of prudent financial planning and improve profitability over the long term.
What Should a Bankable Dairy Plant DPR Include?
A bankable DPR is not merely a technical document. It is a structured, comprehensive financial and commercial submission forming the basis of dairy plant project report financial analysis for lenders and investors.
A complete DPR should include:
- Executive summary and promoter background
- Industry overview and market assessment with data collection on demand, competition and pricing trends
- Product profile, positioning and target consumers
- Detailed manufacturing process and plant layout
- Capacity planning, product mix and phasing strategy
- Machinery list with quotations and technical specifications
- Land and building estimates, utilities and infrastructure plan
Financial sections must cover:
- Project cost estimate and means of finance
- Revenue model, pricing strategy and milk sales projections
- Cost of production analysis
- Projected profit and loss, balance sheet and cash flow statements
- Working capital assessment
- Break-even analysis
- DSCR calculations (year-wise and average)
- ROI, IRR and payback period computations
- Structured sensitivity and scenario analysis
- Risk assessment and mitigation strategies (procurement tie-ups, marketing channels, experienced technical staff, quality systems)
These elements, presented coherently and supported by realistic assumptions, determine whether a DPR supports profitable decisions by lenders and investors – or gets returned for rework.
How CA Manish Gugliya & ProjectReportBank.com Can Assist
CA Manish Gugliya specialises in DPR preparation and project finance analysis for value-added dairy manufacturing plants across India. The objective is to build realistic, transparent and banker-friendly financial models that help promoters understand both upside potential and downside risks before committing capital.
Services include:
- Detailed Project Report (DPR) – for bank finance and investor presentations
- Customised financial projections based on project-specific assumptions
- Project cost and means of finance structuring
- Working capital assessment
- DSCR and break-even analysis
- ROI, IRR and payback period computation
- Sensitivity and scenario analysis
- Term loan assessment and repayment structuring
- Overall project viability evaluation for long term sustainability
Each project is evaluated based on its specific capacity, product mix, location, milk procurement model, selling price assumptions, cost structure, financing pattern and promoter contribution. No generic templates or universal benchmarks are applied, and no guarantees of loan sanction, profitability or specific investment returns are made. The role is to equip promoters with the financial clarity they need to make informed, data-driven decisions.
Promoters planning a paneer, curd, lassi, probiotic or ghee-based value-added dairy plant are invited to reach out via ProjectReportBank.com for a customised DPR and value-added dairy project financial analysis.
Frequently Asked Questions
This FAQ addresses practical questions on Value-Added Dairy Plant ROI, IRR, payback and sensitivity analysis that promoters and investors commonly raise.
What is a realistic way to decide whether to go ahead with a ₹15–20 crore value-added dairy plant?
Promoters should first obtain a professional DPR with realistic assumptions on milk procurement cost, selling prices, product mix and capacity utilisation trajectory. ROI, IRR, NPV, DSCR and payback period should then be evaluated together rather than relying on any single number. The expected economic performance should be stress-tested through sensitivity and downside scenarios to understand how returns change if costs rise or prices fall. Results should be discussed with the banker and financial advisor before committing to land purchase or machinery orders. This integrated approach is significantly more reliable than relying on back-of-the-envelope revenue calculations.
How do changes in milk procurement strategy (direct from farmers vs through aggregators) affect ROI and IRR?
Direct procurement from farmers and dairy cows may reduce per-litre cost and improve margins, but requires investment in chilling centres, collection infrastructure and field staff for farm management. Buying through aggregators may be easier operationally but typically leaves a lower margin for value addition. The DPR can model both strategies with separate cash flow projections to show the impact on EBITDA, ROI, IRR and payback, helping promoters determine which model better suits their capabilities and risk appetite. In agriculture-dependent milk sheds, direct relationships with farmers also help ensure consistent supply during lean seasons.
Can a value-added dairy plant be viable if it sells mostly through B2B or institutional channels instead of retail?
Selling through B2B bulk channels typically yields lower margins than retail channels, but B2B sales to hotels, restaurants, caterers and food manufacturers often come with larger volumes and quicker off-take. The DPR should explicitly model B2B versus retail price and margin differences, along with variations in credit period and logistics cost, to check the effect on net present value, DSCR and overall project viability. Many successful dairy businesses use a mixed-channel approach to balance margin with volume stability.
How frequently should ROI and IRR be revisited once the plant starts operations?
Promoters should track actual performance against DPR assumptions monthly and update a simplified financial model at least annually to compare realised cash flows with original projections. Major changes in milk price trends, product mix, selling prices, income patterns, or debt structure (such as refinancing) justify a fresh ROI, IRR and sensitivity run. This ongoing data-driven review guides decisions on expansion, diversification or course correction – and is essential for long term sustainability of the business.
Is it necessary to use complex simulation tools (like Monte Carlo) for dairy plant investment analysis?
While advanced simulation methods can provide additional insight – particularly for very large, multi-product dairy farms globally or integrated processing complexes – for most medium-sized Indian value-added dairy projects, a well-structured Excel-based financial model with systematic sensitivity and scenario analysis is sufficient for bank appraisal. Data quality, realistic assumptions and transparent presentation of important aspects are typically more valuable to lenders than complex mathematical methods. When combined with clear ROI, IRR, payback and DSCR metrics, a professionally prepared financial model provides the analytical depth needed to invest with confidence and reduce costs of uninformed decision-making.