Key Takeaways
- An eye hospital revenue model must be built bottom-up from patient volume, service mix, installed capacity and realistic pricing-not from a desired turnover figure.
- An Eye Hospital Project Report in India should break revenue into OPD consultations, cataract and other surgeries, diagnostics, optical, and pharmacy (where applicable), each supported by clear formulas and documented assumptions.
- Capacity utilisation of OPD rooms, operation theatres, beds and key diagnostic equipment must ramp up over 2–3 years instead of starting at 100% from the first month.
- Banks and financial institutions generally look for explainable revenue assumptions that align with project cost, equipment, manpower plan and means of finance before considering term loans or working capital facilities.
- This article is written from the perspective of CA Manish Gugliya (ProjectReportBank.com) and focuses on practical, India-specific guidance for preparing eye hospital financial projections and revenue estimates.
Explore Eye Hospital DPR Guides
Explore our complete series on Eye Hospital project planning, financial analysis and bank finance.
Introduction – Why Revenue Modelling Is Critical in an Eye Hospital Project Report
In any eye hospital project report in India-whether for a new setup or an expansion planned for 2026 onward-the revenue model is the foundation on which profitability, cash flow and loan-repayment capacity rest. The organized eye care market in India is valued at ₹25,000 crore, and with over 12 million operable cataract cases existing annually in the country, the demand for quality care is real. Yet simply writing down a round annual turnover figure like “₹5 crore” or “₹10 crore” tells a banker or investor nothing about whether that number is achievable.
Revenue projections must be derived from operational assumptions using a structure such as patient volume × service utilisation × average realisation. A comprehensive project report for an eye hospital includes various components-an executive summary provides a snapshot of the project including key elements, while regulatory compliance involves obtaining necessary legal and statutory approvals-but it is the revenue model that ultimately demonstrates the financial viability of the venture. Project reports should demonstrate the feasibility and operational sustainability of the hospital, and the revenue section plays a crucial role in that demonstration.
This article focuses specifically on the eye hospital revenue model and revenue projections. For detailed guidance on project cost, equipment planning, and investment structure, this series on ProjectReportBank.com covers those topics in separate guides. Regulatory requirements include licensing and compliance with health regulations, which influence operating cost and timeline but are addressed elsewhere.
What Is an Eye Hospital Revenue Model?
An eye hospital revenue model is a structured method of converting clinical operations-OPD consultations, surgeries, diagnostics, optical sales, pharmacy-into projected income for the project report. Rather than guessing at an annual turnover, the model traces a logical chain:
- Infrastructure & Equipment → Installed Capacity (OPD rooms, OT tables, diagnostic machines)
- Installed Capacity → Maximum Patient Footfall and Service Volume
- Patient Footfall → Service Mix (consultation, surgery, diagnostics, optical, pharmacy)
- Service Mix × Pricing & Payer Mix → Net Revenue
Consider the difference: a simplistic plan says “we will earn ₹8 crore in Year 3.” A properly constructed model says “2 consultation rooms, each handling up to 20 patients per doctor per session, with 2 sessions per day, gives a maximum OPD capacity of 80 patients/day, of which we assume 50% utilisation in Year 1.” For an ophthalmology hospital project report aimed at bank finance, lenders prefer models where every major revenue line can be explained from such capacity and utilisation assumptions.
Major Revenue Sources of an Eye Hospital
Clinical services include various ophthalmic specialties and diagnostic services, and the project report should specify the types of services the hospital will provide. Eye hospitals treat cataracts, glaucoma, and retinal disorders, along with refractive and corneal conditions. Each revenue stream needs separate calculations. Projected revenue should only be shown for services actually included in the proposed setup.
The Aravind Eye Care System has treated over 100 million patients through a business model that combines comprehensive eye care services with outreach. Its experience shows that cataract surgeries typically contribute roughly 50% of surgical revenue in organized eye care chains, while optical sales form 15–20% and pharmacy around 8–10%, with diagnostics and other services making up the rest.
OPD Consultation Revenue
OPD is the primary entry point for patient flow and future surgeries. The practical formula is:
Average OPD Patients per Day × Average Net Consultation Realisation (₹) × Working Days per Month
Not all visits generate the same fee. A typical mix might be 60% paying consultations and 40% follow-ups at reduced or zero charge. Government-empanelled consultation rates sit around ₹350 for eye consultations, which serves as a useful lower bound for pricing strategy.
Illustrative Year 1 calculation (assumptions only):
- 25 OPD patients/day, 26 working days/month, ₹350 average net realisation
- Monthly OPD revenue: 25 × 26 × ₹350 = ₹2.275 lakh
- Annual OPD revenue: ₹27.3 lakh
OPD capacity must be tied to the number of ophthalmologists, their working hours, and the planned outreach and marketing strategy rather than arbitrary patient counts. A detailed staffing plan includes the required number of medical and administrative personnel to support projected volumes.
Cataract Surgery Revenue
Cataract surgeries are typically the largest surgical revenue contributor in Indian eye hospitals. Cataracts affect approximately 14.25% of adults aged 50 and above, making cataract removal one of the highest-volume ophthalmic procedures in developing countries. The core formula is:
Number of Cataract Surgeries per Year × Average Net Realisation per Surgery
The average cost of a cataract procedure in India is ₹20,000–₹50,000, but this is the gross package price. Net realisation depends heavily on payer mix-cash, TPA/insurance, government schemes like Ayushman Bharat, and camp or free patients. Cataract surgery costs of ₹20,000–₹50,000 remain unaffordable for 70% of Indian households, and 42% of potential patients are deterred by high treatment costs. This means that hospitals serving low income groups through subsidised or free surgery will have a lower average net realisation.
Illustrative example: Assume 40 cataract surgeries/month in Year 1, growing to 90/month by Year 3, with an average net realisation of ₹9,000 (reflecting a blended payer mix). Year 1 annual cataract revenue: 40 × 12 × ₹9,000 = ₹43.2 lakh. Cataract volumes must flow logically from OPD numbers and referral activity, not be projected in isolation.
Other Ophthalmic Surgeries (Glaucoma, Retina, Cornea, Oculoplasty, Refractive)
Not every new eye hospital will immediately perform advanced retina or cornea procedures. Eye hospitals also offer services like LASIK and corneal transplants, but projections must match the proposed specialist team and equipment. Key categories include glaucoma surgery, vitrectomy, corneal transplant, squint surgery, and refractive procedures.
Volumes in these areas are usually lower but carry higher average realisation. Conservative initial numbers-perhaps 2–5 cases per month per category-are often more credible in a DPR. Where no super-specialist is budgeted in manpower costs, projecting aggressive advanced surgery revenue will appear inconsistent.
Diagnostic and Investigation Revenue
Diagnostic services such as OCT, visual field analysis, biometry, fundus photography and B-scan ultrasound are important factor-based revenue streams. The formula:
Number of Tests per Day × Average Net Realisation per Test × Working Days
Use realistic utilisation: an OCT machine might perform 4–8 scans/day in Year 1 rather than its theoretical maximum. Where diagnostics are bundled inside surgical packages, the report should clarify how revenue is allocated. For details on how each diagnostic machine contributes to revenue-generating capacity, refer to the guide on Eye Hospital Equipment List & Cost – Complete Setup Guide.
Minor Procedures, Lasers and Therapeutic Treatments
Revenue from YAG laser capsulotomy, PRP laser, intravitreal injections, pterygium excision and chalazion removal adds up over a year. Example: 30 YAG procedures/month at ₹2,000 each yields ₹7.2 lakh annually. Utilisation should be conservative in early years and linked to the presence of required laser equipment and trained doctors.
Optical Store Revenue
An optical unit is optional. Revenue can be modelled as a percentage of OPD patients converting to spectacle or contact lens purchases-typically 25–40% illustratively. Optical gross margins tend to range between 45–55%, but actual margins depend on sourcing, brand mix and local competition. Revenue from optical sales often supports cross-subsidisation of treatment for the poor in some Indian eye care models.
Pharmacy Revenue
In-house pharmacy revenue should be included only if a licensed pharmacy is part of the plan, with investment and pharmacist salary already considered. Link pharmacy revenue to OPD and surgical volumes with a realistic conversion rate. Pharmacy gross margins in India are thinner than optical margins. Avoid unrealistically high pharmacy conversion rates, especially where strong external chemist competition exists.
How to Estimate OPD Patient Volume Realistically
OPD volume projections are the starting point for most revenue lines. A market analysis assesses local demographics and competitor presence-this need assessment should evaluate local eye care demand and existing service gaps. Key factors include city population, catchment area, competitor clinics, number of ophthalmologists, accessibility, and marketing including eye camps and outreach. Rural India has 1 ophthalmologist per 2.5 lakh people, which means that in underserved areas the demand may be high, but access remains constrained.
A new standalone eye hospital in a Tier-3 city may start with just 10–15 OPD patients per day, while an expansion of an existing practice may migrate a larger base. A reasonable ramp-up: Year 1 starting at 15/day reaching 35/day by year-end; Year 2 stabilising at 40–50/day; Year 3 reaching 60–70/day.
How to Project Eye Surgery Revenue from OPD and Referrals
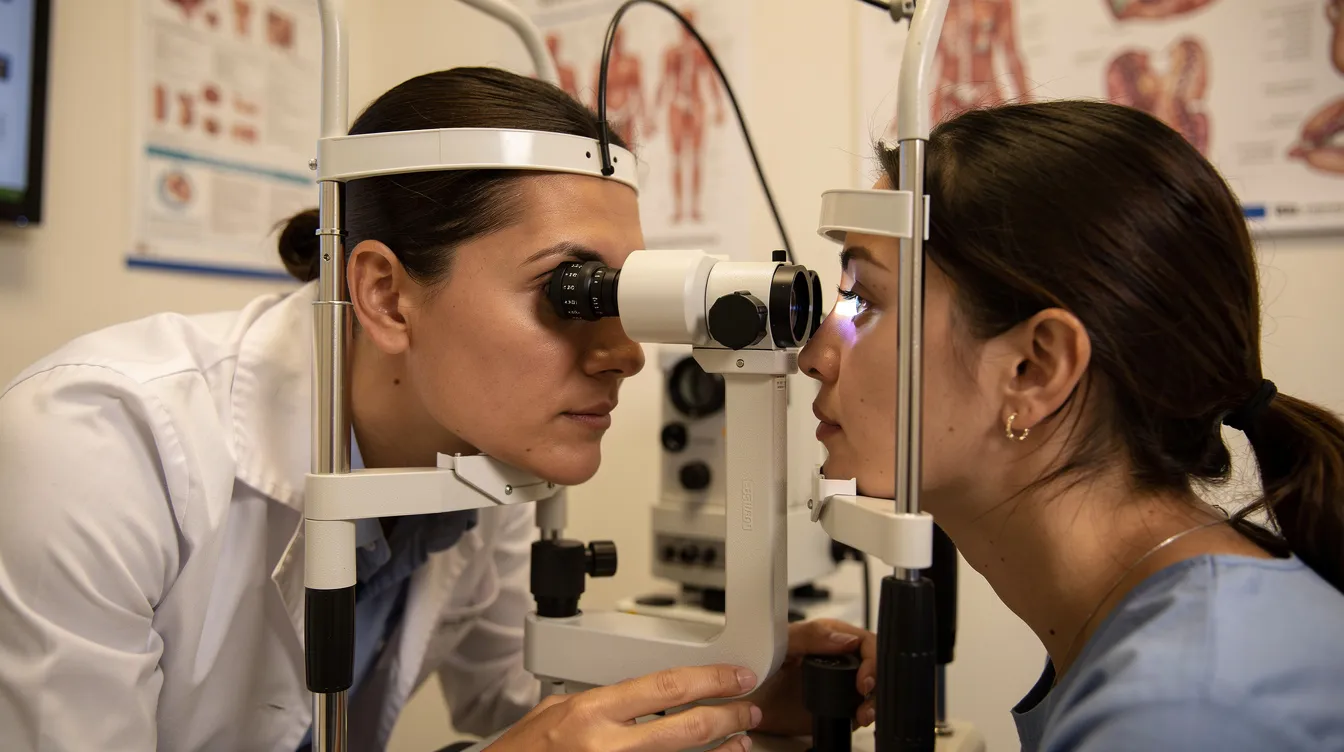
Surgery volumes must follow the patient funnel: OPD/Referral Patients → Diagnosis → Surgical Recommendation → Patient Decision → Completed Surgery. Do not model surgeries as free-floating numbers.
Illustrative funnel: From 800 monthly adult OPD patients, 20% need cataract evaluation, 40% are surgery candidates, and 70% consent to surgery within a defined period-yielding approximately 45 surgeries/month. At ₹9,000 average net realisation, monthly cataract revenue is approximately ₹4.05 lakh. Only 60–70% of cataract surgeries currently reach low income groups, so the conversion rate and affordability in the local context matter significantly.
The eye hospital DPR should also account for how outreach eye camps, GP referrals and optometrist referrals feed surgical volumes, and align projected surgeries with OT days, slots and surgeon availability.
Capacity Utilisation in Eye Hospital Revenue Projections
Capacity utilisation measures how much of the hospital’s installed capacity is actually used. An OT could theoretically handle 12 short cataract cases per session, but actual utilisation will be lower due to breaks, emergencies, no-shows and case complexity. Approximately 25% of patients cite long wait times as a treatment deterrent, so efficient operations and scheduling directly affect patient satisfaction and volume.
The Aravind Eye Care System, headquartered in Tamil Nadu, has demonstrated what high-efficiency operations look like. Aravind’s surgeons perform over 2,000 surgeries per year each, and the Aravind Eye Care System performed over 500,000 surgeries in 2021-2022. Aravind’s assembly line surgery model minimizes idle time for surgeons, and their operational model reduces administrative overhead by 15–20%. While most new hospitals cannot replicate Aravind’s scale immediately, the principle of increasing productivity through efficient scheduling and support systems applies universally.
Realistic utilisation ranges for a new hospital: 30–50% in Year 1, gradually increasing to 60–75% by Year 4–5. OPD, OT and diagnostic utilisation must be mutually consistent-extremely high OT utilisation with very low OPD numbers will be seen as inconsistent by a lender.
How to Select Pricing and Average Net Realisation
There is an important distinction between a published tariff and average net realisation. A hospital may list cataract surgery at ₹25,000, but after accounting for TPA discounts, government scheme rates, free cases through eye camps, and follow-up inclusions, the weighted average realisation may be ₹9,000–₹18,000 depending on location and positioning.
Aravind’s dual-hospital system offers free care funded by paying patient revenue-a model where the pricing strategy explicitly cross-subsidises care for the poor. For your project report, estimate average realisation by starting from the proposed tariff, then adjusting for an assumed payer mix (e.g., 50% cash, 25% TPA, 15% government, 10% free/camp). Assumptions should be consistent with the hospital’s market positioning-whether budget, mid-segment or premium. An ophthalmology consultation tariff of ₹500 might convert to ₹350–₹380 net realisation after free follow-ups and concessions.
Preparing Year-Wise Revenue Projections (1–5 Years)
Eye hospital financial projections are typically prepared for 5–7 years, with Year 1–5 receiving the closest scrutiny from banks for DSCR and repayment analysis. Roll Year 1 assumptions forward by separately modelling:
- Patient-volume growth
- Capacity-utilisation improvement
- Service-mix changes (more surgeries, advanced procedures)
- Periodic price increases (5–8% annually)
Operating costs for an eye hospital increase significantly by year five as the hospital scales, and revenue growth must outpace this. Avoid applying a flat 20–25% growth rate to all lines without operational basis. The year-wise schedule should connect logically with planned staffing additions and equipment expansion.
Example Eye Hospital Revenue Projection – Illustrative Model
Below is a hypothetical Year 1 projection for a 25-bed eye hospital in an Indian Tier-2 city (all figures are assumptions for illustration only):
| Revenue Stream | Monthly Assumption | Monthly Revenue (₹) | Annual Revenue (₹) |
|---|---|---|---|
| OPD Consultations | 30 patients/day × 26 days × ₹350 | 2.73 lakh | 32.76 lakh |
| Cataract Surgeries | 40 cases × ₹9,000 | 3.60 lakh | 43.20 lakh |
| Other Surgeries | 10 cases × ₹14,000 | 1.40 lakh | 16.80 lakh |
| Diagnostics | Lump sum estimate | 1.20 lakh | 14.40 lakh |
| Optical Sales | Based on OPD conversion | 2.00 lakh | 24.00 lakh |
| Pharmacy | Based on OPD + surgical cases | 1.50 lakh | 18.00 lakh |
| Total Year 1 | 12.43 lakh | ₹1.49 crore |
By Year 3, with OPD growing to 60 patients/day, cataract volumes reaching 90/month and modest tariff increases, total revenue generated could illustratively reach ₹3.0–₹3.5 crore. These numbers are not industry standards-actual revenue depends on the specific city, competition, specialties, and promoter capabilities.
Linking Revenue with Eye Hospital Project Cost
Revenue projections cannot be evaluated independently. Setting up an eye hospital requires significant capital investment, and the scale of projected revenue should correspond with the hospital’s infrastructure and cost structure. A well-structured project report connects investments to demonstrated healthcare needs. For a detailed analysis of investment components, refer to the guide on Eye Hospital Project Cost in India – Complete Investment Breakdown.
A project showing only one small OT and limited diagnostics cannot credibly support ₹15 crore in Year 3 turnover. A typical eye hospital facility should be 20,000–25,000 sq ft, and infrastructure specifications outline space requirements for various hospital functions-these physical parameters directly constrain revenue potential.
Equipment and Revenue-Generating Capacity
Each revenue stream depends on specific equipment, consumables and trained human resources. Equipment requirements comprise specialized machinery such as operating microscopes and lasers. Projecting substantial LASIK revenue while omitting excimer laser from the CapEx schedule will be viewed as inconsistent by lenders. Adding a second phaco machine in Year 3 could justify increased cataract capacity and higher projected surgical revenue from that year onward, but only if the manpower and technology plan supports it.
Revenue Projections and Means of Finance
Project cost is funded through promoter’s capital, term loans and possibly subsidies-collectively the “means of finance.” Revenue projections help assess whether this financing structure is sustainable in the long run. Projected revenue feeds into estimated EBITDA and cash accruals, which determine whether the hospital can meet its instalments and interest obligations. Lenders review DSCR derived from revenue and operating profit margins to assess repayment capacity. For more on structuring investment, see Eye Hospital Project Cost & Means of Finance – How to Structure the Investment.
How Revenue Projections Flow into Financial Statements
Revenue sits at the top of the projected Profit & Loss Account:
Revenue → Direct Costs/Consumables → Gross Margin → Operating Expenses (salaries, rent, utilities, marketing) → EBITDA → Depreciation & Interest → Profit Before Tax → Tax → Profit After Tax → Cash Accrual
Financial projections detail capital and operational expenditures along with revenue models, and the financial analysis must distinguish between capital and operating expenditures. Realistic revenue assumptions drive accurate break-even analysis and DSCR calculations. Inconsistencies-such as unrealistically low receivables against heavy TPA billing-weaken the entire project report’s credibility. Patient volumes, operational efficiency, and quality control are essential topics to address alongside the financial sustainability of the plan.
Common Mistakes in Eye Hospital Revenue Projections
In my experience while preparing project reports, these recurring errors appear in eye hospital revenue modelling:
- Assuming full OPD and OT capacity from Month 1 with no ramp-up
- Projecting high surgery volumes without a realistic OPD base or referral system
- Using published tariff as net realisation without accounting for discounts and free cases
- Projecting revenue from equipment not included in the project cost
- Ignoring seasonality (monsoon, harvest, festivals)
- Applying a uniform 25–30% annual growth rate without operational basis
- Copying another hospital’s projections without adapting to local management and conditions
- Mismatch between revenue, manpower and working-capital assumptions
- Quality and safety measures are excluded, which can affect customer satisfaction and long-term revenue
Internal consistency across all schedules is often more important to a banker than the absolute size of projected turnover. Conservative, explainable assumptions generally serve the promoter better than aggressive, unsubstantiated projections.
What Banks and Lenders May Examine in Revenue Projections
Appraisal approaches vary, but lenders commonly examine: reasonableness of OPD and surgery numbers, alignment between projected revenue and physical capacity, promoter track record, pricing assumptions versus the local market, projected profitability, DSCR, working-capital adequacy and repayment schedule.
Financial feasibility must include sensitivity analyses for key operational variables-lenders may test how a 10–20% revenue shortfall affects DSCR. A sophisticated spreadsheet does not substitute for the ability to explain and defend core assumptions. Financial projections are estimates, not guarantees; banks understand this but rely on the revenue model being grounded in realistic business logic.
Conservative, Realistic and Aggressive Scenarios
Scenario analysis strengthens any ophthalmology hospital project report:
- Conservative: Slower OPD build-up, lower surgery conversion, modest pricing
- Base/Realistic: Most probable case, used as the main projection
- Aggressive: High patient growth and utilisation, tested for internal planning
The same infrastructure can produce very different revenue outcomes if OPD volumes or conversion rates shift. For bank-finance purposes, the realistic scenario should be the primary case. Scenario analysis also helps promoters plan contingency strategies if initial patient uptake is slower than anticipated-this detailed analysis can support better management decisions and protect financial sustainability.
Expert Note by CA Manish Gugliya
An Eye Hospital Project Report should not begin with the turnover figure the promoter wishes to show. Revenue should be derived from operational assumptions-patient footfall, service mix, conversion into procedures, capacity utilisation and average realisation. When these assumptions are internally consistent with equipment, manpower, project cost and means of finance, the financial projections become far easier to present and explain.
In my experience, eye hospital projects where every revenue line traces back to an identifiable capacity or volume assumption receive a more favourable reception from lenders and investors. No professional can certify or guarantee future revenue; projections remain estimates subject to actual performance. But a well-built revenue model signals that the promoter has done serious homework about eye health demand, the local value chain, and the organization of their proposed hospital.
CA Manish Gugliya – Chartered Accountant | Project Report & CMA Professional | ProjectReportBank.com
About CA Manish Gugliya
CA Manish Gugliya is a Chartered Accountant with professional experience in project reports, CMA data, financial projections and business-finance advisory for SMEs and healthcare ventures in India. He has prepared feasibility reports and financial models for hospitals, diagnostic centres and eye hospital projects intended for bank finance and investor evaluation. Through ProjectReportBank.com, he publishes a focused educational series on Eye Hospital Project Report topics covering project cost, equipment planning, revenue modelling and means of finance. The objective is to help entrepreneurs understand core financial concepts so they can assess their proposals and discuss them confidently with lenders, investors and technical consultants. The content is informational and should be adapted with project-specific data and professional advice before final submission to any bank or institution.

Frequently Asked Questions
The FAQs below address practical queries that often arise when preparing an eye hospital revenue model and project report in India.
How should seasonal variation be handled in eye hospital revenue projections?
Some regions in India see higher cataract surgery volumes during cooler months or post-harvest periods when patients from rural areas are more willing to travel, and lower volumes during monsoon or festival seasons. Projections can reflect this by adjusting monthly or quarterly volumes while keeping annual targets realistic. For bank submission, a stabilised “average year” view is often acceptable, but internal planning benefits from granular monthly estimates. Seasonality assumptions should be based on promoter or consultant experience and clearly documented.
Can outreach eye camps be treated as a separate revenue line in the project report?
While many outreach eye camps serve society as community service and may not directly generate significant revenue, they feed surgical and OPD volumes at the base hospital-these are already captured in consultation and surgery lines. If the hospital receives nominal fees at camps or funding from NGOs and other organizations, such income can be shown as “camp income” with conservative assumptions. Camp-related expenses (transport, staff, consumables) should also be visible so the net financial impact is clear alongside the social benefit of addressing blindness and corneal blindness in underserved populations.
How should GST be considered in eye hospital revenue calculations?
Most core healthcare services-consultation, surgeries, in-patient treatment-are generally exempt from GST in India under current law, while optical and pharmacy sales may attract GST. For project-report purposes, show revenue net of GST for taxable segments, with GST collections and payments appearing in separate working-capital calculations. Promoters should discuss project-specific GST treatment with their Chartered Accountant, as rules can change and may differ across products and services.
How frequently should revenue projections be updated after the hospital starts?
Once operational, management should compare actual monthly performance with projected figures and update rolling projections at least annually-or more frequently during the first 12–18 months. This supports better staffing, marketing and investment decisions, and also helps when providing revised CMA data to banks. Updating projections does not change the original project report submitted for finance but improves ongoing focus and financial control.
Is it necessary to hire a professional to prepare the eye hospital revenue model?
While promoters with strong financial skills can attempt basic projections, engaging a Chartered Accountant experienced in healthcare project reports helps build a more robust, internally consistent financial model. A professional can assist in structuring assumptions, ensuring alignment between project cost, equipment, manpower and revenue, and preparing bank-ready CMA data. However, no professional can guarantee future revenue or loan sanction. Promoters should remain actively involved in defining operational assumptions-they understand the clinical vision, sight restoration goals, early detection priorities and local market realities of their proposed eye hospital better than anyone.
Explore All Eye Hospital DPR Guides
Continue exploring our complete series on Eye Hospital project planning, financial projections, repayment capacity and bank finance.
- Eye Hospital Project Report / DPR for Bank Loan – Complete Guide

- Eye Hospital Term Loan Assessment: How Banks Evaluate Your Project in India
- Bank Loan for Eye Hospital – Project Finance & Documentation Guide

- Eye Hospital DSCR & Loan Repayment Capacity – Complete Guide
- Eye Hospital Working Capital Requirement – Assessment & Calculation (India-Focused Guide)
- Eye Hospital Financial Projections – How to Prepare Projections for DPR (India)
- Eye Hospital Revenue Model – How to Prepare Realistic Revenue Projections (Eye Hospital Project Report)
- Eye Hospital Project Cost & Means of Finance – How to Structure the Investment
- Eye Hospital Equipment List & Cost in India – Complete Setup Guide