Key Takeaways
- Breakfast cereals and extruded foods financial projections must reflect product mix, realistic capacity ramp-up over 3–5 years, working capital absorption and debt servicing capacity-not merely machinery capacity or market size estimates.
- Indian banks and investors typically require 10-year projections with year-wise DSCR analysis, IRR and NPV calculations, and sensitivity scenarios before approving term loans or committing equity to cereal and extruded foods plants in the ₹5 crore–₹50 crore+ range.
- Profitability depends on net realisation per kg after trade discounts, raw material and packaging costs (which together can exceed 60–70% of operating expenses), actual capacity utilisation, and the chosen distribution strategy-whether B2B, private label, branded retail, exports or modern trade through convenience stores.
- Financial modelling should integrate production capacity with operational cost estimates, and must separately evaluate economics for each product line rather than applying a single averaged margin across corn flakes, extruded cereals, oats and snack pellets.
- Project Report Bank, led by CA Manish Gugliya, FCA, DISA (ICAI), prepares customised, bankable financial models and Detailed Project Reports for industrial breakfast cereals and extruded foods manufacturing projects across India.
Introduction: Financial Evaluation of Breakfast Cereals and Extruded Foods Plants in India
Promoters planning large-scale breakfast cereals and extruded foods plants frequently begin by evaluating installed extrusion capacity, advertised gross margins and broad market growth figures. While these provide directional confidence, they do not answer the question that matters most: can the proposed project generate sufficient cash to service its debt, deliver reasonable returns to promoters, and sustain operations through the initial years when utilisation is still ramping up?
The global breakfast cereal market was valued at USD 112.76 billion in 2025 and is projected to reach USD 154.34 billion by 2034, growing at a CAGR of 3.6% from 2026 to 2034. Breakfast cereal sales are projected to reach USD 65.5 billion by 2036 under certain estimates covering specific segments. The Indian organised breakfast cereal market itself was estimated at roughly ₹1,200–₹1,400 crore in FY2023–FY2024, growing at approximately 14% CAGR. These numbers confirm growing demand, but they do not tell a promoter whether a specific 10–15 TPD plant at a particular location, with a chosen product mix, will be bankable.
For industrial plants requiring capital investment of ₹5–₹50 crore or more, financial feasibility must be evaluated through an integrated 10-year breakfast cereals and extruded foods financial projections model. The model must capture product-specific yields, realistic capacity utilisation ramp-up, raw materials pricing, packaging requirements, channel-specific net realisations, working capital cycles and debt repayment schedules.
Breakfast cereals are made from grains like corn and oats, and the product range extends from plain flakes to fortified multigrain cereals, granola and muesli, extruded snacks and ready-to-fry pellets. Each product category carries different conversion costs, pricing power and distribution economics. A financially sound project evaluation must account for these differences.
Why Financial Projections Are Critical for Breakfast Cereals and Extruded Foods Projects
A 10-year projection model is not a regulatory formality. It is the primary tool for testing whether the proposed project generates enough operating cash flow to cover term loan repayments, fund working capital growth and deliver adequate returns to promoters.
Indian banks use projected financial statements-including CMA Data, projected profit and loss, balance sheet and cash flow-to appraise term loan proposals. They compare projected DSCR, EBITDA margins and working capital adequacy against internal benchmarks before sanctioning credit. Effective project finance planning involves loan structuring and means of finance assessment that aligns debt with cash generation capacity. Building financial projections requires capital investment and operational expenses analysis conducted together, not in isolation.
Private equity and strategic investors take a different but overlapping view. They evaluate project IRR, equity IRR, scalability, payback period and downside resilience. Investor-ready documentation should include detailed financial projections and market analysis that demonstrates how the business performs not only under favourable assumptions but also when key variables move adversely.
A common mistake is equating projected accounting profit with cash available for debt service. Accounting profit includes non-cash items like depreciation, while actual cash generation depends on EBITDA minus taxes, minus incremental working capital absorption, minus maintenance capital expenditure. A project showing ₹3 crore PAT may have only ₹1.5 crore available for debt service if working capital absorbs ₹1 crore and replacement capex consumes another ₹0.5 crore. First-year operating costs for cereal plants are projected to be significant, and early-year cash generation is often lower than the P&L suggests because of ramp-up-related inefficiencies and receivable build-up.
Business Models Within Industrial Breakfast Cereals and Extruded Foods
The financial profile of a breakfast cereal or extruded foods project changes substantially depending on the product lines chosen. One margin assumption cannot fit all categories.
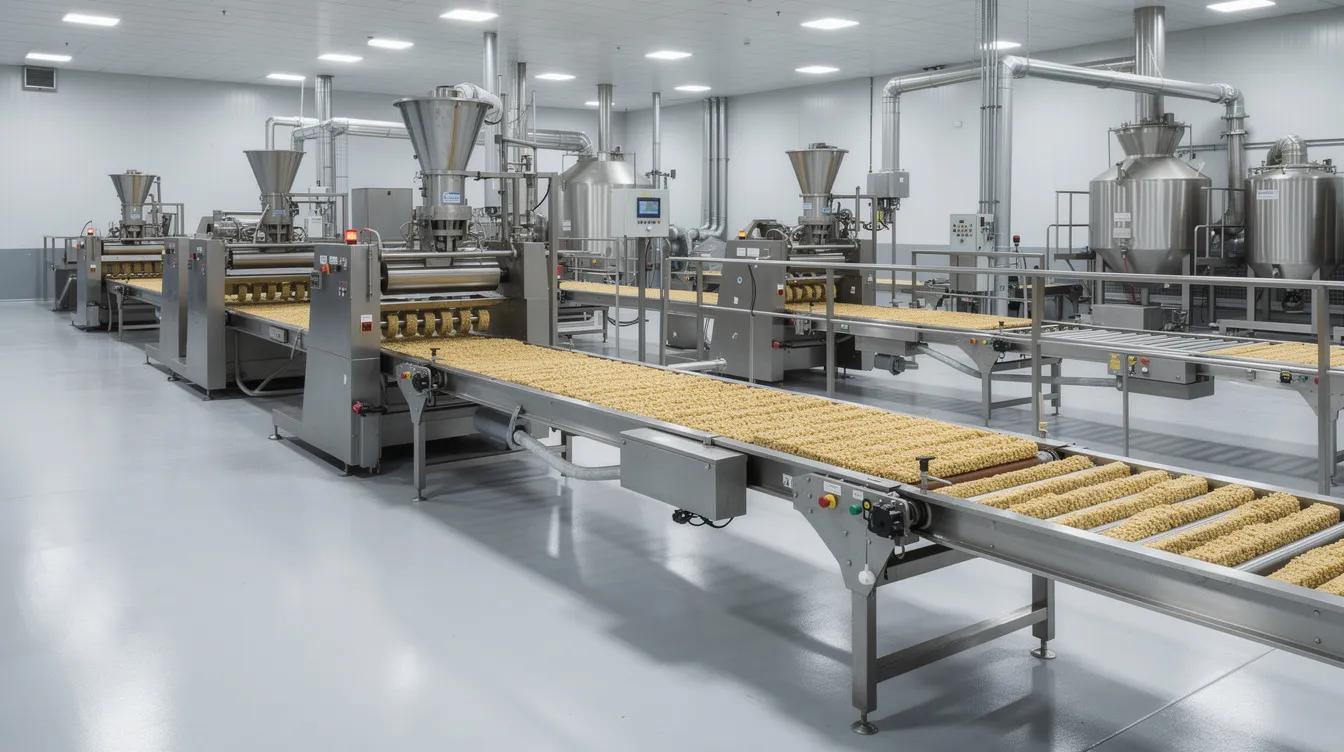
Extrusion technology produces breakfast cereals in a continuous process, and twin-screw extruders are commonly used for cereal production because they offer precise control over temperature, pressure and moisture. Extrusion enhances the texture and nutritional profile of cereals while allowing for mass production of convenient breakfast options. The manufacturing process includes cleaning, milling, cooking, and drying grains before shaping, coating or packaging. Extrusion cooking transforms raw ingredients into diverse consumer preferences-from simple puffs to complex filled pillows.
Industrial corn flakes and multigrain flakes require flaking, roasting and toasting equipment with significant capital intensity in drying and thermal processing. Revenue depends heavily on brand positioning or private-label contracts. Ready-to-eat cereals will account for 52.0% of product type demand in 2026, making this a volume-driven segment where packaging and trade margins significantly influence profitability.
Extruded ready-to-eat breakfast cereals-puffs, loops, coated shapes-represent higher value-added processed food products. Extruded cereals can be fortified with vitamins and minerals, and high fiber and whole grain claims will capture 37.0% of nutrition claim sales in 2026. Net realisation per kg is often higher, but so are R&D, coating, packaging and marketing costs.
Rolled oats and instant oats involve simpler grain processing but strong volume potential in B2B, private-label and health-conscious retail. Hot cereals and oat-based convenient packaged foods cater to dietary habits shifting towards nutritious foods with functional ingredients.
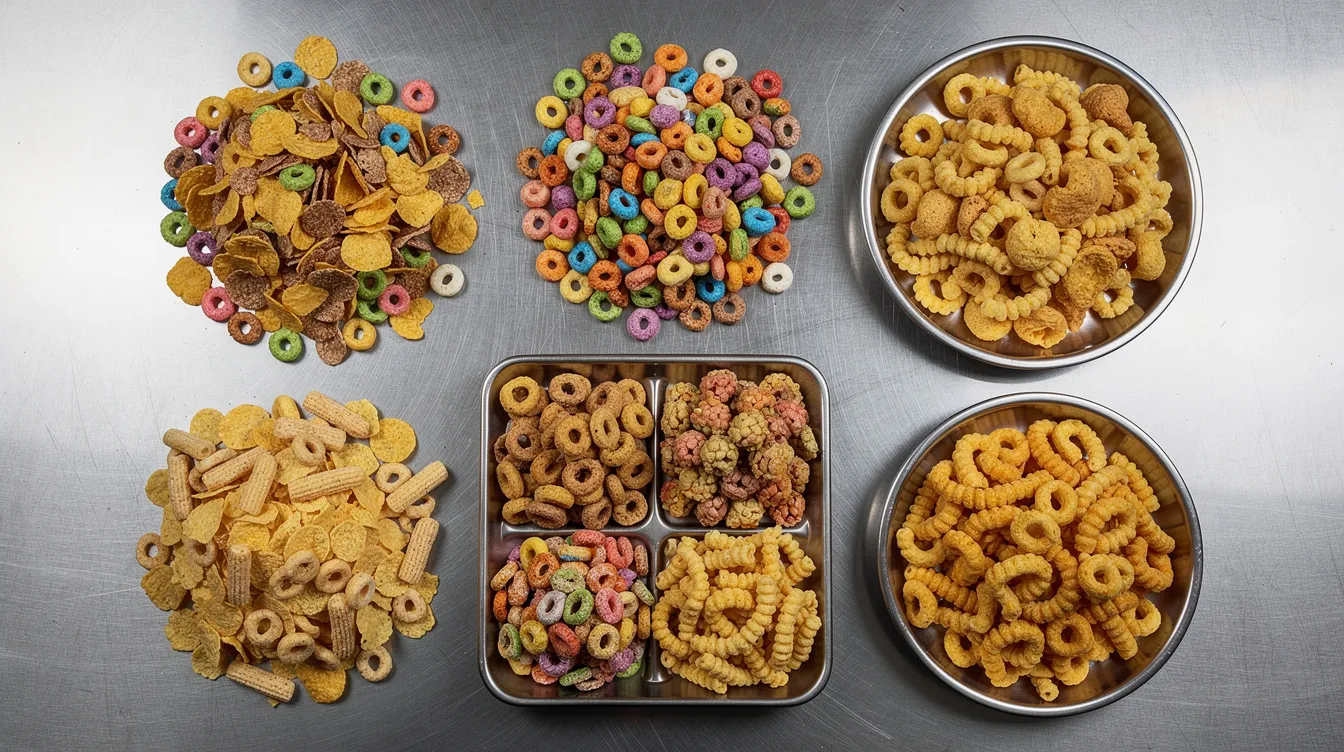
Integrated extruded snack foods and 3D snack pellets share upstream extrusion infrastructure but diverge significantly in downstream processing-seasoning, frying, finishing-and serve different demand cycles. Savory snacks and protein enriched snacks target different market segmentation than breakfast cereals, though they may share the same production facility. Related products such as corn puff and puffed rice have distinct operating economics despite similar extrusion principles.
A robust financial model must be built separately for each chosen product combination rather than forcing an averaged profitability across all extruded foods.
Key Assumptions in a 10-Year Breakfast Cereals and Extruded Foods Financial Projection Model
Every financial projection rests on its assumptions. The table below summarises typical illustrative assumptions for a mid-sized Indian plant producing breakfast cereals and extruded foods. These are indicative ranges, not prescriptive values.
| Assumption Category | Illustrative Range / Value |
|---|---|
| Installed capacity | 10–15 TPD (combined product lines) |
| Annual production capacity | 15,000–25,000 tons at full utilisation |
| Operating shifts | 2–3 shifts per day |
| Operating days per year | ~300 days |
| Capacity utilisation: Year 1 | 40–50% |
| Capacity utilisation: Year 2 | 60–70% |
| Capacity utilisation: Year 3 | 75–80% |
| Capacity utilisation: Years 4–5 onward | 80–85% |
| Saleable yield (raw to finished) | 85–92% depending on product |
| Net realisation: basic flakes/cereals | ₹120–₹200 per kg |
| Net realisation: premium extruded cereals | ₹150–₹300 per kg |
| Raw material cost (wheat/maize/oats) | ₹22–₹35 per kg depending on grain |
| Packaging cost (retail packs) | ₹8–₹16 per 500 g pack |
| Power & fuel cost contribution | 8–12% of manufacturing cost |
| Interest rate on term loan | 9–11% p.a. |
| Repayment tenure | 7–10 years including moratorium |
| Promoter contribution | 25–33% of project cost |
| Depreciation | As per Companies Act / Income Tax rates |
| Annual cost escalation | 3–5% for major cost heads |
| Corporate tax rate | As applicable under chosen regime |
There is a meaningful difference between rated machine capacity-say 1 TPH-and sustainable commercial output after changeovers, cleaning, minor breakdowns and product switching are factored in. American Extrusion International and other leading manufacturers of extrusion equipment specify rated throughput under ideal conditions. Actual saleable production is typically 10–15% lower once operating realities are considered. Building financial projections requires this distinction to avoid overstating revenue.
Capital Investment and Means of Finance in Cereals & Extruded Foods Projects
Capital investment covers land, construction, and equipment costs. For industrial breakfast cereals and extruded foods plants, the main cost heads include land and site development, factory building and civil works, extrusion lines, flaking and drying equipment, packaging automation, material handling, utilities (boilers, compressors, electrical installations), laboratory and quality assurance infrastructure, installation, pre-operative expenses and contingencies.
Capital expenditure often represents 70% to 80% of the total setup costs, with machinery and equipment costs representing a significant portion of capital expenditures in manufacturing. High-quality machinery is essential for cereal production efficiency and safety, and the choice between semi-automatic and fully automatic lines significantly affects depreciation charges and fixed-cost structure in projections.
For a detailed breakdown of project costs, readers may refer to the Breakfast Cereals & Extruded Foods Plant Setup Cost, Investment & Project Economics in India. Similarly, the impact of machinery selection and automation on depreciation and throughput is covered in detail in the Industrial Breakfast Cereals & Food Extrusion Machinery, Plant Layout & EPC Cost in India.
Capital structure planning involves deciding promoter contribution versus term loan. Typical debt-equity ratios for food processing projects range from 1.5:1 to 2:1, implying 60–67% debt funding. Under NABARD’s concessionary refinance scheme, the maximum interest rate charged to end-borrowers is 10% p.a. for eligible food processing units. Working capital margin is added to project cost for term loan appraisal, as banks evaluate total funding requirements including operational liquidity.
Revenue Projections and Production Economics for Breakfast Cereals and Extruded Foods
Revenue is estimated based on production capacity, product mix, and expected selling prices. The correct methodology links installed capacity to actual saleable output:
Annual Saleable Production = Installed Capacity × Operating Hours × Operating Days × Capacity Utilisation × Saleable Yield
For example, a plant with 1 TPH rated capacity operating 16 hours per day for 300 days at 70% utilisation with 90% saleable yield would produce approximately 3,024 tonnes of finished product per year.
Gross Sales = Product-wise Saleable Quantity × Selling Price per Kg
Net Revenue = Gross Sales − Trade Discounts − Returns − Sales Deductions
Channel choice substantially affects net realisation. Bulk B2B and institutional sales offer lower prices but predictable volumes and minimal marketing spend. Private-label supply to established FMCG brands may yield ₹80–₹140 per kg net, while branded retail packs can achieve ₹150–₹300 per kg at ex-factory level depending on value addition-but after accounting for distributor margins (18–22%), modern trade slotting fees and promotional costs, the brand’s net realisation compresses significantly.
Cereals are typically fortified with vitamins and minerals during production, which adds both nutritional value and raw material cost but supports premium pricing. Value-added coatings, flavours and packaging formats-single-serve sachets, stand-up pouches, family cartons-change pricing power for extruded products.
For product-specific revenue patterns, the Extruded Ready-to-Eat Breakfast Cereals Manufacturing Plant Project Report provides relevant analysis. For corn flakes and multigrain flakes positioning, the Industrial Corn Flakes & Multigrain Flakes Manufacturing Plant Project Report covers retail versus private-label economics.
Operating Cost Analysis and Cost of Production per Kg
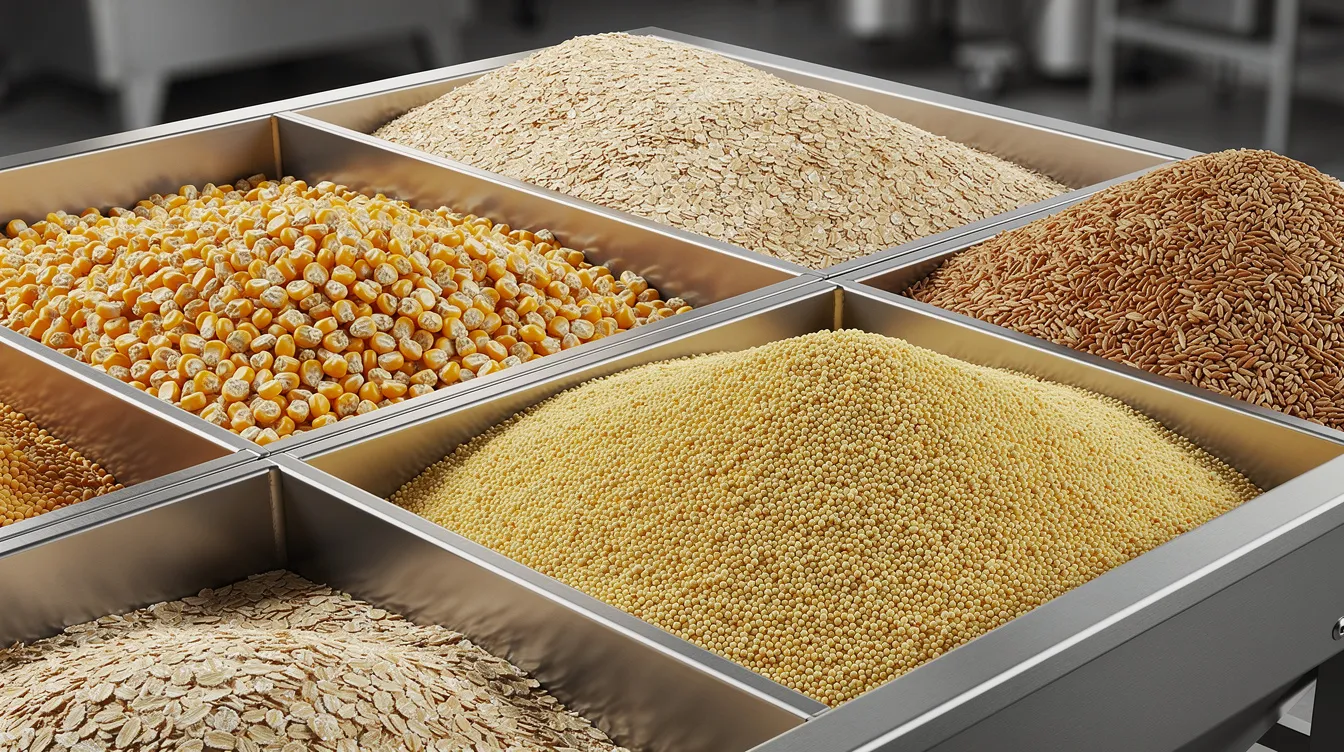
Raw materials account for 60–70% of operating expenses in cereal production, making grain procurement the single largest cost driver. Operating costs for cereal plants are driven by raw materials, and the balance comprises conversion, packaging and overheads. Ongoing costs in manufacturing are classified into variable production costs and fixed overheads.
The illustrative cost breakdown below is for a sweetened multigrain extruded cereal (retail-packed, 500 g):
| Cost Head | ₹ per Kg (Illustrative) | % of Total |
|---|---|---|
| Grains, flours, starches | 28–38 | 22–28% |
| Sugar, glucose, seasonings, coatings | 8–14 | 6–10% |
| Micronutrient premixes, flavours | 3–6 | 2–4% |
| Primary packaging (laminated pouches) | 16–24 | 12–17% |
| Secondary packaging (cartons, shrink wrap) | 5–8 | 4–6% |
| Electricity, steam, fuel | 10–16 | 8–12% |
| Direct production labour | 4–7 | 3–5% |
| Repairs, maintenance, consumables | 3–5 | 2–4% |
| Quality testing, food safety compliance | 2–4 | 1–3% |
| Factory overheads (insurance, admin, AMC) | 5–8 | 4–6% |
| Total Manufacturing Cost | 84–150 | ~65–75% of net realisation |
| Freight, warehousing, logistics | 8–15 | 6–11% |
| Trade discounts, distributor margins | 15–35 | 12–25% |
| Marketing and promotional expenditure | 5–15 | 4–10% |
Regulatory compliance costs are crucial in project feasibility assessments for manufacturing-FSSAI licensing, fortification compliance, front-of-pack labelling and quality assurance add both recurring and one-time costs. Operating costs include labour, maintenance, and quality control as ongoing charges.
Gross profit margins for breakfast cereal manufacturing typically range between 40–50% at the ex-factory level for premium SKUs, but EBITDA margins after trade discounts, distribution and marketing typically settle at 8–12% for established brands and potentially 15–20% for premium niche products with strong volumes.
The distinction matters: contribution per kg is the selling price minus variable cost per kg. EBITDA margin is contribution minus fixed overheads. Net profit margin further deducts depreciation, interest and tax.
Working Capital Requirements and Cash Conversion Cycle
Food manufacturing relies heavily on working capital cycles for operations. Breakfast cereals and extruded foods plants, particularly those supplying branded retail or modern trade channels, typically need substantial working capital for raw material stocks, packaging inventory, finished goods and trade receivables.
Working capital assessments include evaluation of inventory, receivables, and payables:
| Component | Typical Holding Period |
|---|---|
| Raw material inventory (grains, sugar, flavours) | 30–45 days of consumption |
| Packaging material inventory | 20–30 days |
| Work-in-progress | 2–5 days |
| Finished goods inventory | 15–30 days of cost of production |
| Trade receivables (distributors) | 30–45 days |
| Trade receivables (modern trade/supermarkets) | 45–90 days |
| Trade creditors (raw materials) | 15–30 days |
Net Operating Working Capital = Operating Current Assets − Operating Current Liabilities
The cash conversion cycle-inventory days plus receivable days minus payable days-typically ranges from 50 to 90 days for cereal plants depending on channel mix. Modern trade chains in India often retain longer credit periods and impose promotional fees that stretch effective receivable days.
Cash flow analysis is essential for ensuring operational liquidity in manufacturing projects. During rapid sales growth, incremental working capital absorption can consume a large portion of operating profits. This directly affects interest cost on working capital borrowings and feeds into DSCR calculations. A project showing comfortable PAT may still face liquidity strain if working capital growth outpaces internal cash generation.
10-Year Projected Profit and Loss Statement Framework
Calculate profitability through detailed financial statements including income, cash flow, and balance sheets. The 10-year P&L framework for a breakfast cereals and extruded foods plant should follow this structure:
| Line Item | Year 1 | Year 2 | Year 3 | … | Year 10 |
|---|---|---|---|---|---|
| Capacity Utilisation (%) | 45% | 65% | 75% | … | 85% |
| Saleable Production (MT) | X | X | X | … | X |
| Net Sales Revenue (₹ Cr) | X | X | X | … | X |
| Variable Operating Costs | X | X | X | … | X |
| Contribution | X | X | X | … | X |
| Fixed Operating Costs | X | X | X | … | X |
| EBITDA | X | X | X | … | X |
| EBITDA Margin (%) | X% | X% | X% | … | X% |
| Depreciation | X | X | X | … | X |
| EBIT | X | X | X | … | X |
| Interest on Term Loan + WC | X | X | X | … | X |
| PBT | X | X | X | … | X |
| Income Tax | X | X | X | … | X |
| PAT | X | X | X | … | X |
| Net Profit Margin (%) | X% | X% | X% | … | X% |
Capacity ramp-up from 45% to 85% over five years progressively spreads fixed costs across higher volumes, improving EBITDA margins. First-year operating costs are typically significant relative to revenue, and many plants may show modest or negative PAT in Year 1 before achieving profitability from Year 2–3 onward. Depreciation impacts accounting profit but not EBITDA or operating cash flows-a distinction important for both lender and investor evaluation.
Detailed Project Reports summarise total project costs and funding requirements alongside these projected financials. Project Report Bank builds fully linked Excel financial models where clients can modify assumptions and observe the cascading impact on revenue, costs, DSCR, IRR and balance sheet projections.
DSCR Analysis for Breakfast Cereals and Extruded Foods Plants
How are DSCR and profitability assessed for breakfast cereals and extruded foods manufacturing plants? Banks evaluate year-wise and average DSCR over the loan tenure. DSCR measures whether a project generates sufficient cash to cover both principal and interest obligations. An average DSCR of 1.5–2.0 is commonly expected for rigorous appraisals, though some cluster-based schemes accept a minimum of 1.25.
DSCR = Cash Available for Debt Service ÷ Scheduled Debt Service (Principal + Interest)
Cash available for debt service is typically computed as EBITDA minus taxes minus maintenance capex, adjusted for working capital changes as appropriate under the adopted methodology.
| Year | EBITDA (₹ Cr) | Tax | Cash for Debt Service | Principal | Interest | Total Debt Service | DSCR |
|---|---|---|---|---|---|---|---|
| Year 1 (partial) | Low | Minimal | X | Moratorium | X | X | May be < 1.3 |
| Year 2 | Growing | X | X | Begins | X | X | 1.1–1.4 |
| Year 3 | Improving | X | X | Full | X | X | 1.4–1.8 |
| Year 4–5 | Stabilising | X | X | Full | X | X | 1.6–2.2 |
Key factors affecting DSCR include capacity ramp-up speed, interest rate level, moratorium length, working capital interest burden and volatility in gross margin. Banks often focus on whether early-year DSCR (Years 2–4) remains above 1.2–1.3 even under conservative assumptions, rather than only examining the average.
Acceptable DSCR norms vary by bank, industry risk, collateral and financing structure. Some lenders stipulate average DSCR of 1.50–2.00 for fresh term loans, while others may accept lower thresholds if collateral coverage and promoter track record are strong.
IRR, NPV and Investment Return Analysis
Financial projections include ROI and long-term sustainability assessments. Financial modelling includes assessing return on investment and payback periods. Serious investors in breakfast cereals and extruded foods manufacturing expect visibility on multiple return metrics.
Project IRR measures the return on total project cash flows (before considering financing). It answers: what return does the project generate on the entire invested capital?
Equity IRR measures returns to promoters after servicing all debt. Because of leverage, equity IRR is typically higher than project IRR when the project performs well-but risk is also magnified. If DSCR becomes tight due to under-utilisation or input cost spikes, equity returns can erode rapidly.
NPV discounts future project cash flows at an appropriate rate (typically the weighted average cost of capital or an investor hurdle rate). A positive NPV indicates value creation above the required return.
For reference, a DPR for a rice and corn flakes plant (₹4.10 crore CapEx, 6 TPD capacity) projected a rate of return of approximately 51% with break-even at around 41% utilisation. Similarly, ragi and jowar flour processing projects (comparable food processing scale) show IRR of approximately 26–34% with payback of 2.8–3.2 years under conservative assumptions.
The appropriate benchmark depends on the specific project scale, risk profile and financing structure. Promoters and investors should always evaluate upside and downside IRR scenarios rather than relying on a single-point estimate.
Break-Even Analysis and Profitability Assessment
Break-even analysis determines the sales volume needed to cover fixed and variable costs. It identifies the minimum capacity utilisation a plant must achieve to avoid operating losses.
Break-Even Quantity (Kg) = Total Fixed Costs (₹) ÷ Contribution per Kg (₹)
Where contribution per kg = Net selling price per kg − Variable cost per kg.
If fixed operating costs (including depreciation, fixed overheads and interest) total ₹4 crore per annum and contribution per kg is ₹40, the break-even production volume is 10,00,000 kg or 1,000 tonnes. If the plant’s rated annual capacity at full utilisation is 3,000 tonnes, break-even occurs at roughly 33% utilisation.
The distinction between accounting break-even (PAT = 0) and cash break-even (sufficient operating cash to service interest and minimum principal obligations) is important. Cash break-even is typically higher because it requires covering principal repayments that do not appear in the P&L.
Break-even for breakfast cereal manufacturing typically ranges from 3 to 6 years depending on product mix, capital intensity, pricing strategy and ramp-up assumptions. Product mix, packing style (sachet versus family pack), trade schemes and channel margins can reduce contribution per kg and push break-even volume higher.
The margin of safety-the difference between actual production and break-even volume-indicates how resilient the plant’s profitability is to demand or price shocks. Higher operating leverage means that once break-even is crossed, profits increase more rapidly with each additional unit sold.
Comparative Profitability of Different Breakfast Cereals and Extruded Foods Segments
The food industry offers diverse product opportunities within extrusion-based manufacturing. The competitive landscape across segments varies in capital intensity, margin potential and risk profile.
| Parameter | Corn Flakes / Multigrain Flakes | Extruded RTE Cereals | Rolled / Instant Oats | Integrated Extruded Snacks | 3D Snack Pellets |
|---|---|---|---|---|---|
| Capital Intensity | Moderate–High | High | Moderate | High | Moderate–High |
| Gross Margin Potential | 35–50% | 40–60% | 25–40% | 35–50% | 30–45% |
| Marketing Dependence | High (branded) | Very High | Moderate | High | Low–Moderate |
| Working Capital Intensity | Moderate–High | High | Moderate | High | Moderate |
| Distribution Complexity | Complex (retail) | Complex | Moderate (B2B possible) | Complex | Simpler (B2B) |
| Product Differentiation | Moderate | High | Low–Moderate | Moderate–High | Low |
The global extruded snacks market and the food extrusion market continue expanding as consumer trends shift toward ready to eat snacks and ready to eat cereals. In the Asia Pacific region and emerging markets including the Middle East and Africa, Latin America and other emerging economies, rapid urbanization and rising demand for convenience foods are driving significant growth. The UK breakfast cereal market is expected to grow at a 9.1% CAGR through 2036, illustrating the global market opportunity.
For technology and plant-specific economics, readers may refer to:
- Industrial Rolled Oats & Instant Oats Processing Plant Project Report
- Integrated Multi-Product Extruded Snack Foods Manufacturing Plant Project Report
- Industrial 3D Snack Pellets & Ready-to-Fry Products Manufacturing Plant Project Report
A project-specific financial model is essential before determining which segment offers better returns in any given context. Market demand, pricing strategy, supply chain reliability, raw material supply and the competitive analysis for each product must inform the decision.
Financial Sensitivity Analysis and Risk Scenarios
Any breakfast cereals and extruded foods financial projections shared with banks or investors should include at least three scenarios. Sensitivity analysis in financial projections tests the impact of changing key assumptions on project viability.
Base Case: Moderate utilisation ramp-up (45%→85% over 5 years), conservative net realisation, current input prices adjusted for 3–5% annual inflation, and standard trade discounts.
Optimistic Case: Faster ramp-up (reaching 80% by Year 3), slightly improved pricing from export mix or premium positioning, better yields and lower wastage-resulting in higher EBITDA, stronger DSCR and improved IRR.
Downside Case: Slower sales ramp-up (reaching only 70% by Year 4), price pressure from competition, increased maize or oats prices by 10–15%, higher power tariffs, stretched receivable days-stressing DSCR below 1.2 in early years and compressing equity IRR.
| Variable Changed (±) | Impact on EBITDA | Impact on DSCR | Impact on Equity IRR |
|---|---|---|---|
| Selling price −5% | −8 to −12% | −0.15 to −0.25 | −3 to −5% |
| Raw material cost +10% | −6 to −10% | −0.10 to −0.20 | −2 to −4% |
| Utilisation −10% | −10 to −15% | −0.15 to −0.30 | −3 to −6% |
| Interest rate +1% | Minimal | −0.05 to −0.10 | −1 to −2% |
| Combined downside | −20 to −30% | −0.30 to −0.50 | −6 to −10% |
Cost projections must account for seasonal variations in raw material prices, as grains and sugar exhibit price volatility across procurement seasons. The environmental impact of energy-intensive processes (extrusion, drying, toasting) and potential carbon-related regulatory costs should also be considered in longer-term scenarios. Key trends in front-of-pack labelling and HFSS (high fat, sugar, salt) norms could alter the competitive landscape and product positioning, influencing market growth assumptions.
Bank Finance and Investor Evaluation of Cereal & Extruded Foods Projects
Indian banks scrutinise Detailed Project Reports, CMA Data and projected financial statements when evaluating term loans for breakfast cereals and extruded foods plants.
Key lender focus areas:
- Reasonableness of project cost and capital investment
- Promoter contribution (typically 25–33%)
- Debt-equity ratio (1.5:1 to 2:1)
- Year-wise and average DSCR
- Break-even utilisation
- Working capital assessment and adequacy
- Collateral and security coverage
- Implementation schedule and market risk
Equity investors take a different lens. They evaluate long-term demand dynamics in the breakfast cereal industry and the global food extrusion market, scalability of extrusion lines, quality assurance systems, anchor customer relationships, cash generation per ₹ crore invested and exit options. The nutritional benefits of fortified and whole grains products support market demand narratives, but investors need quantified financial feasibility rather than industry trends alone.
The food and agriculture organization and various industry bodies publish data on food produced globally and key factors influencing the food processing sector, which can support market assumptions. Industry trends in the breakfast cereal sector and the broader food industry context-including market size, market dynamics, market segmentation and key players among key companies-should be incorporated into the financial model’s market rationale.
Common Financial Modelling Mistakes in Breakfast Cereals & Extruded Foods Projects
Avoidable errors in financial modelling can render a project unbankable or mislead promoters into committing capital that cannot generate adequate returns:
- Assuming 80–90% utilisation from Year 1. Most new plants operate at 40–50% initially while establishing customers and stabilising production.
- Overstating net selling prices. Ignoring trade discounts, retailer margins, promotional schemes and channel costs inflates projected revenue.
- Underestimating packaging costs. Primary and secondary packaging for retail breakfast cereals can represent 15–25% of total cost.
- Ignoring product-specific yields. Processing losses, moisture reduction and rejects vary between corn flakes, extruded products and oats.
- Underestimating working capital. Modern trade receivable cycles of 60–90 days can absorb substantial cash despite strong reported profits.
- Incorrect DSCR calculation. Using PAT instead of operating cash flows, or ignoring principal repayments during moratorium, misleads lenders.
- Confusing Project IRR with Equity IRR. These measure different things, and presenting one as the other undermines credibility.
- Double-counting subsidies. Overstating subsidy benefits without verifying actual eligibility and disbursement timelines distorts returns.
- Mixing incompatible product economics. Averaging margins across high-value coated cereals, plain oats and low-margin snack pellets without a clear product-mix strategy produces meaningless projections.
Documents and Data Required for a Customised Financial Projection Model
A customised breakfast cereals and extruded foods financial projections model requires project-specific inputs:
- Proposed location and state (affects land cost, power tariffs, incentives)
- Product-wise installed capacity in TPD and proposed technology (single/twin screw extruders, flakes line, oats processing line)
- Preliminary machinery quotations and building cost estimates
- Raw material consumption norms, including rice flour, wheat, maize, oats and other ingredients, with supplier pricing
- Expected yields, recipes, target moisture content and packaging requirements
- Target ex-factory prices by SKU, expected trade margins and export pricing where applicable
- Manpower plan, salary benchmarks, marketing budgets and logistics costs
- Expected promoter equity, proposed term loan amount, desired repayment tenure
- Working capital structure, seasonal procurement plans and any planned subsidies
Projections prepared without these project-specific inputs remain generic and should not be relied upon for actual investment decisions, bank submissions or investor negotiations. Professional advisory services focus on customised analysis tailored to specific project requirements.
Why a Professionally Prepared Financial Model Matters
A professionally built breakfast cereals and extruded foods financial projections model integrates technical capacity, realistic market assumptions and a bankable finance structure into one consistent, internally reconciled framework. It helps promoters understand required investment, likely returns, debt servicing capacity and negotiating leverage with suppliers, lenders and investors.
For banks and financial institutions, transparent assumptions, reconciled financial statements, clearly calculated DSCR and comprehensive sensitivity analysis improve appraisal confidence and accelerate the credit decision process. For related grain-processing financial analysis, readers may also find the puffed rice plant financial projections useful as a comparable reference.
Planning a Large-Scale Breakfast Cereals or Extruded Foods Manufacturing Project?
CA Manish Gugliya, FCA, DISA (ICAI), provides customised financial projections, bankable Detailed Project Reports, project feasibility studies, DSCR and IRR analysis, CMA Data, and investor-ready financial models for industrial food processing projects across India. With more than 20 years of professional experience, the practice delivers project-specific analysis rather than generic templates.
For serious investment proposals, visit www.projectreportbank.com to discuss project requirements and request a customised professional engagement.
No guarantee of bank approval, investor funding or any particular rate of return is implied. All financial projections represent estimates based on stated assumptions and must be validated with project-specific data.
Frequently Asked Questions (Financial Focus)
The following FAQs address common queries from promoters, investors and lenders evaluating breakfast cereals and extruded foods financial projections for industrial plants in India.
How is breakfast cereals manufacturing plant profitability calculated in India?
Profitability is assessed by modelling annual saleable output based on installed capacity, operating days and realistic utilisation. Net realisation per kg is computed after deducting trade discounts and distribution costs. Variable costs per kg-covering grains, sugar, flavours, packaging and utilities-are subtracted to arrive at contribution. Fixed overheads including salaries, insurance and administrative expenses are then deducted to compute EBITDA. Depreciation, interest and tax are further deducted to obtain PAT and net profit margin. Gross profit margins typically range between 40–50% at ex-factory level, but net margins after all costs settle considerably lower-typically 8–15% for well-managed operations depending on scale and product mix.
What DSCR do banks usually expect for cereals and extruded foods plant loans?
Many Indian banks are comfortable when the average DSCR over the term loan tenure is around 1.3–1.5 or higher, though some lenders require average DSCR of 1.5–2.0 for fresh appraisals. Banks also review minimum DSCR in early operating years (typically Years 2–4), expecting it to remain above 1.1–1.3. The exact threshold varies by bank policy, project risk profile, collateral offered and the financing scheme (standard term loan versus NABARD-backed concessional finance). A well-structured repayment schedule with an appropriate moratorium aligned to the production ramp-up period can materially improve early-year DSCR.
How many years of projections are needed for project finance appraisal?
Indian lenders generally expect at least 7–10 years of detailed financial projections, including the construction and implementation period. The projection tenure is typically aligned with the proposed debt repayment schedule so that year-wise DSCR, cumulative cash flows and long-term sustainability of the plant can be evaluated. For breakfast cereals and extruded foods projects with repayment tenures of 7–9 years, a 10-year projection covering stabilisation and at least 1–2 years beyond final repayment provides adequate visibility for both lender and promoter decision-making.
Can a multi-product breakfast cereals and extruded snacks plant offer better returns?
Integrated plants can share fixed infrastructure-extrusion lines, utilities, warehousing, quality labs-and diversify revenue across cereals, oats, extruded snacks and pellets, potentially improving overall capacity utilisation and resilience against demand fluctuations in any single product. However, multi-product facilities require higher capital expenditure, more complex production scheduling, broader raw material procurement including rice flour and specialty ingredients, and deeper working capital. Comparative IRR and DSCR must be evaluated through a unified but product-specific financial model before deciding. The technological advancements in modern twin screw extruders facilitate product flexibility, but the financial model must reflect realistic changeover times and product-specific yields.
Why is a customised financial feasibility study essential instead of relying on generic market reports?
Generic market reports on the breakfast cereal market or the global food extrusion market provide demand estimates and industry trends but do not capture plant-specific capacity, location-driven costs (land, power, labour), financing terms, Indian tax rules, applicable subsidies or the chosen product mix. A customised financial model built by professionals accounts for actual raw material requirements, specific packaging requirements, project-specific depreciation, working capital cycles and realistic net realisations. For investments of ₹5–₹50 crore, decision-making must rest on bankable DSCR, validated IRR and tested sensitivity scenarios-not on generalised market size estimates. Project Report Bank delivers this level of customised, project-specific analysis for promoters across India, covering diverse consumer preferences from breakfast cereals to ready to eat snacks across the food extrusion value chain.