
Key Takeaways
- Dairy beverage plant financial projections form the backbone of any bankable DPR, translating technical plant parameters into projected profit, cash flow and loan repayment capacity over 5–7 years.
- Projections must rest on realistic assumptions specific to Indian dairy beverage plants – covering installed capacity, product mix, net selling price, raw milk cost, packaging, cold chain, utilities and manpower – rather than generic or copied figures.
- Three core projected statements – Profit & Loss, Cash Flow Statement and Balance Sheet – along with supporting schedules drive decision making for banks, investors and promoters.
- Sound projections support investment analysis, net present value assessment and break-even analysis, but they do not guarantee profitability or automatic loan sanction.
- This article, written as CA Manish Gugliya of ProjectReportBank.com, walks you step-by-step through key assumptions, calculations, financial ratios, sensitivity analysis and common mistakes encountered in dairy beverage project DPRs.
Introduction: Why Financial Projections Drive a Dairy Beverage Plant DPR
Creating financial projections for a dairy beverage plant requires understanding capital-intensive manufacturing economics, perishable inventory cycles and volatile input costs – all at once. A machinery quotation or a total project cost figure, no matter how detailed, cannot by itself tell a lender whether your project will generate enough cash to repay a term loan over seven years. That is the job of dairy beverage plant financial projections.
Banks and financial institutions in India need to see projected sales growth, total operating expenses, EBITDA, net profit, cash accrual, working capital needs, the asset-liability position and capital structure before they commit finance. Accurate forecasting is critical in dairy financial projections because dairy involves high fixed costs and perishable inventory, making even small assumption errors expensive. Good projections are realistic, internally consistent and supported by clear technical inputs – from capacity planning and product mix decisions to project cost and means of finance structuring.
What Are Financial Projections in a Dairy Beverage Plant DPR?
Financial projections are a forward-looking financial model that translates your plant’s technical and commercial parameters into year-wise income, expenses, profit, cash flow and balance sheet positions – typically for 5–10 years. Dairy projections require detailed modeling of production capacity and costs because the product range (flavoured milk, milkshakes, protein beverages, functional dairy drinks) each carries different margins, shelf-life profiles and distribution requirements.
The logical chain works like this: operating assumptions (capacity, utilisation, product mix, net selling price, raw milk cost, packaging cost) feed into revenue, then into cost of production, EBITDA, profitability, cash flow and finally into the balance sheet and loan-servicing metrics. The three core projected statements – Projected Profit & Loss Account, Projected Cash Flow Statement and Projected Balance Sheet – must all reconcile with each other.
Supporting schedules typically included in a professional DPR cover sales projections by product or SKU, raw material and packaging cost sheets, utility expenses, employee cost, a depreciation schedule, interest and loan repayment schedules, tax workings and a fixed-asset schedule. A structured dairy beverage plant financial model in Excel should separate inputs, calculations and outputs, enabling scenario testing, investment analysis and net present value calculations when required.
Key Assumptions Used for Dairy Beverage Plant Financial Projections
Assumptions drive every number. Even a strong dairy farm financial model becomes unreliable if assumptions are vague or lifted from an unrelated project. Capital requirements vary with capacity, technology and location, so each assumption must reflect your specific project. All key assumptions – capacity in litres per day, utilisation percentages, prices in ₹ per litre, ingredient rates, packaging cost per bottle, utility tariffs – should be documented in a clear assumptions sheet within the financial model, with units and sources.
Installed Production Capacity
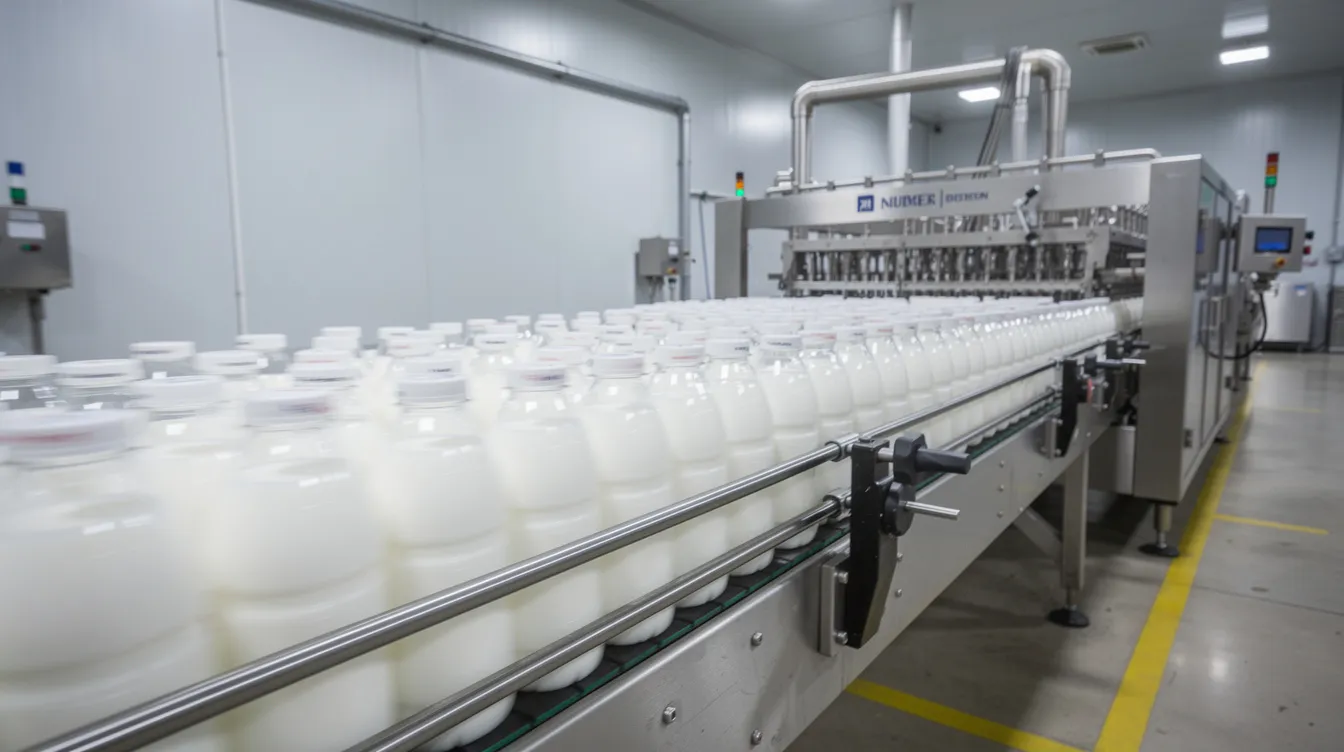
Installed capacity for a dairy plant is typically defined as litres per hour multiplied by the number of shifts and working days per year, accounting for realistic downtime. For example, a 20,000 LPD aseptic flavoured milk and milkshake plant working two shifts for 300 days has a design capacity of roughly 60 lakh litres per year. Different SKUs – 200 ml PET bottles, 180 ml glass bottles, 1 litre packs – pull different filling line speeds, so installed capacity must respect the slowest bottleneck, usually packaging. Capital expenditures for such plants often include processing equipment, packaging lines, cooling systems and capex items such as homogenisers and UHT systems. A dairy processing plant may require ₹80 lakh to ₹1.5 crore just for initial investments in facilities and higher-capacity equipment, scaling upward with automation level and technology.
Capacity Utilisation Assumptions
A new dairy beverage project rarely reaches full capacity in year one. Market development, distributor onboarding, brand building and commissioning stabilisation all take time. Volume forecasting should estimate capacity utilisation over time – industry experience suggests plants may ramp from around 50% in Year 1 toward 80–85% by Year 4 or 5. Dairy beverage demand fluctuates seasonally depending on product type – summer peaks for flavoured milk, steadier demand for protein beverages – and this must be reflected. Assuming 100% utilisation from day one is a common and costly mistake.
Product Mix and Net Selling Price
Revenue projections should break down by product lines: flavoured milk, chocolate milk, thick milkshakes, protein-enriched beverages and functional dairy drinks. The financial model assigns realistic ex-factory net selling prices after trade discounts, distributor margins and GST. Printed MRP is not manufacturing revenue. Fruit-flavoured milk drink plants typically achieve gross profit margins of 30–40%, but only if pricing strategy accounts for trade allowances and distributor margins accurately. Dairy pricing must account for both fixed and variable cost elements. Detailed guidance on aligning product mix with revenue model and market strategy is essential for realistic revenue assumptions.
Raw Milk and Ingredient Cost Assumptions
Raw milk procurement is the single largest cost driver. Average procurement price for standard cow milk in India during 2025 is approximately ₹45–55 per litre, and raw materials account for 70–80% of total operating expenses. Revenue projections depend on milk production per cow and herd size when sourcing from own dairy farm operations, where annual feed costs can total $109,500 for 100 cows. Dynamic cost models are crucial for managing variable pricing in raw milk because raw milk price volatility directly affects dairy product margins. Seasonal fluctuations in milk supply impact pricing and working capital, making it necessary to update procurement assumptions regularly. Key ingredients – sugar, cocoa, flavours, stabilisers, protein concentrates, vitamins – each need per-kg rates and usage norms per litre of finished product.
Packaging Cost
Packaging – PET or glass bottles, caps, labels, shrink sleeves, cartons, or aseptic packaging – often forms 12–18% of COGS for UHT beverages. The model should build per-pack cost (bottle + cap + label + outer carton) and convert it to ₹ per litre. Choosing between chilled distribution in PET or glass bottles versus long-life aseptic packs affects both unit packaging cost and downstream cold-chain expenses. Cost of goods sold must include forecasts for raw materials and packaging together. Businesses must also factor in spoilage and waste in their packaging projections.
Projected Sales Revenue of a Dairy Beverage Plant
Revenue in a dairy beverage plant financial model is built from SKU-wise volume multiplied by net selling price, aggregated to annual projected turnover. The base formula – Production Capacity × Capacity Utilisation × Product Mix × Net Selling Price – is expanded into separate rows for each product category and pack size, including institutional sales and private-label contracts. Dairy farm financial models project revenues over three to five years. Projected sales grow primarily through higher capacity utilisation and wider distribution reach, not through aggressive price escalation. Total revenue should reflect different channels – distributors, modern trade, HoReCa, online grocery and potential export opportunities – because credit terms differ across channels and directly impact cash flow even if they do not change headline revenue.
Projected Cost of Production and Operating Expenses
Projected cost of production covers raw materials, packaging, utilities, direct labour and factory overheads. Operating expenses additionally include administration, selling and distribution. Dairy-specific cost structures necessitate that variable and fixed costs are separate in the model, which is essential for accurate break-even analysis. Operating costs for dairy plants can reach ₹80 lakh to ₹1.5 crore annually depending on scale, and income statements in dairy projects combine revenue, cost of goods sold and operating expenses into a unified P&L structure.
Raw Material Cost
Annual raw material cost equals the quantity of milk and ingredients required at each utilisation level, multiplied by respective rates, with wastage factors and process yields factored in. Raw materials account for 70–80% of operating expenses in dairy plants. Formulation yields differ between standard flavoured milk, thick milkshakes and protein beverages, so accurate yield assumptions (litres of final beverage per litre of input milk) are critical. Bulk procurement contracts and local milk supply strategies can meaningfully influence cost structure and financial planning.
Packaging Material Cost
The model multiplies projected number of packs by per-pack packaging cost (by pack type) to arrive at annual packaging expenses. First-year spending may be higher due to minimum order quantities and printing plate costs. Packaging decisions (PET vs glass vs aseptic) also influence storage, handling and breakage – reflected as wastage provisions in cost estimates.
Power, Fuel and Utilities
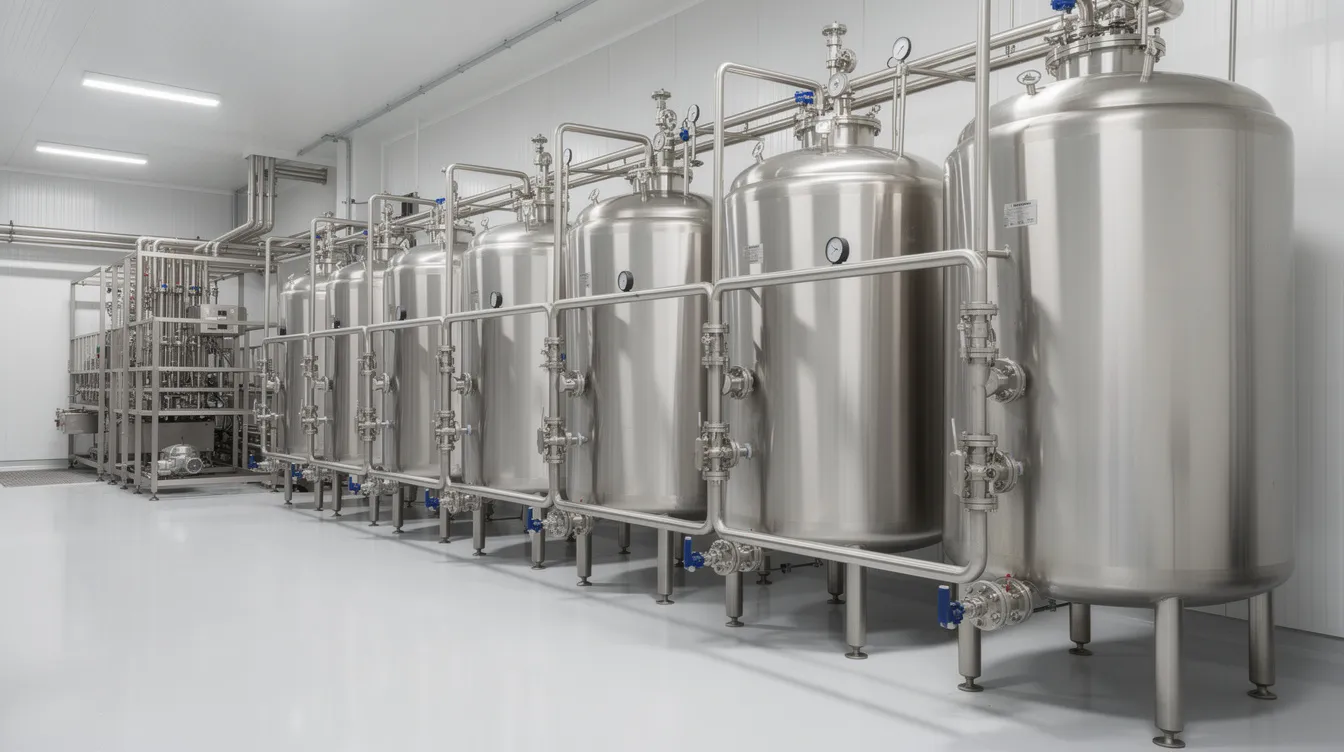
Typical utilities for a dairy beverage plant include electricity for processing and bottling, refrigeration and chilling, steam, compressed air, CIP systems, water and effluent treatment. For a large 200,000 LPD UHT plant, utility costs are estimated at approximately ₹1.70 per litre processed. HTST pasteurisation systems with high regeneration can reduce energy cost to ₹0.06–0.10 per litre versus ₹0.18–0.25 for batch LTLT. Separate utility costs from fixed overheads to accurately project expenses. The plant layout and utility systems design feeds directly into these numbers.
Cold Chain and Distribution Costs
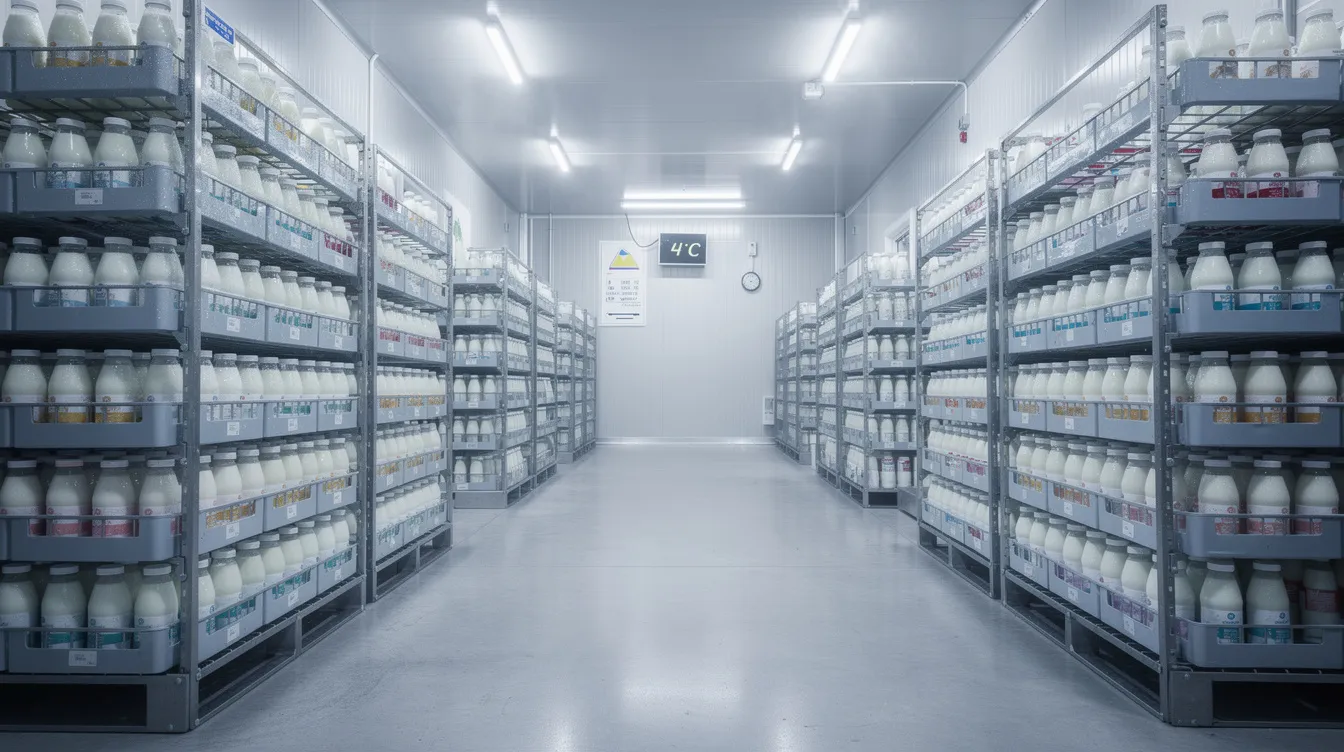
Cold-chain logistics significantly add to dairy operation costs. Many dairy beverages require continuous refrigeration from factory to retailer, involving cold-room operation, reefer vehicles, ice-box handling and ongoing power expenses. These costs are projected on a per-case or per-litre basis and can vary dramatically between chilled and ambient product lines. The cold storage and cold chain requirements for your specific product portfolio must be reflected realistically in projected operating expenses.
Employee and Administrative Expenses
Typical manpower for a mid-scale dairy beverage plant includes production operators, milk reception staff, quality control, maintenance, stores, logistics, sales and marketing, accounts and management. Operating expenses in dairy include labor and facility costs – labor costs for dairy operations can reach $48,000 annually for a small operation and scale substantially for larger plants. Operating expenses include feed costs and labor costs as primary components. Dairy plants also incur regulatory and compliance costs for food safety certifications, licences and insurance, which should be treated as semi-fixed costs.
Selling and Distribution Expenses
Key selling expenses include trade schemes, promotional spends, sampling, sales team costs, branding and advertising. New dairy beverage brands typically need higher initial marketing spends during the first 2–3 years, which must be reflected honestly rather than assumed away. These expenses can be planned as a percentage of net sales, with appropriate notes in the assumptions sheet. Dairy operations face significant regulatory and compliance challenges that add to distribution costs in certain target markets.
Projected Profit & Loss Account for Dairy Beverage Plant
The projected P&L summarises revenue and expenses to show profitability year by year. The structure flows from Revenue from Operations, less raw and packaging materials, power and utilities, direct labour and manufacturing overheads, to arrive at Gross Profit. After deducting employee cost, administration and selling expenses, the model derives EBITDA. Depreciation and interest (on term loan and working capital) are then deducted to reach EBIT, Profit Before Tax and Profit After Tax. Lenders look beyond net profit – they focus on EBITDA, cash accrual (PAT plus depreciation), DSCR and break-even to judge debt-servicing ability. As capacity utilisation improves from Year 1 to Year 5, EBITDA margin typically expands, reflecting operating leverage inherent in capital-intensive dairy beverage manufacturing.
Depreciation Calculation in Dairy Beverage Plant Financial Projections
Depreciation allocates the cost of fixed assets over their useful life. Major depreciable asset groups for a dairy beverage plant include building and civil works, plant and machinery (pasteurisers, UHT systems, homogenisers, mixing and storage tanks), filling and packaging equipment, refrigeration, lab equipment and vehicles. Heavy capital expenditure is typical for dairy beverage plants, and capital expenditures include investments in long-term assets. The DPR must clearly disclose the depreciation method and rates used. A separate depreciation schedule should feed automatically into both the P&L and projected balance sheet.
Interest Calculation on Term Loan
Term-loan interest is projected by applying the interest rate to the outstanding principal balance, considering any moratorium period and agreed repayment schedule. The DPR must distinguish between interest during construction (capitalised as part of project cost) and post-commissioning interest expense shown in the P&L. A common mistake is using a flat interest amount every year instead of recalculating on the reducing balance. The term-loan amortisation schedule – opening outstanding, repayment, interest for the year and closing balance – must link to the cash flow statement and balance sheet. The sanctioned term-loan amount, promoter equity and any subsidies together define the borrowing level, as detailed in the project cost and means of finance structure.
Working Capital Requirement and Working Capital Interest
Dairy beverage plants require substantial working capital to finance milk procurement, ingredients, packaging inventory, finished goods and credit to distributors. Dairy has strict inventory management challenges due to perishability, and high inventory perishability necessitates effective demand forecasting. Cash flow statements are crucial due to cash collection delays from retail distributors. Working capital cycles in dairy are affected by payment term mismatches – working capital cycles are often mismanaged due to the timing of payments between milk suppliers demanding prompt payment and distributors taking 15–30 days credit. Effective working capital management is critical in dairy financial modeling. Inadequate working capital projections can lead to cash-flow stress even when the P&L appears profitable.
Projected Cash Flow Statement
The projected cash flow statement distinguishes accounting profit from actual cash movement. The DPR presents cash from operations (PAT, adding back depreciation, adjusting for working capital changes), cash from investing activities (capital expenditure) and cash from financing (equity, term-loan drawdown, repayments). Profit After Tax plus depreciation is an important indicator of cash accrual, but net cash flow available for loan repayment also depends on working capital investments. Monthly cash flow forecasts should map seasonal supply against demand, especially in the first two years. Cash flow projections also serve as the base for discounted cash flow and net present value calculations. NPV analysis is performed by discounting future cash flows to present value.
Projected Balance Sheet of a Dairy Beverage Plant
The projected balance sheet ties together assets, liabilities and net worth at each year-end, ensuring the financial model is internally consistent.
Assets Side
The assets side includes gross block of fixed assets less accumulated depreciation (net block), capital work-in-progress if phased, inventories (raw milk, ingredients, packaging, WIP, finished goods), trade receivables, cash and other current assets. Inventory levels and receivables must align with working capital assumptions.
Liabilities and Net Worth Side
Key items include promoter’s capital and reserves (net worth), term loans, working capital borrowings, trade creditors and other current liabilities. Retained earnings improve net worth year by year, strengthening the debt-equity ratio. Banks check projected current ratio and total outside liabilities to tangible net worth from these figures.
Linking Project Cost with Financial Projections
The financial model starts with a realistic estimate of total project cost: land, building, plant and machinery, utilities, pre-operative expenses, contingencies and working capital margin. This cost, once structured into means of finance, directly determines depreciation, interest and promoter returns. A detailed breakdown of dairy beverage manufacturing plant setup cost in India shows that a 20,000 LPD PET-bottled plant costs approximately ₹10–12 crore excluding land. Higher project cost without matching revenue potential reduces net present value, IRR and DSCR.
Relationship Between Financial Projections and Break-Even Analysis
Break-even analysis uses projected contribution per unit (selling price minus variable cost) and projected fixed costs to estimate the capacity utilisation at which the plant covers all fixed expenses. Break-even analysis is necessary due to high upfront capital expenditures in dairy beverage manufacturing. Liquid milk operations typically break even in 18 to 24 months, while value-added dairy products achieve full ROI in 3 to 5 years. Understanding break-even capacity utilisation is particularly important when deciding product mix and pricing for dairy beverages with high packaging and cold-chain costs.
Financial Projections and Bank Loan Appraisal
Banks use DPR financial projections during term-loan and working-capital appraisal to assess project feasibility, promoter contribution, repayment capacity and financial performance under stress. Projections are estimates based on assumptions – they support better decision making but do not guarantee future results. A bankable DPR presents key ratios (DSCR, current ratio, debt-equity ratio), loan repayment schedules and cash flows demonstrating adequate headroom above instalment obligations. Transparent, well-documented financial assumptions improve credibility during appraisal. Dairy processing investment analysis includes assessing projected cash flows and key performance indicators to assess dairy farm efficiency and profitability.
Financial Ratios Derived from Projected Statements
Projected financial statements allow calculation of EBITDA margin, net profit margin, return on capital employed, debt-equity ratio, current ratio, interest coverage ratio, DSCR, break-even capacity utilisation, payback period, internal rate of return and net present value. DSCR is derived from cash accrual divided by term-loan obligations (interest plus principal), and banks typically require an average DSCR of 1.2 or above. Net Present Value determines the current value of projected cash flows – if NPV is greater than zero, the investment is considered profitable. NPV requires initial investment, net cash flows, planning horizon and a discount rate that reflects the opportunity cost or required rate of return. NPV analysis helps assess investment profitability in dairy processing and supports strategic planning alongside other metrics.
Sensitivity of Dairy Beverage Plant Financial Projections
Dairy beverage projects are sensitive to changes in raw milk price, packaging cost, capacity utilisation, selling price, interest rate and marketing spends. Sensitivity analysis should assess the impact of raw material cost fluctuations on gross margins. A good financial model enables “what-if” analysis where one assumption changes at a time to reveal impact on EBITDA, PAT, DSCR and net present value. Projections for dairy must address volatility in milk procurement costs – for instance, a 10% rise in raw milk price can erode margins substantially in a high-volume plant. Sensitivity analysis helps identify risks in dairy financial projections and is valued by lenders who want to see risk awareness.
Common Mistakes in Dairy Beverage Plant Financial Projections
Many promising projects face delays because of avoidable errors. Common mistakes include assuming near-100% capacity utilisation from year one, using optimistic printed MRPs as net realisation without deducting trade margins, underestimating packaging and cold-chain costs, and ignoring realistic working capital cycles. Using flat interest expense across all years despite reducing principal, incorrect depreciation methods, and mismatch between P&L, cash flow and balance sheet are equally damaging. Another frequent gap is failure to include a clear assumption sheet. Strong projections are interlinked – any change in volume or price should automatically update revenue, costs, profitability, taxes, cash flow, loan schedules, financial ratios and net present value outputs. Dairy financial models benefit from building direct relationships between inputs and outputs.
Illustrative Financial Projection Framework (5-Year View)
The table below presents a purely hypothetical framework to demonstrate structure. These are not market benchmarks.
| Particulars | Year 1 | Year 2 | Year 3 | Year 4 | Year 5 |
|---|---|---|---|---|---|
| Capacity Utilisation (%) | 50 | 60 | 70 | 80 | 85 |
| Net Sales (₹ Cr) | 15.7 | 19.8 | 24.2 | 28.6 | 31.8 |
| Raw Material & Packaging (₹ Cr) | 11.5 | 14.2 | 17.0 | 19.8 | 21.8 |
| Other Operating Expenses (₹ Cr) | 2.1 | 2.4 | 2.7 | 3.0 | 3.2 |
| EBITDA (₹ Cr) | 2.1 | 3.2 | 4.5 | 5.8 | 6.8 |
| Depreciation (₹ Cr) | 1.2 | 1.1 | 1.0 | 0.9 | 0.8 |
| Interest (₹ Cr) | 1.4 | 1.3 | 1.1 | 0.9 | 0.7 |
| PBT (₹ Cr) | -0.5 | 0.8 | 2.4 | 4.0 | 5.3 |
| PAT (₹ Cr) | -0.5 | 0.6 | 1.8 | 3.0 | 4.0 |
| Cash Accrual (₹ Cr) | 0.7 | 1.7 | 2.8 | 3.9 | 4.8 |
| Term Loan Outstanding (₹ Cr) | 12.0 | 10.5 | 8.7 | 6.7 | 4.5 |
Readers should adapt this framework using their own project-specific assumptions. This table also becomes a convenient base for tracking actual financial performance against projections once the plant is operational.
Financial Projection Workflow for a Dairy Beverage DPR
Good dairy beverage plant financial projections follow a logical workflow: project concept and market positioning → capacity and product mix → selection of processing line and machinery → project cost estimate → means of finance → operating assumptions → revenue and cost projections → P&L → depreciation and interest workings → cash flow → balance sheet → loan repayment analysis → DSCR and ratio analysis → sensitivity testing. This disciplined sequence reduces rework, avoids inconsistencies and accelerates bank appraisal. Structured assumption sheets and linked Excel models make it straightforward to update projections when quotations, interest rates or market information change. Rising urbanization and stable demand for convenient dairy beverages in emerging economies like India make the food processing sector attractive, but only well-structured DPRs convert opportunity into finance.
Role of CA Manish Gugliya and ProjectReportBank.com in Dairy Beverage Project DPR Preparation
As CA Manish Gugliya, I work with dairy beverage entrepreneurs and existing dairy farm businesses across India on Detailed Project Reports, bank loan DPRs, CMA data, project cost structuring, working capital assessment, DSCR calculations, break-even analysis and financial feasibility studies. All dairy beverage plant financial projections I prepare are built using information discussed with promoters, technical consultants and machinery suppliers, ensuring that P&L, cash flow and balance sheet are fully interlinked. ProjectReportBank.com offers sector-specific DPR guidance, customised financial models and support for financial management and bank finance applications for dairy beverage manufacturing plants. Every project is unique – by location, capacity, product range and funding pattern – and requires customised financial modelling rather than a generic template. Clients across the dairy development and food processing sectors rely on this approach for financial assistance from banks and institutions.
Conclusion: Using Dairy Beverage Plant Financial Projections for Better Decisions
Robust dairy beverage plant financial projections connect production capacity, product mix, market assumptions, project investment, borrowing, operating costs, profitability, cash flow and loan repayment capacity into one coherent financial model. A DPR should not be a collection of disconnected numbers – it must clearly explain assumptions, demonstrate financial feasibility, highlight risks through sensitivity analysis and support balanced decision making.
Remember that projections are tools for planning and investment analysis, not promises of results. They must be updated as real data becomes available. Invest professional effort into building a realistic, bankable DPR aligned with your specific dairy beverage project rather than relying on rough estimates or unrelated templates. The difference between a project that secures finance and one that stalls often lies in the quality of its financial projections.
Frequently Asked Questions (FAQs)
How many years of financial projections are usually required in a Dairy Beverage Plant DPR?
Indian banks commonly expect at least 5–7 years of projections, covering the full term-loan repayment period. Equity investors may ask for 8–10 years for deeper investment analysis and net present value calculations. The specific period should match the loan tenure agreed with your lender.
Should I prepare monthly or annual projections for my dairy beverage plant?
Most DPRs present annual projections. However, monthly cash flow and profitability projections for the first 12–24 months are very useful for planning working capital, mapping seasonal supply against demand and managing the commissioning ramp-up. Monthly projections help identify seasonal performance trends that annual figures can mask.
What data do I need from machinery suppliers and technical consultants to build the financial model?
Typical data includes line capacities (litres per hour), utility consumption norms (kWh per 1,000 litres, steam and water usage), expected yields and wastage, labour requirement per shift, recommended product mix options and estimated maintenance costs. All of these feed directly into operating and cost assumptions in the financial model.
How should government subsidies and incentives be treated in projections?
Capital subsidies generally reduce effective project cost or term-loan requirement, appearing as a separate capital reserve. Interest subsidies – such as the DIDF scheme offering up to 2.5% interest subvention – reduce finance cost. Treatment should follow applicable scheme guidelines and the model should clearly show gross interest versus net cost to the promoter.
How often should I update projections once the plant starts operations?
Promoters should revisit and update their dairy beverage plant financial projections at least annually, and preferably every quarter in the first two years. Comparing actual results with projected P&L, cash flow and key ratios helps refine assumptions, flag deviations early and support ongoing financial management and strategic planning.