
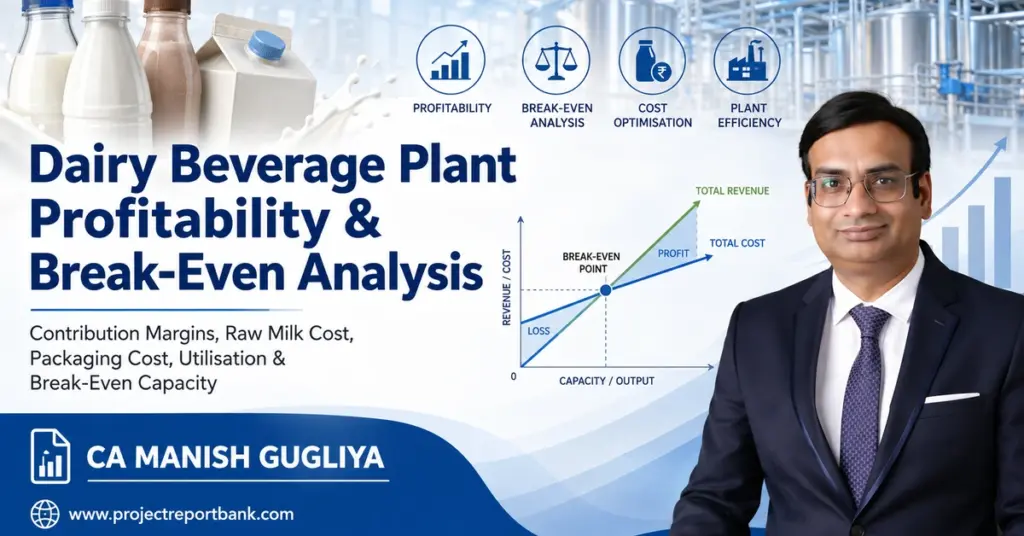
Key Takeaways
- Dairy beverage plant profitability depends on contribution per litre, capacity utilisation, and disciplined control of milk, packaging, and operating costs – high turnover alone does not guarantee profit.
- A plant becomes a truly profitable business only after crossing its break-even capacity and covering both fixed costs and finance charges; break-even for dairy beverage manufacturing typically ranges from 3 to 6 years.
- A structured dairy beverage plant break-even analysis using contribution margin and fixed costs must be completed at the DPR stage, not after commissioning.
- Raw milk cost, packaging cost, product mix, and selling price strategy are the four most sensitive levers for dairy beverage manufacturing plant profitability in India.
- This article is written from the perspective of CA Manish Gugliya (ProjectReportBank.com), focusing on financial feasibility for entrepreneurs, lenders, and investors – not just dairy technology.
Introduction: Profitability Is More Than Just High Sales
Many dairy beverage plants in India report impressive sales volume yet struggle to generate sustainable net profit or service bank loans on time. India’s dairy industry is valued at INR 21,318.5 billion and is projected to grow at a CAGR of 11.73%, which attracts significant investment. But high revenue without healthy contribution will not make the dairy business truly profitable. Dairy beverages are among the most profitable milk products available – but only when planned with financial rigour.
Dairy beverage plant profitability is a function of several factors working together: selling price, variable cost per litre, contribution, fixed cost structure, and actual capacity utilisation. The cost drivers that determine whether a plant earns or bleeds include raw milk procurement, ingredients, packaging, utilities, labor, logistics, processing losses, trade margins, and finance cost. Dairy processing heavily depends on operational efficiency and waste reduction – and every one of these cost elements must be quantified before a single rupee is spent on land or machinery.
Detailed dairy beverage plant break-even analysis must be performed during planning and DPR preparation. The central metric is contribution per litre – the net selling price minus all variable costs – and it is the foundation for evaluating whether a dairy beverage manufacturing plant will cross break-even within a realistic period.
Understanding the Economics of a Dairy Beverage Plant
The P&L structure of a dairy beverage manufacturing business follows a clear logic:
Revenue → minus Variable Costs (milk, ingredients, packaging, variable utilities, freight, trade schemes) → equals Contribution → minus Fixed Operating Costs → equals Operating Profit (EBITDA) → minus Interest & Depreciation → equals Profit Before Tax → minus Tax → equals Net Profit.
Promoters must distinguish between these terms:
- Gross margin: Sales minus cost of goods manufactured
- Contribution margin: Sales minus all variable costs (broader than COGS)
- EBITDA margin: Earnings before interest, tax, depreciation and amortisation
- Operating profit: After all operating expenses
- Profit before tax: After interest and depreciation
- Net profit: After tax
These are not interchangeable. Gross profit margins for dairy beverages range from 30-40%, but EBITDA margins for well-run value-added dairy plants typically settle in the mid-teens (13–18%) once stabilised. For project evaluation, contribution margin and break-even analysis usually provide a clearer picture of viability than projected net profit in year 1.
Revenue Drivers in Dairy Beverage Manufacturing
Revenue is driven not only by consumer demand but by how intelligently capacity, product mix, and channels are planned in the DPR. Key factors include:
- Installed capacity: A fruit-flavored milk drink plant can produce 10-50 million liters annually depending on scale (e.g., 20,000–50,000 litres per day).
- Capacity utilisation: The percentage of installed capacity actually used – often only 40–50% in the first year.
- Operating days: Typically 300–330 days per year after maintenance and holidays.
- Product mix: Flavoured milk, milkshakes, lassi, buttermilk, protein beverages, functional beverages, and UHT vs chilled products each carry different margin profiles.
- Pack sizes: 200 ml, 180 ml, 1 litre, and institutional packs change average realisation significantly.
Channel-wise, general trade, modern retail, e-commerce, HoReCa, institutional contracts, and private-label manufacturing each offer different net realisations and payment cycles. The flavoured milk market in India is expected to grow at a 20.73% CAGR, while the fruit-flavored milk drink market is projected at 7.66% CAGR, making product selection critical.
Revenue projections should use net realisation to the manufacturer – after distributor and retailer margins, trade schemes, and GST – not printed MRP. This is a common mistake in many dairy beverage DPRs. A well-structured dairy beverage revenue model and market strategy covers this in detail.
Major Variable Costs in a Dairy Beverage Plant
Variable costs change directly with litres produced and sold and largely drive dairy beverage production cost per litre. In a typical dairy beverage plant, operating costs are 70-80% raw materials – meaning raw milk, ingredients and packaging together represent the bulk of total variable manufacturing cost. Accurate classification of costs as variable or fixed is essential when performing dairy beverage plant break-even analysis.
Raw Milk Cost: The Most Critical Variable
Raw milk typically constitutes 60% to 70% of total production costs in dairy beverage manufacturing. Milk accounts for 70-80% of operating expenses in dairy plants overall. According to data from India’s Department of Animal Husbandry & Dairying, cow milk procurement price stood at approximately ₹36.70 per litre in 2025-26, rising from ₹29.40/L in 2021-22 – a nearly 25% increase in four years.
Procurement price is linked to fat/SNF content, season, competition for milk from other producers, and distance from dairy farming clusters. Milk procurement costs fluctuate based on seasonal availability and feed costs. On the farm side, high-quality feed improves milk production and cow health, key ingredients like corn and protein drive milk production in cows, and consistent feed quality reduces costs of labor and treatments. Quality feed prevents costly metabolic and reproduction issues, meaning feed quality impacts both production costs and profitability for dairy farmers supplying your plant. Maximizing milking parlor efficiency and capacity on the farm side can increase profitability significantly for producers, which in turn stabilises sourcing for the processing plant.
A practical illustration: for a 30,000 LPD plant operating 320 days, a ₹1 per litre increase in effective raw milk cost adds approximately ₹96 lakh per year to variable cost (illustrative assumption only). Procurement strategy – whether direct from dairy farms, through cooperatives, or through aggregators – is both an operational and financial decision integrated into the dairy beverage plant financial model.
Ingredients, Packaging and Variable Utilities
Besides raw milk, ingredients and packaging often determine whether a value-added dairy beverage becomes a high-contribution SKU or a marginal one.
Ingredient costs include sugar, cocoa, fruit preparations, flavours, stabilisers, protein concentrates, vitamins, whey-based additives, and functional ingredients. Richer formulations increase both the selling price and the cost of production. For example, a premium protein shake with added whey protein will cost significantly more per litre than plain buttermilk, but may also command premium pricing from customers. Every recipe must be costed per litre.
Packaging cost is a high-impact variable. Packaging materials account for a substantial share of total cost of goods sold – in some SKUs, packaging may form 15–35% of variable cost. Components include PET bottles (preform cost ₹3–₹8 depending on size), glass bottles, caps, labels, shrink sleeves, corrugated boxes, and secondary packaging. Aseptic carton packaging used in aseptic dairy beverage processing has different cost structures than chilled formats. Detailed guidance on PET, glass and packaging systems covers material selection for different product categories.
Variable utilities include electricity, steam, refrigeration, chilled water, compressed air, water, cleaning chemicals, and CIP consumables. Dairy processing is highly energy-intensive due to extensive heating and cooling requirements including pasteurization. Some utility expenses contain both fixed and variable components – minimum demand charges are fixed, while consumption-based charges scale with production. The hygienic layout and utility planning of the plant directly influences these operating costs.
Manufacturing Cost Per Litre: Building a Practical Cost Sheet
Promoters should prepare a structured cost-per-litre sheet for each major product – for example, flavoured milk in PET, glass, or UHT carton – rather than relying on rough industry averages. An NDRI study estimated variable manufacturing cost at approximately ₹7.50/L for toned milk, ₹9.76/L for flavoured dairy drink, and ₹6.51/L for lassi, excluding major fixed overheads.
Illustrative cost sheet for flavoured milk (200 ml PET bottle) – assumptions only:
| Component | ₹ per Litre (Approx.) |
|---|---|
| Raw milk (standardised) | 18.00 |
| Sugar, flavour, stabiliser | 3.50 |
| Packaging (PET bottle, cap, label, box) | 6.00 |
| Direct labour | 1.00 |
| Utilities (power, steam, water, CIP) | 1.50 |
| Process losses (2%) | 0.60 |
| Quality control consumables | 0.20 |
| Variable freight (factory to depot) | 1.20 |
| Total Variable Cost | 32.00 |
All figures are illustrative. Actual dairy beverage manufacturing cost per litre varies by formulation, packaging format, plant scale, and procurement conditions.
This per-litre cost estimation is the foundation for contribution, break-even point, and expected profit margin calculations.
Contribution Margin Analysis: Core of Dairy Beverage Plant Profitability
Contribution margin tells us how much each litre contributes toward recovering fixed costs and then generating profit. It is central to dairy beverage plant profitability analysis.
Formulas:
- Contribution per Unit = Net Selling Price per Unit – Variable Cost per Unit
- Total Contribution = Contribution per Unit × Units Sold
- Contribution Margin % = (Contribution per Unit ÷ Net Selling Price per Unit) × 100
Illustrative example (assumptions only – not market quotations):
| Item | ₹ per Litre |
|---|---|
| MRP (consumer price) | 60.00 |
| Less: Distributor/retailer margin, trade schemes | (16.00) |
| Net Realisation to Manufacturer | 44.00 |
| Less: Total Variable Cost (from above) | (32.00) |
| Contribution per Litre | 12.00 |
| Contribution Margin % | 27.3% |
Gross profit margins for fruit-flavored milk drinks range between 30-40% at optimised scales. Even a ₹1 change in contribution per litre can alter annual contribution by several crores for plants processing millions of litres. Promoters should compute contribution separately for each major SKU and arrive at a weighted average contribution based on planned product mix and sales volumes.
Product-Wise Contribution and Product Mix Strategy
Not all dairy beverages have the same contribution margin. Commodity products like standard milk or plain buttermilk offer thin and volatile margins. Dairy processing can improve profit margins through value-added dairy products – flavoured milk, milkshakes, protein drinks, and functional beverages command higher prices but also carry higher ingredient and packaging costs.
A premium 200 ml UHT milkshake may generate ₹14–₹18 contribution per litre but move lower volume, while mass-market buttermilk may contribute only ₹5–₹7 per litre but sell in high volumes with strong seasonal demand. The paneer market is projected to grow at a CAGR of 19.86% from 2025 to 2033 and cheese remains another adjacent dairy development opportunity, though these are distinct product categories.
The concept of weighted average contribution – summing each SKU’s contribution per litre multiplied by its planned volume, then dividing by total litres – gives the plant-level average. Integrated capacity planning and product mix strategy must be finalised before selecting machinery and committing capital for future expansion.
Fixed Costs and Semi-Fixed Overheads of a Dairy Beverage Plant
Fixed operating costs do not change significantly with volume in the short term. High fixed costs mean profitability depends on operating near full capacity. Typical fixed and semi-fixed expenses include:
- Management and key technical salaries, permanent factory staff wages
- Administrative staff, plant security, staff training budget
- Quality control and laboratory overheads – dairy processing requires controlled operations for quality assurance
- Plant maintenance contracts, insurance, licence fees
- Minimum demand charges for electricity and utilities
- Meeting food safety standards requires significant investments in compliance
Depreciation and interest on term loans are treated separately for break-even calculations but remain crucial for net profit and cash flow. A realistic annual fixed-cost budget – based on plant size, automation level, and location – is essential. Underestimating fixed costs in the DPR to show attractive profitability is a common and dangerous mistake.
Break-Even Analysis: Quantity, Sales and Capacity Utilisation
The break-even point is where total contribution equals total fixed operating cost, resulting in zero operating profit.
Formulas:
- Break-Even Quantity (litres) = Fixed Operating Cost ÷ Contribution per Litre
- Break-Even Sales (₹) = Break-Even Quantity × Net Selling Price per Litre
- Break-Even Capacity Utilisation (%) = Break-Even Production ÷ Installed Annual Capacity × 100
Illustrative example (all numbers are assumptions only):
A 30,000 LPD dairy beverage plant operating 300 days has annual installed capacity of 90 lakh litres. If annual fixed operating cost is ₹5.40 crore and contribution per litre is ₹12, then:
- Break-even quantity = ₹5,40,00,000 ÷ ₹12 = 45 lakh litres
- Break-even capacity utilisation = 45 ÷ 90 = 50%
- Break-even sales = 45 lakh × ₹44 = ₹19.80 crore
If actual capacity utilisation stays below 50% in the first year, the plant incurs operating losses even though gross margin appears positive. Lenders, investors, and promoters should compare break-even capacity with realistic sales ramp-up plans in the markets they intend to serve.
Profitability at Different Capacity Utilisation Levels
As capacity utilisation increases, fixed costs are spread over more litres, and operating margin improves sharply – this is operating leverage.
Illustrative table (30,000 LPD plant, ₹12 contribution/L, ₹5.40 Cr fixed cost – assumptions only):
| Utilisation | Volume (Lakh L) | Revenue (₹ Cr) | Variable Cost (₹ Cr) | Contribution (₹ Cr) | Fixed Cost (₹ Cr) | Operating Profit/Loss (₹ Cr) |
|---|---|---|---|---|---|---|
| 40% | 36.0 | 15.84 | 11.52 | 4.32 | 5.40 | (1.08) |
| 50% | 45.0 | 19.80 | 14.40 | 5.40 | 5.40 | 0.00 |
| 60% | 54.0 | 23.76 | 17.28 | 6.48 | 5.40 | 1.08 |
| 70% | 63.0 | 27.72 | 20.16 | 7.56 | 5.40 | 2.16 |
| 80% | 72.0 | 31.68 | 23.04 | 8.64 | 5.40 | 3.24 |
| 90% | 81.0 | 35.64 | 25.92 | 9.72 | 5.40 | 4.32 |
Many new plants underestimate the time needed to move from 40–50% utilisation in the first year to 75–85% in later years. This affects early-year income and loan servicing ability significantly.
Capacity Utilisation: Why It Dominates Dairy Beverage Plant Profitability
Two plants with identical contribution per litre can show very different profitability depending purely on actual capacity utilisation. At low utilisation, each litre carries a heavy fixed cost burden. As production climbs, per-litre fixed cost falls and net profit improves sharply.
Practical issues influencing utilisation include: brand acceptance in target markets, sales and distribution network depth, seasonal demand (summer demand for flavoured milk vs winter demand for warm beverages), production planning, maintenance downtime, labor productivity, and procurement planning from dairy farms and dairy farming cooperatives.
Oversizing the plant creates risk: high capital cost, under-utilised machinery and cold chain assets, and weak return on capital even if the equipment is efficient. Capacity should be aligned with realistic market absorption and the agriculture of the region, not optimistic volume targets. Investments in branding can influence the demand and pricing power of dairy products, supporting better utilisation over time.
Raw Milk Cost Sensitivity: How ₹1 Can Change the Entire P&L
A proper dairy beverage plant profitability analysis must test sensitivity to raw milk price changes. Milk procurement is influenced by season, feed cost, local dairy business competition, and market fluctuations in the broader dairy industry.
Illustrative sensitivity (30,000 LPD, 60% utilisation = 54 lakh litres/year – assumptions only):
| Scenario | Milk Cost Change | Contribution/L | Annual Contribution (₹ Cr) | BE Utilisation |
|---|---|---|---|---|
| Base | – | ₹12.00 | 6.48 | 50% |
| +₹1/L | +₹1 | ₹11.00 | 5.94 | 55% |
| +₹2/L | +₹2 | ₹10.00 | 5.40 | 60% |
| –₹1/L | –₹1 | ₹13.00 | 7.02 | 46% |
Higher milk cost raises break-even capacity utilisation – the plant must sell more litres to cover the same fixed costs. Milk procurement strategy, including long-term contracts and regional sourcing diversification from multiple dairy farms, is a critical financial decision.
Packaging Cost Sensitivity and Optimisation
Packaging is a high-impact cost item in dairy beverage variable cost structure. Even a ₹0.50–₹1 per bottle change – through design change, specification optimisation, or vendor negotiation – can change annual profitability significantly.
For example, a plant producing 20 million packs per year: a ₹0.75 per pack saving translates to ₹1.50 crore annual cost reduction (hypothetical illustration). Optimisation involves right-sizing bottles, labels, and secondary packaging while balancing aesthetics, food safety, and logistics efficiency. The space taken by packaging in transportation also affects landed cost per unit.
Selling Price and Net Realisation Sensitivity
A ₹2 increase in MRP does not automatically translate into ₹2 additional realisation for the manufacturer. Distributor margins, retailer margins, trade schemes, and promotional expenses absorb part of the increase. A ₹2 MRP increase may yield only ₹1.00–₹1.20 in additional manufacturer realisation.
Sensitivity analysis should adjust net realisation in steps of ±₹1–₹2 per litre and recalculate contribution and EBITDA margin. Pricing decisions must align with brand positioning, competitive landscape, and consumer expectations so that volume is not adversely affected. Investments in branding influence price realisation for the company.
Effect of Plant Automation and Processing Efficiency on Profitability
Higher automation in a dairy beverage manufacturing plant typically reduces labor cost per litre, improves consistency, and reduces losses. Automation and lean manufacturing principles can enhance operational efficiency, and energy-efficient machinery can reduce operational overhead and payback period.
However, automation increases upfront capital expenditure. The financially optimal level depends on plant size, product range, expected capacity utilisation over the first 5–7 years, and budget constraints. Efficient labor management enhances operational efficiency in the processing space, and higher yields raise output per unit of input and boost margins. Understanding dairy beverage plant machinery and equipment cost is essential before deciding on automation levels.
Managing yield and minimizing waste is vital: milk handling losses, line changeovers, filling spills, CIP losses, off-spec batches, and start-up wastage all erode effective yield. Minimizing spoilage and product loss during processing directly safeguards profitability – even a 1–2% loss at industrial volumes is significant in absolute terms.
Cold Chain Cost, Shelf Life and Market Radius
Chilled dairy beverages require cold rooms, refrigerated vehicles, distributor chillers, and strict temperature control. Cold chain reliability affects the landed cost and service levels of dairy products, and dairy beverages require unbroken cold-chain logistics to prevent spoilage. The expenses spent on cold chain infrastructure and transportation are substantial.
Limited shelf life constrains the market radius, increases expiry risk, and demands more accurate demand forecasting. In contrast, longer shelf life through UHT processing can enable broader markets but may add packaging costs. Ambient-stable beverages allow wider distribution and potentially better utilisation. Detailed cold storage and cold chain requirements should be integrated into the dairy beverage plant financial analysis.
Project Cost, Capital Structure and Investment Returns
Profitability at the EBITDA level does not tell whether the plant is a good investment – capital cost and financing structure matter equally.
Major project cost components include: land and site development, civil construction, processing plant and machinery, bottling and packaging lines, utilities (boiler, chiller, compressor, transformers), refrigeration, laboratory and quality control equipment, vehicles, pre-operative expenses, contingencies, and working-capital margin.
Two plants with similar EBITDA can generate very different Return on Capital Employed (ROCE) and project IRR if their investment or debt-equity mix differs. A detailed understanding of dairy beverage plant project cost and means of finance and overall setup cost in India is essential for every promoter.
Break-Even vs Cash Break-Even and Debt Servicing Ability
Accounting break-even (operating profit = zero) differs from cash break-even (cash profits sufficient to cover interest and principal repayment). Depreciation affects accounting profit but not immediate cash flow, whereas interest and principal repayment are real cash outflows.
For lenders, DSCR (Debt Service Coverage Ratio) across conservative, base, and optimistic scenarios matters more than a single net profit projection. A plant can be above accounting break-even and still face cash flow stress if principal repayments are front-loaded or working-capital requirements are higher than expected during the initial period.
Working Capital Cycle and Its Impact on Profitability
Working capital is essential to cover procurement, processing, and distribution cycles. Key working-capital items include:
- Raw milk procurement payments (often weekly/fortnightly to farmers)
- Packaging inventory and ingredient stocks
- Finished goods inventory (especially longer shelf life UHT products)
- Distributor and modern-trade receivables (30–60 day payment cycles)
- Statutory dues
Longer credit periods to institutional customers increase receivables and interest cost on working capital, reducing net profit even when operating margins look healthy. Many otherwise profitable dairy beverage businesses in India struggle or fail due to weak working-capital planning rather than poor gross margins.
Key Profitability and Viability Ratios to Monitor
Building a profitability dashboard helps track key performance indicators. Core metrics for a dairy beverage plant promoter, investor, or banker:
- Contribution metrics: Contribution per litre, contribution margin %, gross margin
- Operating metrics: EBITDA margin, operating margin, break-even sales, break-even capacity utilisation
- Capital metrics: ROCE, project IRR, equity IRR, DSCR, fixed-cost coverage ratio
- Liquidity metrics: Inventory days, receivable days, payable days, working-capital cycle
Any serious dairy beverage plant project report or CMA Data prepared for bank finance should present these ratios under different capacity utilisation scenarios and compare them periodically against actual performance.
Scenario and Sensitivity Analysis in DPR
Sensitivity and scenario planning can identify drivers of profitability in dairy processing. Three standard scenarios should be tested:
- Conservative: Lower utilisation (50–55%), higher raw milk cost (+₹2/L), slightly lower net realisation
- Base: Realistic utilisation (65–70%), normal cost and price assumptions
- Optimistic: Higher utilisation (80–85%), better product mix, improved contribution per litre
For each scenario, the DPR should show projected sales, contribution, EBITDA, break-even capacity, net profit, and DSCR across at least 5–7 years. Lenders typically give more weight to conservative scenarios, especially where large debt is involved. Scenario analysis helps promoters understand how sensitive their project is to factors they cannot fully control.
Common Reasons Dairy Beverage Plants Fail to Achieve Expected Profitability
From practical experience across dairy science and project finance, the most common failure points include:
- Overestimation of early-year sales volume and unrealistic selling prices
- Underestimation of distributor and retailer margins, leading to inflated net realisation assumptions
- Low and fluctuating capacity utilisation due to delayed market penetration
- Poor milk procurement planning and excessive dependence on spot-market pricing
- Excessive packaging cost without adequate vendor negotiation
- High product rejection, spoilage, or returns from weak cold-chain management
- Inadequate working capital, over-dependence on debt, and high interest burden
- Oversized plants relative to the market a company can realistically serve
- Weak product mix with insufficient focus on contribution per litre
- Absence of proper sensitivity analysis and scenario planning during DPR preparation
Most of these issues can be reduced with a realistic dairy beverage plant project report and break-even analysis before committing to major investment.
How a Detailed Project Report (DPR) and Financial Model Help
A professionally prepared DPR integrates technical configuration, capacity planning, product mix, capital expenditure, operating costs, pricing, utilisation ramp-up, working capital, and financing structure into a coherent financial model. It should cover demand assessment, revenue modelling, SKU-wise contribution, break-even calculation, profitability projections, cash flow, DSCR, project IRR, and sensitivity analysis on milk cost, packaging cost, price, and utilisation.
CA Manish Gugliya, as a Chartered Accountant working on project finance, DPRs, and CMA Data, assists dairy entrepreneurs and MSME manufacturers in converting their concept into bankable financial projections aligned with lender expectations. While no DPR can guarantee profitability, a robust financial model significantly improves decision quality, allows realistic negotiation with banks, and reduces the risk of setting up an unviable plant. Treat DPR preparation as an investment, not a compliance formality.
Practical CA Perspective: Questions Every Promoter Should Ask
Rather than asking only “Is dairy beverage manufacturing a profitable business?”, promoters should focus on more precise questions:
- What contribution will each major SKU generate after accounting for all variable costs?
- At what capacity utilisation will the plant cross operating break-even?
- How sensitive is this project to a ₹2/L increase in raw milk cost or a ₹1/bottle increase in packaging cost?
- Can the planned market in India realistically absorb the proposed annual capacity within 3–5 years?
- Is the proposed packaging commercially viable for the target price point and customers?
- Can the project service term-loan instalments even if utilisation remains at 55–60% in the first two years?
- How much working capital will the business require at 70–80% utilisation?
- What happens if sales ramp-up is slower than expected?
Long term profitability of the dairy beverage business depends on honest answers to these questions during planning, not after the plant is commissioned. ProjectReportBank.com supports entrepreneurs with project reports, financial projections, CMA Data, and feasibility analysis tailored to different dairy beverage plant scales and geographies across India.
Conclusion: When Does a Dairy Beverage Plant Become Truly Profitable?
Dairy beverage plant profitability in India depends on four pillars: sustainable milk procurement from dairy farmers and dairy farming networks, a commercially sensible product mix, controlled packaging and operating costs, and achieving adequate capacity utilisation over time. Break-even analysis, contribution-per-litre calculation, and structured scenario analysis should be completed at the planning stage – before banks sanction loans and construction begins.
There is no universal “profit percentage” for dairy beverage manufacturing. Each project must be evaluated through a plant-specific financial model. With disciplined planning and execution, a dairy beverage manufacturing plant can become a robust, profitable business that adds value across the entire value chain – from agriculture and farm-level milk production to the consumers who buy the finished product.
Businesses, dairy companies, and investors who require a Dairy Beverage Plant Project Report, DPR, financial projections, CMA Data, feasibility study, or bank-finance documentation can engage CA Manish Gugliya and the team at www.projectreportbank.com for detailed, customised analysis.
Frequently Asked Questions (FAQ)
The following questions address practical aspects of dairy beverage plant profitability and break-even that may not have been fully covered above.
What is a reasonable profit margin for a dairy beverage plant in India?
Realistic dairy beverage plant profit margins vary widely depending on product mix, scale, milk cost, and packaging. Many well-managed plants target EBITDA margins in the range of 12–18% once they stabilise utilisation. Dairy plants can achieve 30-40% gross profit margins at the gross level, but net margins are significantly lower after fixed costs, depreciation, and interest. Start-up years often show weaker margins due to ramp-up costs, introductory trade schemes, and under-utilisation. Plant-level economics should be assessed over a 5–7 year horizon using a project-specific financial model, not generic industry averages.
At what utilisation should I plan to reach break-even for a new dairy beverage plant?
In many Indian projects, break-even capacity utilisation falls between 45% and 65% of installed capacity, depending on contribution per litre and the fixed cost structure. Highly automated, high-capex plants often have higher break-even utilisation. The DPR should calculate the specific break-even utilisation for the proposed configuration, and promoters should plan sales and distribution strategy to cross this level within 2–3 years. Break-even for dairy beverage manufacturing typically ranges from 3 to 6 years in terms of full capital payback.
How does private-label manufacturing affect plant profitability?
Private-label contracts for retailers or other brands typically offer lower net realisation per litre but provide stable volumes, better capacity utilisation, and lower marketing cost. Promoters should calculate contribution per litre for private-label SKUs separately and ensure that even at a lower price, the contribution remains positive. Private-label volumes can strategically support capacity utilisation while the company builds its own brand for higher-margin products over time.
Can a small-scale dairy beverage plant be financially viable?
Both small and large plants can be viable, but the economics differ. Large plants benefit from economies of scale, while smaller plants can focus on niche markets, local distribution, and controlled overheads. For small plants, controlling fixed costs, selecting the right product mix, and leveraging local dairy farming networks are crucial for profitability. Small and medium promoters should prepare a scale-appropriate DPR rather than replicate the assumptions of large corporate plants.
How frequently should a running dairy beverage plant review its break-even and profitability model?
Operating plants should revisit their cost structure, contribution, and break-even analysis at least annually – and more frequently when there are major changes in milk prices, packaging costs, product mix, or financing terms. Updated assumptions should be compared with original DPR projections to identify deviations early. Regular financial reviews enable timely corrective actions in pricing, procurement, cost control, and capital planning, supporting long term profitability and sustainable growth of the dairy business.