
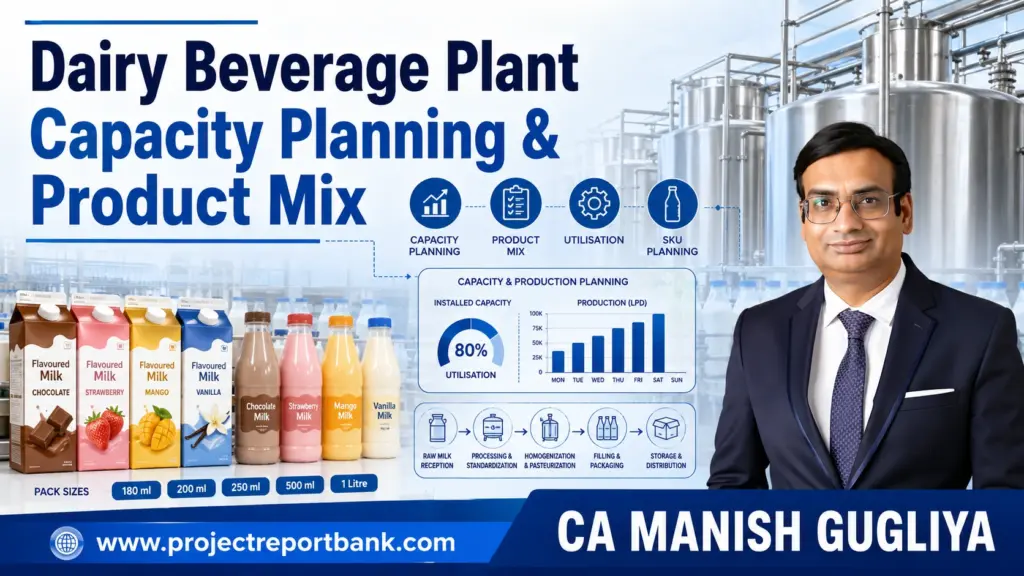
Key Takeaways
Dairy beverage plant capacity planning is a strategic decision, not a machinery purchase. As a practising Chartered Accountant who prepares Detailed Project Reports for manufacturing projects, I see promoters routinely make two opposite errors: installing excessive capacity based on optimistic demand forecasts, or installing too little and facing expensive expansion bottlenecks within two years. A well-estimated capacity prevents costly overbuilding of dairy plants while preserving room for growth.
Rated machinery capacity, production capacity per hour, and plant capacity utilisation are different concepts. Saleable output is always lower than the theoretical maximum because of changeovers, cleaning in place cycles, downtime, and SKU complexity. Dairy products have a short shelf life, requiring precise planning at every stage.
- Align plant capacity with validated market demand, not promoter ambition alone
- Define capacity at both processing and filling line levels; the slowest stage sets throughput
- Start with fewer SKUs and pack sizes to stabilise utilisation before expanding
- Assume phased capacity utilisation in your DPR: new plants rarely achieve full output in Year 1
- The right dairy beverage plant product mix (flavoured milk, chocolate milk, milkshakes, protein drinks, RTD beverages) directly impacts project cost, working capital, profitability, and bankability
Entrepreneurs can practically decide what capacity plant to set up by starting from target annual sales in litres, converting to daily and hourly requirements, and then checking feasibility against available processing and filling line options. I assist promoters across India in structuring these decisions through www.projectreportbank.com.
Understanding Dairy Beverage Plant Capacity
Plant capacity can be expressed in litres per hour, litres per batch, litres per day, litres per annum, bottles per minute, bottles per hour, or packs per hour. A DPR must specify which basis is used. You need to define required capacity types including raw material capacity and processing capacity separately.
Processing line capacity (LPH or LPD) and filling line capacity (bottles/hour or packs/hour) must be assessed independently. The slowest stage defines effective throughput. Capacity estimation determines the maximum milk volume a plant can process, but annual production capacity shown in project documents should reflect effective and saleable output, not brochure-rated machine numbers.
| Capacity Type | Meaning | DPR Relevance |
|---|---|---|
| Installed Capacity | Maximum theoretical output based on equipment | Upper bound; never fully achieved |
| Rated Capacity | Vendor-specified output under ideal conditions | Baseline for equipment comparison |
| Effective Capacity | Output after CIP, changeovers, maintenance | Basis for realistic production planning |
| Saleable Production Capacity | Quantity that can be manufactured, packed, and sold | Drives revenue and financial projections |
Factors That Determine the Right Plant Capacity
Optimal dairy beverage plant capacity selection starts from realistic market absorption and milk availability. Effective capacity planning balances raw material availability, processing equipment, and market demand. Dairy products have a limited shelf life, affecting production planning at every level.
Key factors include target market size (local, regional, national), expected sales volume by product category, institutional versus retail mix, geographic distribution radius, competition intensity, and cold-chain requirements. Dairy production must comply with strict food safety regulations, and regulatory compliance requires adherence to food safety standards including FSSAI in India. Production capacity for a dairy beverage facility requires balancing market demand and dairy supply chain logistics. Supply-side constraints, seasonal fluctuations in milk, packaging material lead times, labour availability, and production losses all reduce theoretical daily output. Credit limits and working capital availability also cap practical output, since higher capacity means more inventory and receivables to finance. Financial and spatial scalability evaluates capital expenditure constraints and footprint limitations before finalising capacity decisions.
Capacity Planning Based on Market Demand
Market-back analysis involves forecasting real consumer demand over a 3 to 5-year horizon. Demand forecasting analyzes historical sales data and market trends to project product volume requirements. Market demand forecasting considers current and projected sales volumes segmented by product type.
The conversion framework is straightforward:
Annual sales requirement (litres) ÷ effective production days = required litres per day Litres per day ÷ productive hours per day = indicative litres per hour
Peak load capacity sizing ensures the plant can manage seasonal sales spikes without bottlenecks. Plan a reasonable buffer above base demand; the size depends on risk appetite, market depth, and future expansion plans. For multiple SKUs and pack sizes, translate annual volumes into an average production capacity per hour while allowing realistic changeover and quality-check windows.
Product Mix Planning for a Dairy Beverage Plant
Product portfolio analysis involves determining the variety of product formulations and processing technology needed. Dairy manufacturers produce many product types with unique requirements. The plant’s product line, whether flavoured milk, chocolate milk, milkshakes, lassi-based drinks, or protein beverages, influences line design and economics as much as total capacity.
A new plant can follow different strategies: a single flagship product (simpler operations, higher market risk), a limited multi-SKU portfolio (balanced complexity), or a diversified category mix (better risk spread but complex production planning and higher raw material inventory).
| Product Category | Volume Role | Margin Potential | Production Complexity | Capacity Consideration |
|---|---|---|---|---|
| Flavoured Milk | High | Moderate | Low | Base utilisation driver |
| Chocolate Milk | Medium-High | Moderate-High | Medium (cocoa, viscosity) | Slower homogenisation |
| Milkshakes | Medium | High | High (viscosity, fat content) | Reduced filling speed |
| Protein/Functional | Low-Medium | High | High (fortification, QA) | Small batches, more changeovers |
| Aseptic RTD | Medium | Moderate-High | Medium-High | Requires aseptic filling |
Product mix strategy should align with target customers, distribution channels, available technology (pasteurised vs UHT), and access to specialised ingredients.
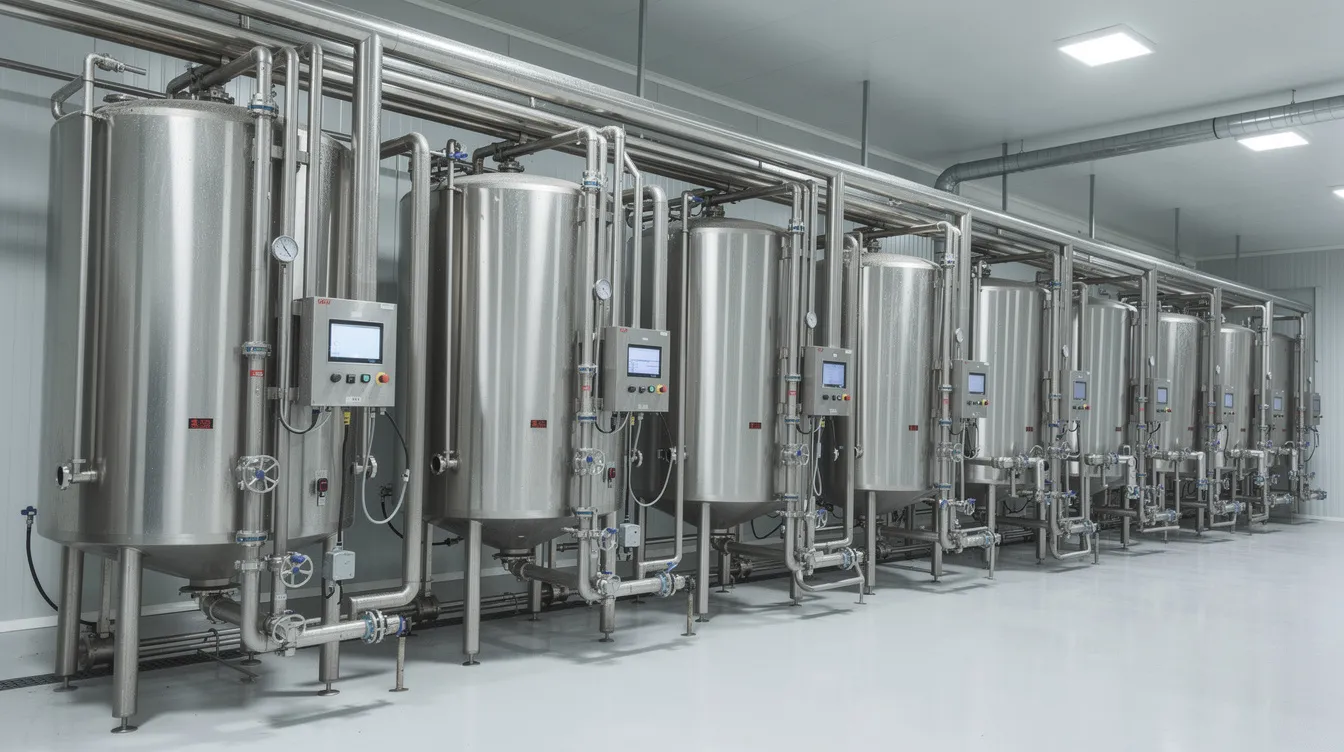
SKU Planning: Why More Products Do Not Always Mean More Sales
An SKU for dairy beverages is defined by product type × flavour × pack size × packaging format. If a plant plans 3 base products, 4 flavours each, 3 pack sizes, and 2 packaging formats, that creates 72 distinct SKUs. Product mix analysis determines the specific breakdown of SKUs such as fresh milk, yogurt drinks, or flavoured beverages. Managing hundreds of SKUs increases planning complexity in dairy operations.
Dairy manufacturers often produce multiple product variants, increasing complexity. Excessive SKU proliferation leads to more frequent changeovers, higher packaging inventory, more finished products in cold storage, greater working capital per unit of sale, and lower effective line utilisation. For a new plant, start with fewer high-volume SKUs that stabilise capacity utilisation and generate reliable data before selectively adding incremental SKUs.
Selecting the Right Product Mix
Categorise products into four groups for structured planning:
- Volume Products (mainstream flavoured milk in 180-200 ml packs): keep capacity utilisation high and absorb fixed overheads, even at lower contribution per litre
- Margin Products (premium milkshakes, indulgent chocolate milk): higher realisation, balanced against formulation complexity and taste differentiation
- Growth Products (protein beverages, fortified drinks): small initial batches using spare capacity while building brand presence among health-focused customers
- Seasonal Products (summer-centric beverages, festival specials): fill capacity during specific periods but must not create SKU overload in off-season
A balanced mix across these categories reduces dependence on one product category and improves factory utilisation through the year.
Flavoured Milk as Part of the Product Mix
Flavoured milk is a mainstream, lower-risk category often used as the base for production planning in India. It can be produced in pasteurised chilled form or as UHT/aseptic variants, each influencing plant design and packaging line choice. Within the SKU mix, flavoured milk sits as a volume product supporting other premium and growth SKUs by ensuring base utilisation of processing and filling lines. Promoters seeking detailed process, machinery, and cost guidance can refer to the Flavoured Milk Manufacturing Plant Project Report. Focus on a few core flavours and widely accepted pack sizes before expansion.
Chocolate Milk Capacity Considerations
Chocolate milk introduces additional formulation steps: cocoa dispersion, higher viscosity, and increased sedimentation risk. These factors require different holding times, more robust homogenisation, and potentially slower heat-treatment throughput than plain flavoured milk, influencing total processing capacity. The same filling machine may handle both products, but line speed adjustments for foaming and viscosity reduce effective bottling line capacity. At project design stage, planners should model whether chocolate milk runs on the same line or on dedicated shifts, and estimate its impact on changeover time. For process flow and cost guidance, see the Chocolate Milk Manufacturing Plant Project Report.
Milkshake Manufacturing and Capacity Planning
Milkshakes typically have higher viscosity due to added solids, affecting pumping, heat transfer, and permissible line speeds. Thicker products reduce pasteuriser or UHT system throughput (litres per hour) and may require slower filling to maintain accuracy. Chilled milkshakes need more stringent refrigerated storage and distribution than ambient dairy beverages. Start milkshake manufacturing in fewer flavours and moderate batch sizes to avoid high wastage while validating demand. Detailed feasibility guidance is available in the Milkshake Manufacturing Plant Project Report.
Protein and Functional Dairy Beverage Product Mix
Protein and functional dairy beverages are premium, high-margin categories with distinct capacity implications. Batch sizes may intentionally be smaller due to niche demand and expensive ingredients, increasing changeover frequency. Protein fortification, vitamins, and minerals affect homogenisation, heat treatment, and QA requirements, which can slow processing and increase per-litre cost. These SKUs should leverage spare capacity without destabilising high-volume production schedules. For detailed feasibility analysis, see the Protein & Functional Dairy Beverages Manufacturing Plant Project Report.
Ready-to-Drink Dairy Beverage Portfolio
RTD dairy beverages span flavoured milk, coffee-milk drinks, chilled lassi-based beverages, and functional variants. Each sub-category can share parts of the processing line but often requires differentiated packaging (PET, glass, or aseptic cartons). A well-planned RTD portfolio can smoothen plant utilisation across seasons. Promoters should assess whether their portfolio will be predominantly chilled distribution (shorter shelf life) or aseptic/ambient (wider reach). The Ready-to-Drink Dairy Beverages Manufacturing Plant Project Report covers RTD capacity and economics in detail.
Pack-Size Planning and Its Impact on Capacity
Pack size planning affects filling capacity more than most promoters expect. Filling 1,000 litres into 200 ml bottles means 5,000 individual units; filling the same volume into 1 litre packs means only 1,000 units. This multiplies capping, labelling, and secondary packaging operations per batch.
| Pack Size | Packs per 1,000 Litres | Filling Implication | Suitable Market |
|---|---|---|---|
| 150-200 ml | 5,000-6,667 | High-speed filler required | Retail impulse, schools |
| 500 ml | 2,000 | Moderate speed | Convenience, modern trade |
| 1 litre | 1,000 | Standard speed | Family consumption |
| 5 litre | 200 | Low unit count | Institutional, HORECA |
Focus on 1-2 key pack sizes initially. Plan expansion into niche sizes once the base plant runs at stable utilisation and distribution has matured. Consider label designs, carton sizes, and pallet configurations to avoid hidden logistics costs.
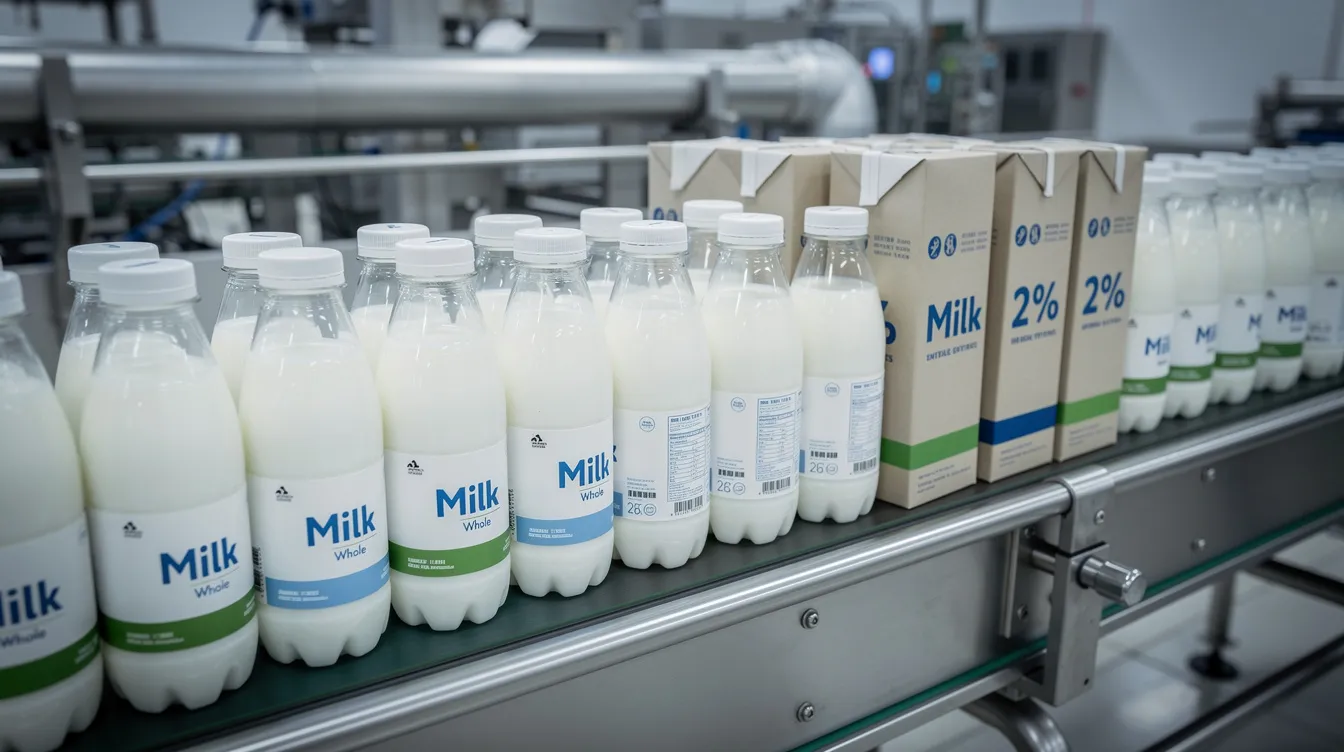
PET, Glass and Other Packaging Formats
PET lines typically produce at higher bottles-per-hour capacity with lower weight and breakage risk than glass. Glass bottles offer premium perception but slower line speeds and higher logistics cost. Aseptic carton packaging allows ambient distribution and longer shelf life but requires capital-intensive aseptic filling equipment. PET is lighter for long-distance distribution; cartons optimise storage but may have larger minimum order quantities from suppliers. The Dairy Beverage Bottling Plant: PET, Glass & Packaging Systems article provides detailed guidance on packaging machinery selection and cost.
Aseptic Packaging and Long Shelf-Life Capacity Planning
Aseptic UHT processing transforms capacity planning by allowing shelf life of 90-180 days and pan-India distribution with minimal cold chain. Processing line capacity (UHT systems, sterile holding tanks) must align precisely with aseptic filling capacity to avoid contamination risk. The investment is higher, QA more sophisticated, and CIP regimes stricter, requiring strong demand forecasts. Aseptic products can be batched in larger runs with fewer changeovers, improving effective utilisation. The Aseptic Dairy Beverage Processing & Packaging Plant resource covers design and feasibility for such projects.
Processing Capacity vs Filling Capacity
Bottleneck-based capacity planning focuses on the slowest step in the production process. In many Indian dairy plants, the filling and packaging line is the bottleneck, not the pasteuriser or UHT unit. Potential bottleneck points include blending, homogenisation, pasteurisation, holding tanks, filling machines, capping, labelling, secondary packaging, chilling tunnels, and cold storage loading.
Line balancing means sizing each major piece of equipment so throughput is reasonably matched and no stage operates at chronic under-utilisation while another is overloaded. Map rated capacities of each machine, overlay planned shift hours, utilisation factors, and changeover times to determine effective output. Downstream logistics capacity (warehouse docks, dispatch vehicles) is part of true bottleneck analysis.
Manufacturing Process and Capacity Interdependence
A typical dairy beverage process runs from raw milk reception through standardisation, mixing, homogenisation, heat treatment, cooling, filling, and packaging. Batch size, heating and cooling process time, and QA sampling all influence how many batches can realistically be processed in a shift. Cleaning and sanitisation between different products (especially allergen or flavour changes) consume available production hours.
Dairy ERP systems optimize production scheduling based on real-time data and reduce waste by aligning production with actual demand. ERP systems enhance traceability from raw milk to finished products, and real-time visibility helps identify production issues early. Promoters should prepare a process-flow and time-cycle diagram for each major product. The Dairy Beverage Manufacturing Process & Production Line article provides detailed process-flow understanding.
Homogenisation and Heat-Treatment Capacity
Homogenisers and heat-treatment systems are central to product quality, mouthfeel, and microbial safety. Their throughput (litres per hour) must match or slightly exceed planned filling-line capacity to avoid upstream queues. Different formulations (high-fat milkshakes, cocoa-rich chocolate milk, protein-enriched drinks) affect pressure requirements and potential fouling, reducing effective capacity versus rated capacity. Cleaning cycles and heat-up/cool-down times must be considered in daily scheduling. The Homogenization & Heat Treatment for Dairy Beverages article offers technical sizing guidance.
Machinery Capacity Selection and Line Configuration
Dairy beverage plant machinery capacity should be selected as a balanced system. Buying one system with very large processing capacity that the filling line cannot support wastes capital. Main equipment groups requiring coordination: storage tanks, mixing tanks, homogenisers, pasteurisers/UHT, chillers, fillers, cappers, labellers, CIP systems, and boilers. Line configuration choices (single high-speed line vs two medium-speed lines) affect flexibility and scalability. The Dairy Beverage Plant Machinery & Equipment Cost article helps promoters compare investment ranges.
Calculating Effective Production Capacity
Effective annual capacity ≈ Rated hourly production × productive hours per shift × shifts per day × production days per year × operating efficiency factor
Effective capacity considers downtime for cleaning and product changeovers. Productive hours exclude breaks and routine maintenance. The efficiency factor is often below 0.80 for new plants.
Hypothetical example (labelled as illustrative): A 3,000 litres/hour line running 8-hour shifts, 2 shifts/day, 300 production days/year at 70% efficiency yields approximately 3,000 × 8 × 2 × 300 × 0.70 = 10,080,000 litres/year. Different SKUs (viscous milkshakes vs light flavoured milk) run at different speeds on the same existing line, so product mix assumptions must be embedded into this calculation.
Capacity Utilisation Assumptions in a DPR
New dairy beverage projects rarely start at full utilisation. Commissioning challenges, QA stabilisation, and distribution build-up reduce plant utilisation rate in early years. Indian dairy plants typically achieve around 70-74% utilisation at maturity. A realistic ramp-up might look like Year 1 at 40-55%, Year 2 at 60-75%, and Year 3 onward at 70-85%, supported by marketing plans, distribution contracts, and milk procurement arrangements. Overly aggressive utilisation assumptions inflate projected sales, EBITDA, and IRR, leading to bank scepticism. Stress-test assumptions under conservative, base, and optimistic scenarios.
Single Shift vs Double Shift vs Three-Shift Operation
Operational shifts and facility constraints impact planned downtime for maintenance and sanitation.
| Operating Model | Production Availability | Advantages | Limitations |
|---|---|---|---|
| Single Shift (8 hrs) | ~2,400 hrs/year | Lower complexity; ample maintenance windows | Under-utilises capital investment |
| Double Shift (16 hrs) | ~4,800 hrs/year | Better asset utilisation; moderate labour | Tighter maintenance scheduling |
| Three Shift (22-24 hrs) | ~6,600-7,200 hrs/year | Maximum output from installed equipment | High stress on equipment, labour, management |
Three-shift operations must still build in windows for CIP, preventive maintenance, and sanitation. Align shift strategy with labour availability, local power tariffs, and logistics schedules.
Product Changeover and Capacity Loss
Operational constraints account for planned maintenance and changeover times between product batches. Changing flavours, formulations, or pack sizes requires line stoppage, CIP cycles, machine adjustments, and quality checks. Each additional SKU adds non-productive hours weekly.
Strategies to minimise losses: group SKUs by base product, sequence light to dark flavours, plan longer runs of high-volume SKUs, and limit low-volume SKUs to specific production days. Frequent short runs increase labour and utility cost per litre and may render seemingly attractive SKUs unprofitable.
Role of CIP in Capacity Planning
Cleaning-in-place cycles require daily downtime for sanitation and sterilisation. A typical sequence includes pre-rinse, caustic wash, intermediate rinse, acid wash, final rinse, and sanitisation. Dairy beverages require compliance with sanitation schedules and traceability requirements.
CIP is triggered daily at end-of-shift, on product-type changes, and after maximum run-times. Having one central CIP system versus multiple smaller sets affects total plant uptime. In project reports, deduct realistic CIP allowances (in hours per day) from productive hours rather than assuming uninterrupted running.
Capacity Planning for Seasonal Demand
Milk supply varies seasonally, affecting production planning. Flush seasons see high milk supply; lean seasons see low supply, with seasonal feed availability impacting milk production volumes. Seasonal variations complicate dairy production scheduling, and dairy plants must accommodate peak supply during flush seasons. During lean season, raw milk supply can drop 15-30% in many milksheds.
Capacity must accommodate seasonal variations in milk production. Seasonal flush peaks dictate planning raw milk intake capacity around seasonal supply spikes. For longer shelf-life products (aseptic beverages), production during flush season builds inventory for lean months, enabling better annual production capacity utilisation. Use historical data or pilot research to model demand scenarios before freezing installed capacity.
Raw Milk Procurement and Capacity Alignment
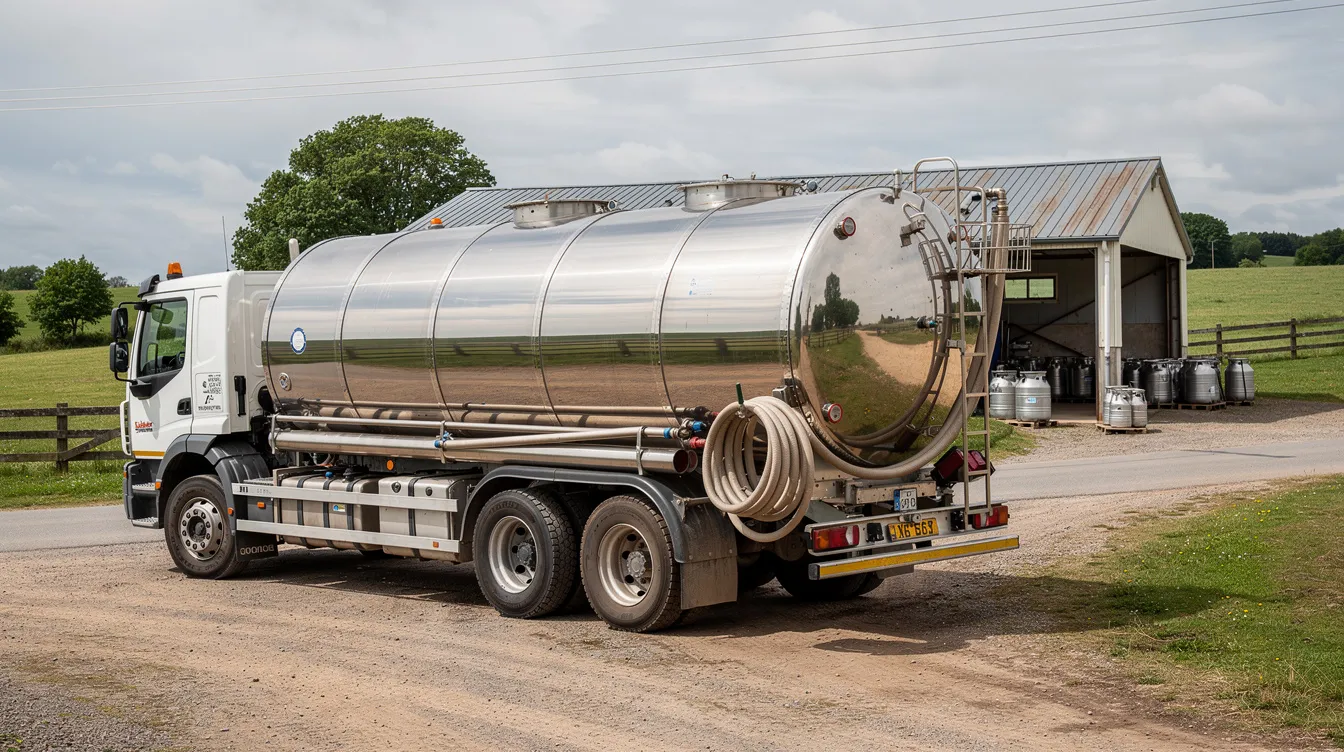
No matter how well designed, dairy beverage manufacturing capacity cannot be realised without reliable raw milk supply. Raw milk must be processed quickly due to its perishability. Raw milk supply assessment involves analyzing proximity and reliability of local dairy farms. Plants should be located within 50-100 kilometres of milk suppliers. Quality variations in milk affect product suitability and yield.
Capacity estimation balances raw milk availability with market demand. During flush season, surplus milk may be available; during lean months, available supply tightens. Dairy production must adapt to variable milk supply and demand. Higher plant capacity means larger daily raw milk requirements, requiring investments in procurement logistics, bulk coolers, and testing labs. Base capacity planning on conservative estimates of procurement growth over 5-7 years. When supply falls short, milk powder supplementation may bridge gaps but at higher cost.
Utilities and Capacity Planning
Utilities (steam, electricity, chilled water, refrigeration, compressed air, process water, effluent treatment) are often invisible constraints. Higher litres per hour means more steam for heating, more refrigeration load for cooling, and more compressor capacity. Inadequate refrigeration and chilled water capacity can reduce line speeds or force downtimes. ETP capacity and CIP solution handling must be adequate for the volume of cleaning operations. Utility designers and process designers should collaborate early for scalable dairy beverage plant design.
Storage and Cold-Chain Capacity
Effective production capacity is meaningless without adequate storage for raw materials, packaging, and finished goods. Key elements include raw milk silos, ingredient storage, packaging warehouses, intermediate storage tanks, finished-goods cold rooms, and dispatch staging areas. Cold-room capacity, pallet positions, and truck turnaround time determine how much product can be dispatched daily. Plan refrigerated transport (own fleet vs hired) so chilled dairy beverages reach market within shelf life constraints. If future expansion is planned, warehouse and cold-room expansion must be designed into the site layout.
Dairy Beverage Plant Setup Cost and Capacity
Dairy beverage plant capacity and investment are related, but not linearly. Economies of scale, shared utilities, and fixed civil overheads mean larger plants achieve lower cost per litre of installed capacity. Choices like pasteurised vs UHT, PET vs glass vs aseptic cartons, and automation level can change Dairy-Based Beverage Manufacturing Plant Setup Cost in India for the same nominal capacity. Land, cold-chain investments, laboratory infrastructure, and pre-operative expenses must all be captured in the DPR; small underestimates distort IRR and DSCR.
Capacity vs Capital Investment
Selecting equipment purely on lowest purchase price often leads to higher lifecycle cost. Evaluate cost per litre of effective capacity after factoring utilisation, changeover time, energy consumption, and maintenance. Key factors: automation level, vendor reputation, local service availability, and ability to integrate with future lines. Higher-speed filling lines reduce labour cost per unit and may justify higher upfront machinery cost over a 7-10 year horizon. Request multiple configurations from suppliers and compare NPV, payback, and DSCR for each.
Capacity Planning and Working Capital
Higher installed capacity generally requires more working capital. Major components: raw material stock (milk, powder, sugar, flavours, stabilisers), packaging inventory (bottles, cartons, caps, labels), finished goods in cold storage, and trade receivables from distributors. Dairy ERP systems manage inventory using First-Expire, First-Out logic to reduce spoilage and write-offs. SKU complexity and long lead-time packaging increase average inventory days. Term loan lenders examine projected inventory and receivables to ensure capacity assumptions are supported by adequate working-capital funding. Run cash-flow projections under multiple utilisation scenarios.
Product Mix and Profitability
The most profitable dairy beverage SKU is not always the highest-volume one. Contribution per litre equals net selling price minus variable costs (milk, ingredients, utilities, direct labour, packaging, distribution). High-volume, low-margin SKUs (mass-market flavoured milk) and lower-volume, high-margin SKUs (protein drinks) occupy different positions. Model scenarios shifting 10-15% of planned volume into higher-contribution SKUs to see the impact on profitability, break-even, and DSCR. Misaligned product mix can make even a technically efficient plant financially weak.
Product Mix and Break-Even Capacity
Break-even analysis should use a realistic weighted average contribution reflecting the planned SKU mix, not a single uniform price per litre. A higher share of premium SKUs increases average contribution and reduces break-even volume. Calculate break-even in litres and in equivalent bottleneck hours. Bankers want to know at what utilisation level and product mix the project generates sufficient cash to service term loans. Update product mix and break-even analysis after the first 12-18 months using actual sales data.
Capacity Planning and Financial Projections
Capacity planning feeds directly into financial projections: annual sales volume, revenue, raw-material cost, factory overheads, EBITDA, working capital, and cash flow are all functions of capacity and utilisation. Errors in capacity or utilisation assumptions (ignoring CIP downtime, overestimating speed on viscous products) inflate sales projections and distort IRR. Build detailed production schedules in the DPR, month-wise, respecting plant constraints and seasonality. As a practising Chartered Accountant, I align technical capacity assumptions with conservative financial assumptions to produce bank-acceptable projections.
Capacity Planning for Bank Finance and DPR Preparation
Term-lending banks examine installed capacity, proposed utilisation, demand justification, milk procurement, machinery quotations, technical feasibility, working-capital estimates, DSCR, and promoter contribution. A well-prepared dairy beverage plant DPR integrates technical capacity, product mix, realistic SKU planning, and phased expansion into a coherent business case. Lenders challenge overly optimistic utilisation or under-stated costs; projects with justified capacity appear more bankable. Detailed schedules of machinery, line capacities, and shift-wise production plans demonstrate that proposed sales volumes are physically achievable. I assist promoters through www.projectreportbank.com in structuring such capacity-linked financial models and CMA data.
Designing the Plant for Future Expansion
Future expansion possibilities should be included in capacity estimation from the start. Install an economically viable first phase while making civil, utility, and layout provisions for future dairy beverage capacity expansion.
| Area | Initial Provision | Future Expansion Consideration |
|---|---|---|
| Processing Hall | Space for current lines | Reserved floor area for additional line |
| Utility Area | Boiler, chiller, compressor for Phase 1 | Oversized headers, transformer capacity |
| Tank Farm | Current storage tanks and mixing tanks | Foundation pads for additional tanks |
| Warehouse/Cold Room | Storage for current output | Building extension zone on site plan |
| ETP | Capacity for current effluent load | Modular ETP design for higher volumes |
Properly planned phased investment improves early-years return on capital while minimising disruption during later dairy beverage production line expansion.
Brownfield Expansion vs Greenfield Overcapacity
Two strategies: (a) large capacity from Day 1, or (b) commercially reasonable first phase with planned brownfield expansion. Installing high overcapacity initially leads to low utilisation, depressed ROI, and difficulty servicing bank finance. Well-planned brownfield expansion allows capacity increments with moderate new investment. Phasing capacity also lets promoters adopt updated technologies in later phases as plant based beverages, plant based drinks, and new dairy beverage packaging norms evolve. Evaluate both options quantitatively in DPRs, comparing NPV and DSCR under realistic demand scenarios.
Common Mistakes in Dairy Beverage Capacity Planning
- Selecting capacity without demand validation or competitive analysis
- Assuming near-100% utilisation by Year 1; ignoring seasonality
- Ignoring filling/packaging lines as the primary bottleneck; buying oversized processing units that the rest of the plant cannot support
- Launching too many SKUs and pack sizes at start-up, fragmenting production and inflating working capital
- Underestimating changeover and CIP time in daily schedules
- Designing insufficient cold-store capacity, cheese or butter by-product storage, or ETP capacity
- Preparing financial projections disconnected from technical capacity realities
A professional, integrated approach combining technical design with financial modelling helps manufacturers, companies, and dairy producers avoid these pitfalls.
Practical Capacity-Planning Checklist
- Target markets, regions, and demand estimates by product category
- Annual volume targets (litres) and expected SKU count with pack sizes
- Preferred packaging formats (PET, glass, aseptic cartons)
- Processing capacity (LPH) and filling capacity (BPH) selection
- Planned shifts per day and effective production days per year
- Assumed capacity utilisation with phased ramp-up and allowance for changeovers and CIP
- Utilities sizing: steam, power, refrigeration, water, compressed air
- Raw milk procurement capacity, chilling infrastructure, and quality testing
- Packaging supply arrangements and lead times
- Storage, cold chain, and logistics resources
- Project cost by major heads and working capital requirement
- Contribution per litre by product group, break-even analysis, DSCR, and sensitivity to utilisation changes
This checklist forms the backbone of a Detailed Project Report and bank-finance discussion, particularly with professional solutions from CA Manish Gugliya and ProjectReportBank.
Role of a Detailed Project Report (DPR) in Capacity Planning
A technically sound dairy beverage plant DPR combines plant capacity assessment, SKU planning, project cost estimation, and detailed financial projections into one integrated document. Major components include proposed capacity (per hour and per annum), product mix, process description, machinery selection, utilities, civil layout, phased expansion strategy, means of finance, capacity utilisation assumptions over 5-7 years, cost of production, profitability, working capital, cash-flow projections, DSCR, break-even, and sensitivity analysis.
As a practising Chartered Accountant, I prepare, analyse, and structure DPRs and CMA data for dairy beverage plants so that capacity, product mix, and financials are aligned for bankability. Engaging professional support early avoids redesigning capacity or product mix after bank feedback, saving time and cost.
FAQ: Dairy Beverage Plant Capacity Planning & Product Mix
These questions address the most common practical concerns entrepreneurs raise when planning dairy beverage plant capacity and product mix strategy in India.
How is dairy beverage plant capacity calculated in practice?
Start from realistic annual sales targets (litres) by SKU. Convert to daily and hourly volumes. Adjust for planned production days, shifts, and productive hours. Apply an efficiency factor (typically 0.65-0.80 for new plants) to arrive at effective capacity. Check both processing and filling capacities separately to ensure neither becomes a bottleneck.
What is a reasonable capacity utilisation assumption for a new dairy beverage plant in India?
There is no universal percentage. New plants rarely exceed 40-55% utilisation in Year 1 due to commissioning and market building. Mature Indian dairy plants average around 70-76% utilisation. Phase assumptions upward across years and justify them with distribution contracts, marketing plans, and milk procurement evidence.
Should a new dairy beverage plant start with many SKUs and pack sizes?
No. Begin with a focused portfolio of a few high-volume SKUs and 1-2 key pack sizes. This simplifies operations, stabilises capacity utilisation, reduces working capital strain, and generates reliable cost and demand data. Add SKUs only after confirming demand and assessing impact on changeover time and line capacity.
How does product mix affect dairy beverage plant profitability?
Different products carry different contribution margins per litre and consume bottleneck hours differently. A plant running only low-margin, high-volume SKUs may struggle to cover fixed costs despite high utilisation. Integrating a proportion of premium or functional SKUs can improve average contribution and reduce break-even volume without increasing total capacity.
Can the same dairy beverage line produce flavoured milk, chocolate milk, and milkshakes?
Technically yes, but viscosity differences, heat-treatment parameters, and flavour contamination risk require careful batch sequencing, changeover procedures, and CIP cycles. Promoters must account for additional downtime and slower line speeds on thicker products when calculating effective capacity. A consistent quality standard across all products requires disciplined production scheduling and QA protocols.
Conclusion
The optimal dairy beverage plant is not the one with the largest installed capacity. It is the plant where processing capacity, filling capacity, product mix, SKU and pack-size strategy, market demand, working capital, and expansion planning are properly aligned.
Disciplined dairy beverage plant capacity planning, grounded in realistic market assessment and rigorous financial modelling, improves capital efficiency, plant utilisation, cost per litre, profitability, and long-term scalability. Treat capacity and product-mix decisions as board-level strategic choices, not last-minute technical details.
If you are planning a dairy beverage manufacturing project in India and need professional assistance with a Detailed Project Report, CMA Data, financial projections, project feasibility assessment, capacity and product-mix financial modelling, or bank-finance documentation, reach out through www.projectreportbank.com.
CA Manish Gugliya Practising Chartered Accountant | Project Finance & DPR Consultant