Whey processing can transform one of the dairy industry’s most underutilised by-products into a profitable commercial venture. Yet the journey from liquid whey to bankable returns is far from straightforward. This article provides a structured, practitioner-level walkthrough of whey processing project ROI, IRR and sensitivity analysis, covering every variable that promoters, lenders and investors in India need to evaluate before committing capital to a whey plant project.
Key Takeaways
- Whey processing can convert low-value liquid whey from cheese production, paneer or casein production into commercially valuable whey products such as whey powder, whey protein concentrate, whey protein isolate, lactose and functional food products. However, actual whey processing project ROI and IRR depend heavily on plant capacity, product mix, recovery rates, selling prices, capital expenditure (CAPEX) and operating expenses (OPEX).
- A proper whey processing project financial analysis must combine ROI, project IRR, equity IRR, NPV, payback period and DSCR along with structured sensitivity analysis before finalising any plant project. No single metric tells the full story.
- In my experience as a practising Chartered Accountant preparing DPRs since 2006, lenders in India focus not only on profitability but also on cash-flow stability, DSCR and realistic assumptions for plant capacity and working capital.
- Even small changes in whey powder or WPC selling price, recovery yield or whey purchase price can significantly change investment returns, making sensitivity and scenario analysis essential for every whey processing plant feasibility analysis.
- Promoters should use a project-specific financial model for their whey processing plant, not generic industry averages, and can seek expert DPR and projections assistance through www.projectreportbank.com.
Understanding Returns from a Whey Processing Project
Whey is obtained as a by-product whenever milk is coagulated during cheese making, paneer manufacturing or casein production. In its raw liquid form, whey has limited commercial value and creates a significant environmental impact due to its high biological oxygen demand (BOD). However, through further processing involving pasteurisation, membrane filtration and spray drying, this liquid whey can be upgraded into whey powder, demineralised whey powder, whey protein concentrate (WPC), whey protein isolate (WPI) and lactose products. Whey processing reduces environmental harm from dairy waste while simultaneously creating revenue streams from what would otherwise be a disposal liability.
The global whey protein market was valued at USD 5.69 billion in 2025 and is expected to reach USD 7.69 billion by 2034. In India specifically, growing demand from sports nutrition, clinical nutrition, infant nutrition and weight management segments has created a significant supply gap. India imports approximately 80–90% of sports-grade WPC and WPI, and domestic whey processing capacity remains well below demand. However, attractive market growth does not automatically guarantee that every whey processing plant project is viable. The actual return depends on raw material availability, plant capacity, technology selection, energy intensity of evaporation and drying process stages, product quality and capacity utilisation.
The main financial metrics used to evaluate a whey processing project are Return on Investment (ROI), Internal Rate of Return (IRR), Net Present Value (NPV) and payback period. Calculating the return on investment helps determine financial viability for whey processing projects, but ROI alone cannot capture the timing of cash flows or the risk profile. Similarly, IRR without NPV context or DSCR assessment may mislead. A detailed whey processing project financial model in India typically uses 10–12 year projections, phased capacity ramp-up and multiple product lines to properly estimate long-term returns. This article walks through the logic of ROI, project IRR, equity IRR, payback, NPV and sensitivity analysis specifically for whey processing plants.
Why ROI and IRR Analysis Is Important Before Investment
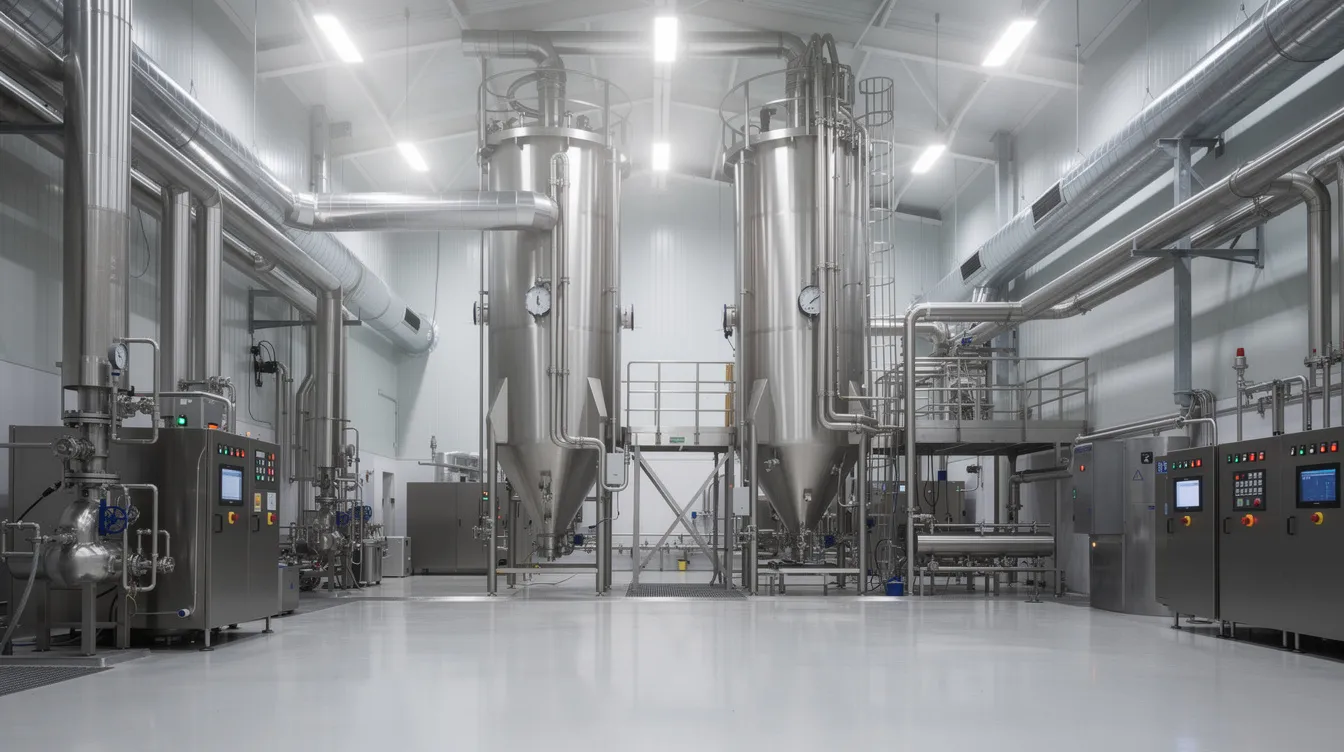
Before committing to a whey processing plant, promoters need a clear-eyed assessment of whether expected profits justify the capital expenditure on evaporation systems, membrane filtration equipment, spray drying or drum drying towers and associated utilities. A structured whey processing plant ROI analysis serves multiple purposes:
- It helps determine whether expected returns justify the total capital investment required for a specific plant configuration.
- It allows comparison of alternative plant capacities and product combinations – for example, a 10,000 LPH versus a 50,000 LPH whey input facility, or a whey powder-only plant versus one producing whey powder, WPC and lactose.
- Separate ROI and IRR evaluation is required for integrated plants (with own cheese production supplying whey) versus standalone whey processing units that must purchase whey as a raw material at a negotiated purchase price.
- Lenders and investors use project IRR, equity IRR, NPV and payback to assess whey plant financial viability and compare it with other sectors or dairy investments.
- It clarifies the difference between simple accounting profitability (net profit on the P&L), cash profitability (cash accrual, which adds back non-cash charges like depreciation) and investment returns (IRR and NPV, which account for the timing of cash flows and total investment).
From a lender’s perspective, a properly prepared DPR should clearly explain assumptions behind ROI and IRR so that they can test them against their own risk benchmarks for food-processing units in India. Whey protein is a key ingredient in sports nutrition and dietary supplements, and the competitive landscape is evolving rapidly – which means financial assumptions need constant grounding in current data.
Major Factors Affecting Whey-Plant Investment Returns
In my experience, the single most common reason a whey plant underperforms its projections is over-optimism in a few key assumptions rather than calculation mistakes. It is rarely an arithmetic error in the spreadsheet; it is almost always an unrealistic selling price, an overstated recovery rate or a capacity utilisation number that the plant never achieves.
A detailed DPR should map how the following factors jointly influence whey processing plant investment returns:
- Plant capacity and capacity utilisation
- Product mix and degree of value addition
- Whey availability, quality and procurement cost
- Recovery rate and product yield
- Selling price and net market realisation
- Energy and utility costs
- Capital cost and implementation delays
- Working capital and receivable cycle
- Financing structure and interest rate
The following subsections break these factors into practical decision areas that directly alter ROI, IRR and payback period of a whey processing facility in India.
Plant Capacity and Capacity Utilisation
Fixed costs in a whey processing plant – depreciation on the processing line, salaries of a skilled workforce, minimum utilities, insurance and interest on borrowed capital – are largely independent of production volume. When a plant runs at low capacity utilisation, these fixed costs are spread over fewer kilograms of finished whey powder or WPC, sharply increasing the per-unit cost of production.
Consider an illustrative comparison. A plant designed to process 50,000 litres per day of liquid whey runs at 40% capacity utilisation in Year 3 versus 80%. At 40%, the fixed cost burden per kg of powder is roughly double compared to 80% utilisation. This difference alone can reduce the whey processing project ROI by several percentage points and extend the payback period by years. Whey processing exhibits strong economies of scale, with significant differences in costs based on volume processed.
In DPRs I prepare, I typically assume a realistic ramp-up: 50–60% in Year 1 (accounting for commissioning and stabilisation), 70–80% in Year 2, and stabilising near 85–90% from Year 3 or 4 onward. Assuming 100% utilisation from the first year is rarely justified and raises credibility concerns with experienced lenders. Promoters should align whey processing plant capacity and product mix with confirmed whey supply, either from in-house cheese or paneer plants or through long-term procurement agreements. Idle capacity directly depresses whey processing project profitability.
Product Mix and Value Addition
The choice of final product is one of the most consequential decisions in a whey plant project. Typical options include sweet whey powder, demineralised whey powder, whey protein concentrate (WPC 35 to WPC 80), whey protein isolate (WPI with over 90% protein in dry matter), lactose and customised functional blends. Each product requires different technology, CAPEX and quality control systems, and commands a different selling price.
Higher-value products like WPC and WPI typically need more advanced membrane filtration technology for whey processing, including ultrafiltration, diafiltration and sometimes nanofiltration. Ultrafiltration can concentrate whey protein to 35–80% protein content, while WPI requires additional polishing steps. The functional properties of these products – including essential amino acids and branched chain amino acids content – make them attractive for sports nutrition, infant formula, clinical nutrition and functional foods. Gross profit margins for whey protein plants typically range between 40–50% at stable operations for higher-value products, though these margins are sensitive to input quality and market fluctuations.
A qualitative comparison of the two broad approaches:
- Whey powder-only plants use mainly evaporation and spray drying. CAPEX is lower, the manufacturing process is simpler, and the break-even point is more achievable – but realisations per kg are modest.
- Integrated WPC/WPI plants add nanofiltration, ultrafiltration, reverse osmosis and additional polishing steps. CAPEX is substantially higher, regulatory compliance requirements are stricter and quality control is more demanding – but net realisation per kg of solids can be several times higher.
Promoters should compare expected returns from simple whey powder versus a staged project (starting with powder, later adding WPC or lactose recovery) using separate ROI and IRR estimates for each configuration. Whey processing includes pasteurisation, filtration and drying, and the production processes chosen at the design stage directly determine the plant’s long-term financial trajectory.
Whey Availability, Quality and Procurement Cost
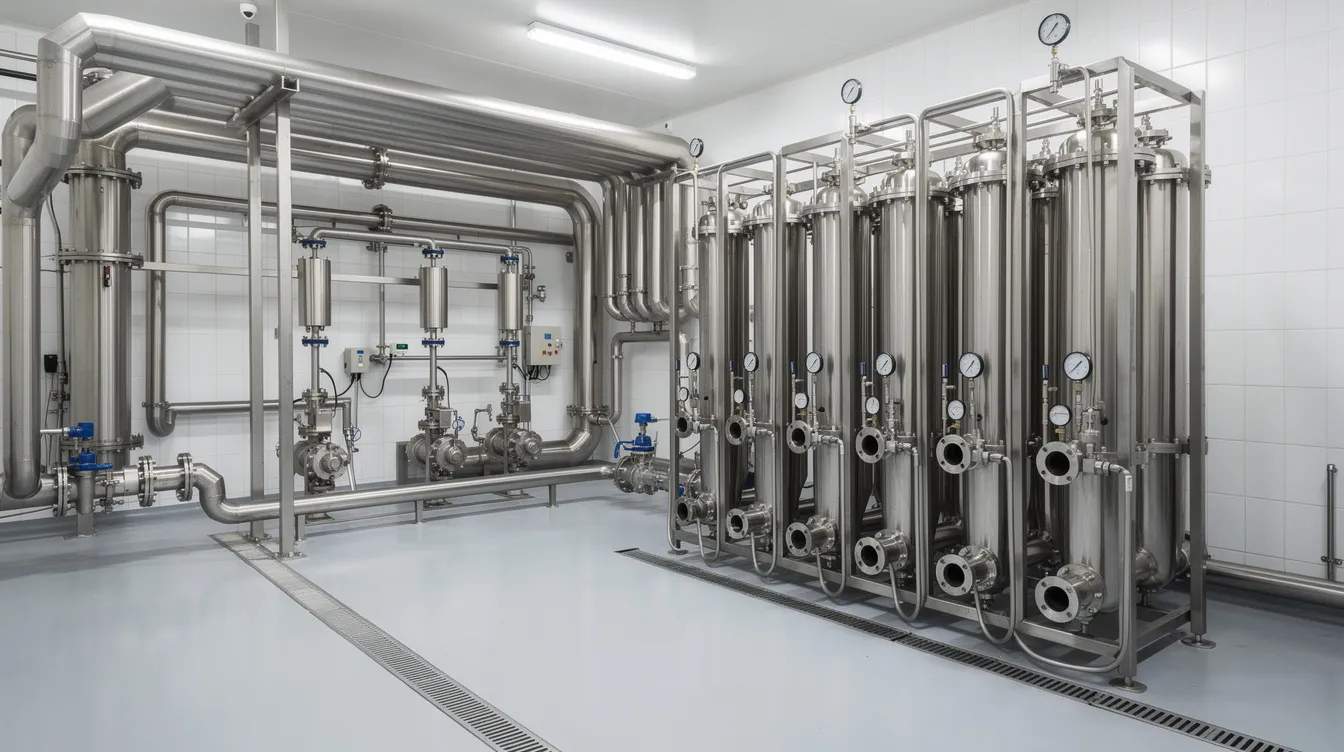
Liquid whey is the primary raw material, and its continuous supply, composition and purchase price critically affect whey plant project economics. Whey comprises 80–90% of total milk volume used in cheese or paneer production, so even a medium-scale cheese plant generates significant whey volumes. However, liquid whey is highly perishable and must be processed or at least cooled within hours of generation.
Integrated plants attached to existing cheese or paneer factories enjoy better control over whey freshness, consistency and quality. Standalone processors who buy whey as a raw material must negotiate price, manage logistics (transport is expensive because liquid whey is heavy) and cope with seasonal variation in supply. Acid whey from cottage cheese or certain casein production processes has a different mineral profile and may be harder to process for premium WPC or WPI.
Typical liquid whey contains about 6.5–7.0% total solids, of which protein content is roughly 0.8–1.2%. High-quality raw inputs directly influence yield and profitability in whey processing projects. DPRs should avoid designing plant capacity purely on theoretical regional whey generation. Instead, capacity should be based on signed or at least initialled supply arrangements with realistic collection radii. In later sections, the sensitivity analysis must explicitly test higher whey purchase price or lower effective whey supply to see how these affect whey processing plant ROI and IRR.
Recovery Rate and Product Yield
Recovery rates – for protein, lactose and total solids – are the bridge between technical performance and financial outcomes. They must be explicitly modelled in the financial projections. Membrane efficiency, process losses during cleaning-in-place (CIP), moisture targets in the final product and buyer specifications all alter the saleable output from a given volume of liquid whey.
Consider this: a plant processing liquid whey equivalent to roughly 20,000 metric ton per year of whey powder might lose only 2–3 percentage points in overall solids recovery – but that small drop could reduce annual contribution by several crore rupees, significantly lowering IRR and extending the payback period. In my experience, the most reliable way to validate recovery assumptions is through pilot trials, vendor performance guarantees documented in the contract, or benchmarks from similar operating plants – not from optimistic marketing literature.
Selling Price and Market Realisation
There is an important distinction between the list selling price and the net realisation after trade discounts, freight, distribution costs, GST impact on working capital, commissions, credit period costs and possible sales returns. Market volatility affects global prices for whey protein concentrate and other whey products. In India, imported WPC 80 raw material pricing has risen sharply – from approximately ₹700–800/kg to ₹2,300–3,000/kg in 2025–26 – reflecting global supply constraints and rising demand from fitness enthusiasts and clinical applications.
Even a ₹5–10 per kg drop in whey powder or WPC price can compress EBITDA margins and potentially reduce project IRR below a lender’s comfort level. Sensitivity scenarios later in this article include at least 5–10% downside in selling prices, along with commentary on the impact on NPV, payback period and DSCR. Promoters should develop realistic whey processing plant revenue model and market applications assumptions based on current price trends rather than outdated datasets.
Energy and Utility Costs
Evaporation, pasteurisation, membrane systems and especially spray drying make whey processing energy-intensive. High energy consumption is a significant factor in OPEX for whey processing, and whey processing plants require high energy consumption for drying. The key utilities include:
- Electricity for motors, pumps, membrane systems, automation and cooling
- Steam or thermic fluid for evaporators and pasteurisers
- Refrigeration for raw whey storage and concentrate handling
- Process water and compressed air
- Effluent treatment for high-COD whey permeate and wastewater treatment
Small percentage increases in power tariff, boiler fuel price or specific energy consumption can meaningfully affect unit production cost, especially for spray drying-based whey powder plants. Drum drying is an alternative for certain products but has its own energy profile. Promoters should obtain vendor estimates for kWh per kg of powder form output and steam consumption per kg water evaporated, and feed these directly into their expenditure projections rather than using generic dairy processing norms. Energy cost is one of the core variables in the whey processing plant sensitivity analysis discussed later.
Capital Cost and Implementation Delay
CAPEX for a whey processing plant encompasses land and site preparation, civil construction, process and utility plant machinery, installation, piping, insulation, electricals, automation, pre-operative expenses and interest during construction (IDC). The initial investment for a whey processing plant is significant. Depending on scale, the total capital investment for a whey protein plant can exceed $33 million (roughly ₹250+ crore for large plants), while mid-size plants handling 1–1.5 lakh litres per day of whey may range from ₹80–100 crore.
Cost overruns on imported membrane systems, spray dryers or evaporators, foreign-exchange fluctuation and design changes can push actual project cost well above the initial estimate, depressing ROI and IRR. Implementation delays typically raise interest during construction, postpone revenue and increase equipment costs due to inflation, lowering project NPV and extending payback period. Promoters should cross-check their budget against guidance on whey processing plant setup cost in India and whey processing plant machinery and equipment cost.
Working Capital and Receivable Cycle
Even a profitable whey plant can face cash-flow stress if working capital for inventory, receivables and day-to-day operating costs is underestimated. Major working-capital items include:
- Whey and chemical inventory (cleaning agents, consumables for membrane systems)
- In-process concentrate and finished whey powder or WPC stock
- Packing material and packaging inventory
- Trade receivables from domestic and export buyers
- Normal credit from suppliers of raw materials and services
Longer credit periods to large buyers or export clients increase working-capital borrowing, interest cost and hence reduce equity IRR and cash ROI – especially in the initial years when cash flows are still ramping up. A well-prepared DPR should separately compute the whey processing plant working-capital requirement and include interest on working-capital borrowings in the projected P&L and cash-flow statements.
Financing Structure and Interest Rate
A typical Indian whey processing plant is financed through a combination of promoters’ equity (usually 20–30%), term loans from banks or financial institutions (70–80%) and separate working-capital limits. The debt–equity ratio, repayment tenure, initial moratorium and interest rates on both term loan and working capital collectively shape cash-flow patterns and equity IRR.
- Higher leverage can enhance equity IRR if project IRR exceeds the cost of debt, but it also increases risk and can depress DSCR in downside scenarios.
- Lenders evaluate average DSCR (typically requiring ≥1.25–1.50), minimum DSCR in any single year (usually ≥1.10 or higher), adequacy of promoter contribution and collateral security when deciding on bank loan and project finance for a whey processing plant.
- Interest rate risk is real: if market rates rise or the borrower’s risk profile changes, equity cash flows shrink and DSCR and loan-repayment capacity may come under pressure.
The financing structure is not merely a funding decision – it directly affects the whey processing project’s bankability and the promoter’s return.
Understanding ROI in a Whey Processing Project
Return on Investment (ROI) is the percentage return generated on the total funds invested in the project over a specified period. The standard financial formula for ROI is:
ROI (%) = Net Profit ÷ Total Investment Cost × 100
In capital budgeting, ROI is often evaluated using net annual cash flow: ROI (%) = Annual Net Cash Inflow ÷ Initial Capital Investment × 100. Net profit is calculated by total revenue minus total expenses, while annual net profit is calculated by subtracting total annual operating expenses from total annual revenue. Total investment cost includes all capital expenditures and initial startup costs. Reports must clearly state which basis they use:
- ROI based on Profit After Tax (PAT): Uses accounting net profit, which includes non-cash charges like depreciation.
- ROI based on Cash Accrual: Uses PAT plus depreciation, giving a better picture of the project’s cash-generation capacity.
- Return on Capital Employed (ROCE): Profit before interest and tax divided by total capital employed.
- Return on Promoters’ Equity: Uses only the promoter’s contribution in the denominator, showing the return earned on equity capital specifically.
The following illustrative table shows how ROI changes when assumptions differ. All figures are illustrative only and not an assurance of return:
| Parameter | Case A | Case B | Case C |
|---|---|---|---|
| Total Project Cost (₹ crore) | 90 | 90 | 105 |
| Capacity Utilisation (Year 3) | 85% | 70% | 85% |
| Annual PAT at Stable Operations (₹ crore) | 10.8 | 7.2 | 9.5 |
| Cash Accrual (PAT + Depreciation, ₹ crore) | 17.5 | 13.9 | 16.8 |
| ROI on PAT Basis | 12.0% | 8.0% | 9.0% |
| ROI on Cash Accrual Basis | 19.4% | 15.4% | 16.0% |
As the table shows, lower capacity utilisation or higher project cost can reduce ROI meaningfully. In my advisory practice, I recommend using ROI only as a supplementary ratio along with IRR and NPV when assessing whey plant investment feasibility.
Understanding IRR in a Whey Processing Project
Internal Rate of Return (IRR) is defined as the discount rate at which the present value of future cash inflows from the whey project equals the initial investment, resulting in zero NPV. It is the most widely used metric in capital budgeting for food industry projects because it inherently accounts for the time value of money.
IRR cannot be computed by simply dividing profit by investment. It requires a year-wise cash-flow series reflecting the timing of all cash movements over the project life – typically 8–12 years for a whey plant. Mathematically, if the chosen discount rate (representing the project’s cost of capital) is lower than the IRR, the project NPV is positive and the project is expected to add economic value. If the discount rate exceeds the IRR, the project destroys value.
There are two distinct IRR measures that a whey processing project DPR should present:
- Project IRR: Reflects the return generated by the project before considering the specific financing mix.
- Equity IRR: Reflects the return earned by promoters after debt servicing.
Both should be compared, and promoters must avoid setting unrealistic “target IRR” without understanding the underlying assumptions that produce the number.
Project IRR vs Equity IRR
Project IRR is computed on cash flows before financing – that is, cash flows after tax but before interest and principal repayment. It reflects the intrinsic return of the project itself, irrespective of how it is funded. If two identical whey plants are funded differently (one with 100% equity, the other with 70% debt), their project IRR should be the same, but their equity IRRs will differ.
Equity IRR is computed on equity cash flows after considering loan drawdown at the beginning, interest payments, principal repayments and any dividends or additional equity infusions over time. When project IRR exceeds the cost of debt, higher leverage (more borrowing) typically increases equity IRR. However, this also increases downside risk – if revenues fall short, the equity holder absorbs the entire shortfall after debt service.
In DPRs for whey plants, both IRRs should be reported for the same set of operating assumptions, so that promoters and lenders see the full picture of whey processing plant investment returns. Even if project IRR seems attractive, equity IRR may be modest if total capital investment is high relative to equity, or if the loan repayment schedule is front-loaded. This is a key point in negotiation of loan terms.
Net Present Value and Discount Rate
Net Present Value (NPV) is the sum of the present values of all future cash inflows and outflows of the project, discounted at an appropriate rate representing the opportunity cost of capital and the project’s risk. In simple terms:
NPV = (Sum of discounted annual net cash inflows over project life) + (Discounted terminal/residual value) + (Discounted recovery of working capital) − Initial project investment
A positive NPV at the chosen discount rate suggests that the whey processing plant is expected to create economic value above and beyond the required return. A negative NPV means it does not meet the threshold. Choosing the discount rate arbitrarily – for example, always using 10% without justification – can mislead. The rate should reflect the blended cost of debt and equity and risk-adjusted expectations for the dairy sector, typically 12–15% for whey projects in India.
The relationship between NPV and IRR is straightforward: the IRR is the discount rate at which NPV becomes zero. Both metrics should be reviewed together for a rounded whey processing plant feasibility analysis and whey plant NPV analysis.
Payback Period and Discounted Payback Period
The simple payback period is the time required for cumulative net cash inflows to recover the initial project investment, without considering the time value of money. The payback period is calculated as Investment Cost divided by Annual Cash Flow.
The discounted payback period discounts yearly cash flows at the chosen rate before computing cumulative recovery, making it consistent with NPV concepts and always longer than the simple payback. While a shorter payback period is reassuring for promoters and lenders, it does not capture returns beyond the payback year. A project with slightly longer payback but higher long-term NPV might be a better choice.
In Indian banking practice, the whey plant payback period is considered along with DSCR and IRR to judge whether the loan tenor is reasonably aligned with the project’s cash-generation ability.
Building the Cash-Flow Model for ROI and IRR
A sound whey processing project financial model should be built from the technical side up – starting with plant capacity, product mix and manufacturing process – rather than only from target profit numbers. OPEX includes raw material costs, utilities, labour, maintenance and quality control. Operating expenses account for 50–60% of total costs in many whey processing configurations.
Key inputs the model must capture:
- Installed capacity (litres per day of whey input)
- Phased capacity utilisation (Year 1 through Year 10+)
- Product-wise recovery and yield (solids, protein, lactose)
- Product-wise selling price (net of discounts and freight)
- By-product revenue (sale of permeate, lactose products, or even applications like animal feed)
- Whey procurement cost including transport and handling
- Chemicals and consumables (cleaning agents, membrane replacement)
- Packaging cost
- Power, steam, refrigeration, water and compressed air
- Labour and administrative overheads
- Repairs and maintenance
- Selling and distribution expenses
- Depreciation (per Companies Act / Income Tax Act schedules)
- Interest during construction
- Term-loan interest and working-capital interest
- Taxation
- Loan principal repayment
- Working-capital recovery and residual value at the end of the projection period
The model must convert accounting profit to cash flows by adding back non-cash charges like depreciation, subtracting loan principal repayments and considering working-capital changes to derive the cash series used for project IRR and equity IRR. Detailed financial models for whey facilities should account for costs and revenues associated with all product streams. For a comprehensive view of typical assumptions and formats, promoters can refer to financial projections for a whey processing plant DPR.
Illustrative ROI, IRR and NPV Calculation for a Whey Processing Plant in India
The following example is purely illustrative and does not constitute a quotation, offer or industry benchmark. All figures are hypothetical and intended only to demonstrate the methodology.
Assumptions:
- Total project cost: ₹90 crore (including land, civil, machinery, utilities, installation, pre-operative expenses and IDC)
- Promoter equity: 25% (₹22.5 crore); Term loan: 75% (₹67.5 crore)
- Term loan interest rate: 10.5% p.a.; Repayment over 8 years with 1-year moratorium
- Plant capacity: 1.2 lakh litres per day of liquid whey input
- Product mix: 70% whey powder, 30% WPC 80
- Operating days: 300 per year
- Capacity utilisation: Year 1 – 55%, Year 2 – 75%, Year 3 onwards – 85%
- Net selling price: Whey powder ₹220/kg; WPC 80 ₹2,400/kg (net of discounts and freight)
- Whey procurement cost: ₹4 per litre delivered (including transport)
- Discount rate for NPV: 12%
Estimated Annual Financials at Stabilised Capacity (Year 3 onward):
| Parameter | ₹ Crore (Approx.) |
|---|---|
| Annual Revenue | 78–82 |
| Raw Material Cost (whey + chemicals) | 50–54 |
| Utilities (power, steam, water, ETP) | 8–10 |
| Labour + Overheads + Packaging | 6–7 |
| EBITDA | 14–17 |
| Depreciation | 6–7 |
| Interest on Term Loan (declining balance) | 4–6 |
| Profit Before Tax | 4–7 |
| Tax | 1–2 |
| Profit After Tax (PAT) | 3–5 |
| Cash Accrual (PAT + Depreciation) | 9–12 |
Illustrative Cash-Flow Series for IRR and NPV (₹ Crore):
| Year | Net Cash Flow (Project Basis) |
|---|---|
| 0 (Investment) | (90.0) |
| 1 | 6.0 |
| 2 | 11.5 |
| 3 | 15.0 |
| 4 | 16.0 |
| 5 | 16.5 |
| 6 | 16.8 |
| 7 | 17.0 |
| 8 | 17.2 |
| 9 | 17.5 |
| 10 (incl. terminal value and WC recovery) | 25.0 |
Indicative Results:
| Metric | Illustrative Value |
|---|---|
| Simple ROI (PAT/Total Investment) | ~5–6% (Year 3) |
| ROI on Cash Accrual Basis | ~12–13% (Year 3) |
| Project IRR | ~15–17% |
| Equity IRR | ~19–23% |
| NPV at 12% Discount Rate | ₹8–15 crore (positive) |
| Simple Payback Period | ~5–6 years |
| Discounted Payback Period | ~6–8 years |
At the assumed prices and costs, the project yields a project IRR moderately above the 12% discount rate, with NPV positive. Equity IRR is higher than project IRR because of leverage – the term loan cost is below the project IRR, so debt amplifies equity returns. However, this leverage also means that if operating performance weakens, the equity holder bears concentrated risk.
These are conservative figures. A plant focused entirely on WPC 80 or WPI would have higher revenue per kg but also higher CAPEX and stricter quality demands. Unit production costs for whey protein concentrates in published economic analysis studies range from $3,680 to $3,850 per metric ton, depending on scale and technology.

Whey Processing Plant Sensitivity Analysis
Whey processing plant sensitivity analysis examines how changes in key assumptions affect ROI, IRR, NPV and DSCR. Sensitivity analysis is crucial for assessing the economic viability of whey processing due to market fluctuations. For capital-intensive plants using evaporators and spray dryers, a single base-case projection is insufficient. Lenders expect at least a base case, moderate downside and sometimes severe downside scenario.
The following subsections discuss one-variable sensitivity on EBITDA, profit, NPV, project IRR, equity IRR and average DSCR, using the illustrative plant example introduced above. From a lender’s perspective, sensitivity findings are crucial for assessing the robustness and bankability of the whey processing project.
Selling-Price Sensitivity
Lowering whey powder and WPC selling prices by 5–10% from the base case can reduce EBITDA margin materially. For example, a 10% price reduction on both products might reduce annual EBITDA by ₹4–5 crore, potentially reducing project IRR by 3–5 percentage points – bringing it close to or below the cost of capital. In a scenario where the project IRR falls from 16% to 11–12%, NPV turns marginally positive or even negative, and payback extends beyond 7–8 years.
A properly prepared DPR should document such sensitivity runs and highlight the minimum sustainable price below which whey plant financial viability becomes weak. In my project evaluations, I usually advise testing price reductions larger than recent historical fluctuations in the target market to ensure adequate margin of safety.
Capacity-Utilisation Sensitivity
Delayed ramp-up or persistent underutilisation is a common practical risk in new whey plants due to logistical issues with whey collection, quality challenges or slower-than-expected market penetration for the food industry. If utilisation remains at 60–70% of planned levels for the first few years instead of the assumed 80–85%, the impact is significant: fixed costs are absorbed over fewer units, cash surplus shrinks and DSCR may drop below lender covenants.
Comparing base-case projections (reaching 85–90% utilisation by Year 3) with a downside case where utilisation plateaus at 70–75%, project IRR can decline by 2–4 percentage points and NPV may halve. Whey plant break-even capacity utilisation must be significantly below planned steady-state utilisation to provide a safety cushion.
Recovery and Yield Sensitivity
A modest reduction in protein recovery or overall solids yield – even 1–2 percentage points – reduces saleable tonnage of whey powder or WPC, directly cutting revenue while many costs remain fixed. For a plant processing ~3,500 kg of total solids per day, a 2% recovery drop means roughly 70 kg fewer saleable solids daily. Over 300 working days, that is approximately 21,000 kg less per year – at ₹220/kg for powder, this represents over ₹46 lakh in lost contribution annually.
Promoters should test downside yield assumptions attributable to membrane fouling, CIP downtime, stricter moisture or protein specifications and unanticipated process losses. Lower yields not only reduce IRR but may also impact the plant’s ability to honour long-term supply contracts, leading to penalties or loss of premium customers.
Whey Procurement-Cost Sensitivity
For standalone processors especially, an increase in the purchase price of liquid whey or of intermediate whey concentrate can substantially reduce contribution margins. A ₹0.50 per litre increase in whey purchase price (after accounting for transport and handling) may sound small, but across 1.2 lakh litres per day and 300 operating days, it adds roughly ₹1.8 crore to annual raw material costs – eroding gross margin on each kg of whey powder or WPC.
DPRs should test scenarios where competing processors enter the region or where upstream milk prices rise, forcing cheese manufacturers to renegotiate whey supply terms. Long-term contracts and transparent pricing formulas can partially mitigate this risk, but sensitivity analysis should still assume possible adverse movements.
Utility-Cost Sensitivity
A 10–20% rise in energy costs – driven by higher electricity tariffs, boiler fuel prices or water and effluent-treatment charges – can reduce EBITDA margin by 1–2 percentage points and project IRR by a similar magnitude. For the illustrative whey plant spending ₹8–10 crore annually on utilities, a 15% increase represents ₹1.2–1.5 crore in additional operating expenses.
Promoters should explore energy-efficiency measures, waste-heat recovery options and potentially solar pre-heating and consider them in the DPR as risk-mitigation steps. Regulations require manufacturers to comply with food safety standards and manage wastewater treatment due to high BOD of whey, adding further to utility costs.
Capital-Cost Overrun and Interest-Rate Sensitivity
Unplanned increases in project cost (CAPEX overrun) raise depreciation, interest and the required quantum of both equity and debt, thereby lowering project IRR and ROI. A 10–15% CAPEX overrun for a whey plant with imported spray dryer and membrane systems can materially reduce NPV even if operating performance meets projections. For instance, a ₹13.5 crore overrun on a ₹90 crore project increases annual depreciation by over ₹1 crore and annual interest cost by ₹0.8–1.0 crore – together reducing cash accrual and extending payback.
Higher interest rates on term loans or working capital – whether due to market changes or rating issues – reduce equity cash flows and equity IRR, and can also tighten DSCR margins. Sensitivity analysis should therefore include both higher project cost and higher interest rates, individually and jointly, to assess downside risk to whey processing project bankability.
Implementation-Delay Sensitivity
Delays in plant commissioning have a double impact: additional interest during construction (IDC) and postponement of revenue. A 6–9 month delay could add ₹3–5 crore to IDC on a ₹67.5 crore term loan, while simultaneously shifting all cash inflows forward by one year – reducing NPV even if eventual capacity utilisation matches projections. Lenders scrutinise project-implementation schedules, EPC contracts and contingency provisions to judge whether the delay risk has been realistically considered in the DPR.
Recommended Sensitivity Scenarios for a Whey Plant DPR
A well-structured DPR should present at least three explicit scenarios:
| Variable | Base Case | Moderate Downside | Severe Downside |
|---|---|---|---|
| Product Selling Price | As estimated | –7% | –12% |
| Capacity Utilisation (Year 3+) | 85% | 75% | 65% |
| Product Recovery (Solids) | 75% | 73% | 70% |
| Whey Procurement Cost | ₹4/litre | ₹4.50/litre | ₹5.00/litre |
| Energy Cost | As quoted | +10% | +20% |
| Total Project Cost | ₹90 crore | ₹97 crore | ₹103 crore |
| Term Loan Interest Rate | 10.5% | 11.5% | 12.5% |
| Commissioning Delay | None | 3 months | 9 months |
| Metric | Base Case | Moderate Downside | Severe Downside |
|---|---|---|---|
| EBITDA Margin | ~18–20% | ~12–14% | ~6–8% |
| Profit After Tax (₹ crore) | 3–5 | 1–2 | Negligible/Loss |
| Project IRR | ~15–17% | ~11–13% | ~7–9% |
| Equity IRR | ~19–23% | ~13–16% | ~6–10% |
| NPV at 12% (₹ crore) | 8–15 (positive) | Near zero | Negative |
| Simple Payback (years) | 5–6 | 7–8 | 10+ |
| Average DSCR | 1.45–1.60 | 1.15–1.30 | Below 1.0 |
| Min DSCR | 1.20–1.35 | 0.95–1.10 | Below 1.0 |
The severe downside demonstrates that combined shocks can breach DSCR covenants and turn NPV negative. Promoters and lenders should identify under which conditions the project ceases to be viable, providing a realistic risk map. All figures in this table are illustrative.
One-Way and Two-Way Sensitivity Analysis
One-way sensitivity analysis varies one input at a time – for example, selling price alone – while holding all others constant, to measure its individual influence on project IRR or NPV. This helps identify which single variable has the largest effect on whey processing plant investment returns.
Two-way sensitivity analysis simultaneously varies two inputs. For example, both selling price and capacity utilisation can be tested together, with results presented in a matrix format. Scenario analysis goes further by bundling plausible sets of changes representing real-world situations (e.g., weak demand plus rising costs), while stress testing applies more extreme downside cases to evaluate resilience.
An illustrative 3×3 two-way sensitivity matrix for project IRR:
| Selling Price –10% | Selling Price (Base) | Selling Price +5% | |
|---|---|---|---|
| Utilisation 70% | 8–9% | 11–12% | 13–14% |
| Utilisation 80% | 12–13% | 15–16% | 17–18% |
| Utilisation 90% | 14–15% | 17–18% | 19–20% |
The top-left cell (low price + low utilisation) shows project IRR below typical cost of capital – the project would be financially unviable under this combination. The bottom-right cell shows strong returns. Such analysis is particularly important for bankability, as it demonstrates the resilience or vulnerability of loan-repayment capacity under combined stresses. This kind of whey plant scenario analysis should be a standard feature of any serious DPR.
Break-Even Analysis and Margin of Safety
Break-even analysis for a whey plant determines the level of sales or capacity utilisation at which total contribution equals total fixed costs, yielding zero profit. The key components:
- Fixed costs: Depreciation, salaries, minimum utilities, insurance, interest on term loan
- Variable costs: Whey procurement, power and steam proportional to output, packing material, consumables, transport
- Contribution: Selling price minus variable cost per unit
Break-even capacity utilisation is calculated by dividing total fixed costs by per-unit contribution. If a plant’s break-even utilisation is, say, 55–60%, and planned stable utilisation is 85%, there is a comfortable margin of safety of 25–30 percentage points. However, a project with break-even points above 75–80% is vulnerable during the initial stabilisation period and should be scrutinised carefully by both promoters and lenders.
For a detailed treatment of this topic, promoters can refer to whey processing plant profitability and break-even analysis.
Relationship Between IRR, DSCR and Bankability
While a strong project IRR indicates good value creation, banks in India primarily lend against the project’s demonstrated ability to service debt. This ability is captured by the Debt Service Coverage Ratio (DSCR). A project might show an attractive IRR but if cash flows are volatile or back-loaded, the DSCR in early years may be insufficient to meet lender requirements.
Investment attractiveness (IRR, NPV, whey plant return on investment) and debt-servicing ability (DSCR, cash-flow stability, working-capital adequacy) are distinct concepts. Lenders typically examine:
- Average DSCR (usually ≥1.25–1.50 over the loan repayment period)
- Minimum DSCR in any single year (usually ≥1.10)
- Debt–equity ratio and promoter contribution
- Collateral security and personal guarantees
- Length of repayment period relative to asset life
- Cash-flow stability and sensitivity under adverse conditions
- Management capability and track record in dairy products
- Raw-material tie-ups and marketing arrangements
A project with a robust IRR but very tight DSCR or highly volatile cash flows may still face difficulty securing debt or may be approved only with stricter conditions. Whey processing project bankability requires demonstrating both return potential and repayment comfort.
Common Errors in Whey Project Return Analysis
Several recurring errors in financial projections can give promoters an overly optimistic view of whey processing plant ROI, IRR and payback:
- Assuming near-100% capacity utilisation in Year 1 or 2 without justified whey supply or market demand
- Using selling prices without adjusting for freight, discounts, commissions or credit-period costs
- Underestimating whey transportation costs, seasonal variation or quality-related losses
- Overestimating protein or solids recovery beyond what pilot trials or vendor data support
- Ignoring high energy consumption in evaporation and spray drying, or using outdated utility tariffs
- Excluding membrane replacement costs from maintenance budgets (membranes have finite life)
- Ignoring working-capital interest or underestimating debtor days
- Omitting interest during construction from total project cost
- Treating depreciation as a cash outflow when computing IRR (depreciation is a non-cash charge)
- Using accounting profit in place of cash flow for IRR and NPV calculations
- Confusing simple ROI with IRR – these are fundamentally different metrics
- Ignoring loan repayment when calculating equity cash flows
- Applying an unsupported or very high terminal value without justification
- Presenting only a base-case projection with aggressive assumptions and no downside sensitivity
In research and published data, some economic analysis studies report high ROI figures. For instance, one published study on whey protein-based biodegradable plastics showed an ROI of 42.24% with a payback time of 2.37 years for a total capital investment of $19.13 million. While whey can be converted into biodegradable plastics and other novel products, such results are specific to that particular process and scale, and should not be assumed as transferable to every whey processing plant project.
How a Professional DPR Strengthens Investment Evaluation
In my experience of preparing project reports since 2006, a professionally prepared Detailed Project Report for a whey plant integrates technical design and financial modelling into a coherent decision document. Financial projections prepared in isolation – without linking them to actual equipment specifications, process yields and vendor quotes – frequently fail to withstand scrutiny during bank appraisal.
A comprehensive DPR should cover:
- Plant capacity and whey processing plant manufacturing process details
- Product recovery and yields, benchmarked to trials or established data
- Detailed capital cost and whey processing plant project cost and means of finance
- Product-wise revenue assumptions with market support
- Detailed operating expenses, including raw material costs, energy, labour and quality control
- Working-capital assessment
- Projected P&L, balance sheet and cash-flow statements
- DSCR calculation over the loan repayment period
- Break-even analysis with margin of safety
- ROI, project IRR, equity IRR, NPV and payback period
- Structured sensitivity and whey processing project risk analysis
Financial projections should be traceable back to technical assumptions – for example, kWh per kg of whey powder, protein content of incoming whey, steam consumption per kg of water evaporated – rather than prepared as a standalone spreadsheet exercise.

Practical Recommendations for Project Promoters
Before finalising a whey processing plant investment, promoters should take the following steps:
- Secure dependable whey-supply tie-ups with signed or at least provisional agreements, or integrate with own cheese or paneer plant to control raw material flow.
- Validate product recovery through technical trials or credible references from similar plants, and document these in the DPR.
- Obtain current quotations for key plant machinery, utility equipment, civil construction and imported components, accounting for foreign exchange risk.
- Develop product-wise market realisation assumptions with conservative net prices, informed by current price trends and the competitive landscape.
- Use a conservative capacity ramp-up schedule and build contingencies for both project cost (10–15% buffer) and operating expenses.
- Assess working-capital needs separately, including realistic debtor days and seasonal inventory build-up.
- Test multiple adverse scenarios – lower prices, lower utilisation, higher costs – in the whey processing plant financial projections before approaching banks.
- Compare both project IRR and equity IRR, and evaluate DSCR under base and downside cases.
- Treat the DPR and sensitivity analysis as living tools: compare actual monthly or quarterly performance with projections post-commissioning, update the model annually and take corrective actions early.
Monthly production of whey protein concentrate in the U.S. alone reached 18,600 tons in 2018, and 67% of whey is processed in the EU. India has enormous room to grow domestic capacity, but long term sustainability of any individual project depends on disciplined planning and realistic financial modelling.
Professional Assistance from CA Manish Gugliya and ProjectReportBank
As CA Manish Gugliya, FCA and DISA (ICAI), I assist dairy entrepreneurs, cheese and paneer processors and investors in preparing customised whey processing plant DPRs and financial projections. My professional support covers:
- Project-cost evaluation and means-of-finance planning
- Cash-flow modelling, ROI and IRR calculations
- NPV analysis, payback and DSCR assessment
- Structured sensitivity and scenario testing for bankability
- Preparation and review of CMA data
- MSME advisory and project finance assistance
I do not certify future performance or guarantee any specific return. All projections are prepared based on assumptions provided by the promoter and verified against available market and technical data.
If you are planning a whey powder, WPC, WPI, lactose or integrated whey processing project in India, I invite you to seek a project-specific financial assessment and DPR through www.projectreportbank.com. Please share your tentative plant capacity, intended manufacturing process and approximate project budget when reaching out, so that an appropriately detailed whey processing project ROI and IRR analysis can be developed for your specific situation.
Frequently Asked Questions
The following FAQs address additional practical queries that typically arise when promoters begin working on a whey processing plant investment in India. Answers are general in nature and cannot substitute for a project-specific DPR or professional advice.
What basic data do I need before starting a whey processing project ROI and IRR analysis?
Promoters should first compile realistic estimates of daily whey availability (litres and composition), proposed plant capacity, intended product mix (whey powder, WPC, WPI, lactose), indicative machinery quotations, land and building cost, and expected selling prices from buyers or distributors. Reliable estimates of utility tariffs, labour cost, whey purchase price (if buying externally) and expected credit terms from customers and suppliers are also necessary to build credible cash-flow projections. Whey protein concentrate has a protein content ranging from 30% to 85%, and knowing the exact grade you intend to produce affects every assumption downstream.
Over how many years should financial projections be prepared for a whey processing plant DPR?
For medium- to large-scale whey plants with significant capital expenditure, projections are typically prepared for 8–10 years, and sometimes up to 12 years, to adequately capture the benefit of the assets’ economic life. The choice of projection horizon should roughly align with the repayment period of the main term loan, so that lenders can see cash-flow coverage over the full loan tenor.
Can a small or medium dairy justify a separate whey processing unit?
It can be feasible, but only if the daily whey volume, quality and logistics cost support a minimum efficient plant size, and if the incremental CAPEX and OPEX are justified by product realisations and by savings on effluent-treatment costs. Whey waste disposal costs can be substantial for dairies, so converting waste into revenue changes the economic analysis significantly. Smaller dairies often start with simpler whey powder projects or consider collaborative models such as common processing facilities, and should definitely run a detailed feasibility and sensitivity analysis before committing investment. Products such as high quality infant formula ingredients or specialised dairy products for industrial use typically require larger-scale operations and higher investment.
How frequently should I update my whey processing plant financial model?
During the planning stage, the model should be updated whenever major assumptions change – such as equipment quotes, interest rates or expected whey purchase price. After commissioning, I recommend comparing actual performance with DPR projections at least quarterly, updating the model annually for changes in prices, costs and capacity utilisation to keep ROI, IRR and DSCR estimates current. Muscle growth supplements and high nutritional products command premium pricing that can shift with the competitive landscape and market breakup across channels.
Is it necessary to build separate models for domestic and export-focused whey products?
While a single integrated model can be used, it is usually prudent to model domestic and export sales separately within the same workbook, because each may have different prices, logistics costs, credit periods and currency risks. Scenario analysis can then test shifts in sales mix between domestic and export markets and their combined impact on whey processing plant investment returns and risk.