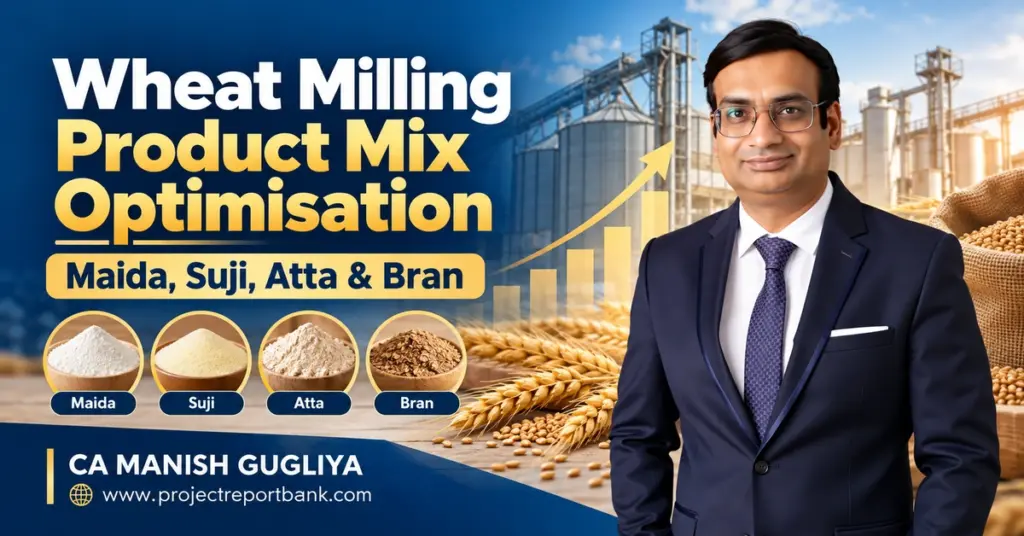
Key Takeaways
- Two wheat flour mills with the same processing capacity can generate very different revenue and profitability depending on their maida, suji, atta and bran product mix, pricing strategy and working capital management.
- Wheat milling product mix optimisation means maximising contribution per tonne of wheat processed, not simply increasing total production volume or chasing the single highest-priced product.
- This article presents a worked 100 TPD flour mill example comparing three product mix scenarios (A, B and C) with revenue, contribution and EBITDA impact to demonstrate how small per-tonne improvements scale into large annual differences.
- Adopting a structured product-mix optimisation model, supported by sensitivity analysis and realistic extraction assumptions, can materially improve financial outcomes for Indian flour mill promoters.
- Project Report Bank, led by CA Manish Gugliya, FCA, DISA (ICAI), prepares customised detailed project reports, feasibility studies and financial models for wheat flour mill product mix optimisation across India.
Introduction – Why Wheat Milling Product Mix Optimisation Matters
A modern roller flour mill in India can process wheat to produce maida, suji, atta and bran from the same plant. Yet two mills of identical capacity, using similar equipment and processing the same raw materials, can report significantly different revenue per tonne and annual EBITDA. The difference almost always traces back to product mix decisions.
Consider a typical Indian roller flour mill operating at 50 to 200 TPD. Each output stream – refined maida, semolina (suji), whole wheat atta and wheat bran – carries a different selling price, demand pattern, packaging requirement and margin profile. The financial levers that determine profitability include extraction rates, wheat procurement cost, product quality specifications, achievable selling prices, by-product realisation, processing cost per tonne and the working capital cycle.
This article focuses specifically on revenue maximisation, product-wise contribution analysis, DSCR impact, ROI, IRR and sensitivity analysis for wheat milling product mix decisions. For detailed capacity and yield fundamentals, readers may refer to Maida & Suji Plant Capacity Planning, Yield & Product Mix.
The perspective here is that of CA Manish Gugliya, a practising Chartered Accountant with more than 20 years of experience in detailed project reports, CMA data preparation, feasibility studies and bank finance advisory for manufacturing projects. Optimizing product mix in wheat milling involves balancing raw material constraints and market demands – a process that requires both technical understanding and rigorous financial modelling.
The key financial levers include:
- Extraction efficiency and achievable product yields
- Wheat quality and procurement price
- Product-wise selling prices net of discounts and freight
- By-product (bran) realisation and value addition
- Packaging, distribution and working capital cycle
- Sensitivity to price fluctuations and capacity utilisation
Understanding the Product Mix in Wheat Milling
An industrial roller flour mill does not produce one product at a time. The milling process simultaneously generates multiple output streams – maida, suji, atta, bran and minor by-products such as pollard, screenings and dust. The plant can produce maida, suji, atta and bran from wheat in a continuous, integrated flow.
Product shares are constrained by mill flow design, sifting stages, purification capacity and quality specifications. While millers can tilt production slightly toward one product within technical limits, they cannot arbitrarily convert all wheat into only one output. Typical combined flour and suji extraction ranges between 72% and 78% of cleaned wheat, with bran and by-products accounting for 20–26% by weight.
The sections below describe each product’s commercial role. Later sections connect each product’s yield with its contribution margin and impact on overall wheat flour mill profitability.
Maida – Refined Wheat Flour and Commercial Applications
Maida is fine, low-ash refined wheat flour used extensively in bread, pastries, cookies, biscuits, noodles, pasta and many industrial food applications. It generally commands the highest price among flour streams, with all-India average retail prices around ₹42.83 per kg according to recent Department of Consumer Affairs monitoring data.
Higher maida recovery requires careful wheat selection, tighter roll gap settings and more intense purification – increasing processing cost but enabling premium realisation. Stricter specifications on ash content, colour and gluten strength mean that not every wheat variety or every mill configuration can achieve high-grade maida efficiently.
Key commercial aspects of maida:
- Industrial buyers (bakeries, biscuit plants) offer stable offtake but may demand credit terms of 15–30 days
- Branded retail maida requires packaging investment and marketing expenditure
- Higher maida share typically reduces suji or coarser flour output, affecting the product mix balance
- Flour extraction rates vary depending on the end-products produced; pushing maida extraction above 50–55% often encounters diminishing returns
For entrepreneurs focusing on maida-oriented plants, a Maida Manufacturing Plant Project Report & DPR provides the necessary investment and technical framework.
Suji – Semolina and Value-Added Market Opportunities
Suji (semolina) consists of coarser endosperm particles used in rusk, pasta, vermicelli, breakfast mixes, namkeen and other value-added products. Recent retail prices average approximately ₹47.74 per kg nationally, reflecting strong demand from food processors and households alike.
Suji commands good prices but may have lower volume demand than maida or atta in some regional markets. Excessive suji output without confirmed downstream buyers can lock working capital in unsold inventory.
- Institutional processors (pasta units, vermicelli manufacturers) can provide stable offtake
- Retail suji in 500 g to 1 kg packs requires packaging and distribution infrastructure
- Market segmentation ensures a diverse portfolio catering to different customer demands – both institutional and retail
- Where demand is strong, increasing suji cut can be highly profitable
The Suji Manufacturing Plant Project Report & DPR covers integrated suji-based value-added products for enhanced project viability.
Atta – Whole Wheat Flour and Consumer Demand
Atta is the staple wheat flour for chapatis and household consumption across India. Demand is strong, relatively stable across seasons and less vulnerable to fashion-driven shifts compared to other cereals or specialty flours.
In integrated roller flour mills, atta is typically produced as a higher-extraction, slightly darker flour compared to maida, sold at moderate prices but with faster turnover and quicker cash conversion.
- Branding, 5 kg and 10 kg consumer packs, and dealer networks improve atta realisation but also increase marketing, packaging and receivable days
- Many mills use atta as a base-load volume product to maintain capacity utilisation, while maida and suji contribute additional margin
- Regulatory standards, including guidance issued by the civil supplies department in the concerned state, can impact the types of mixed flours that can be legally sold under specific atta designations
- Store-level distribution and consumer brand equity require sustained investment
Wheat Bran – By-Product Revenue and Value Addition
Milling creates by-products like bran and pollard which can influence overall profitability far more than many promoters realise. Wheat bran – the outer layer separated during milling – is mainly sold to cattle-feed and poultry-feed manufacturers, with recent feed-grade prices around ₹22 per kg in Indian feed raw material markets.
While bran price per tonne is lower than refined flour, its quantity is significant – typically 20–25% of wheat input by weight. Small improvements in bran realisation (₹100–₹200 per MT) can meaningfully change revenue per tonne of wheat processed. By-product management strategies can enhance overall returns from milling operations.
- Clean, consistent bran with controlled moisture and particle size attracts better-paying buyers
- Value-added options include bran pellets, de-oiled bran or dietary-fibre ingredients, but these require additional investment
- The Wheat Bran Processing & Value Addition Project Report covers separate feasibility analysis for bran-based diversification
- Bran should never be treated as a negligible by-product in the financial model of a flour mill
Wheat Milling Extraction Rate, Yield and Product Recovery
The overall flour extraction rate refers to the percentage of total flour and suji obtained from cleaned wheat. This is distinct from individual maida, suji or atta yields within that flour portion. Wheat characteristics dictate milling outputs such as flour grades and by-products – hard wheat, soft wheat, moisture levels and protein content all affect what the mill can achieve.
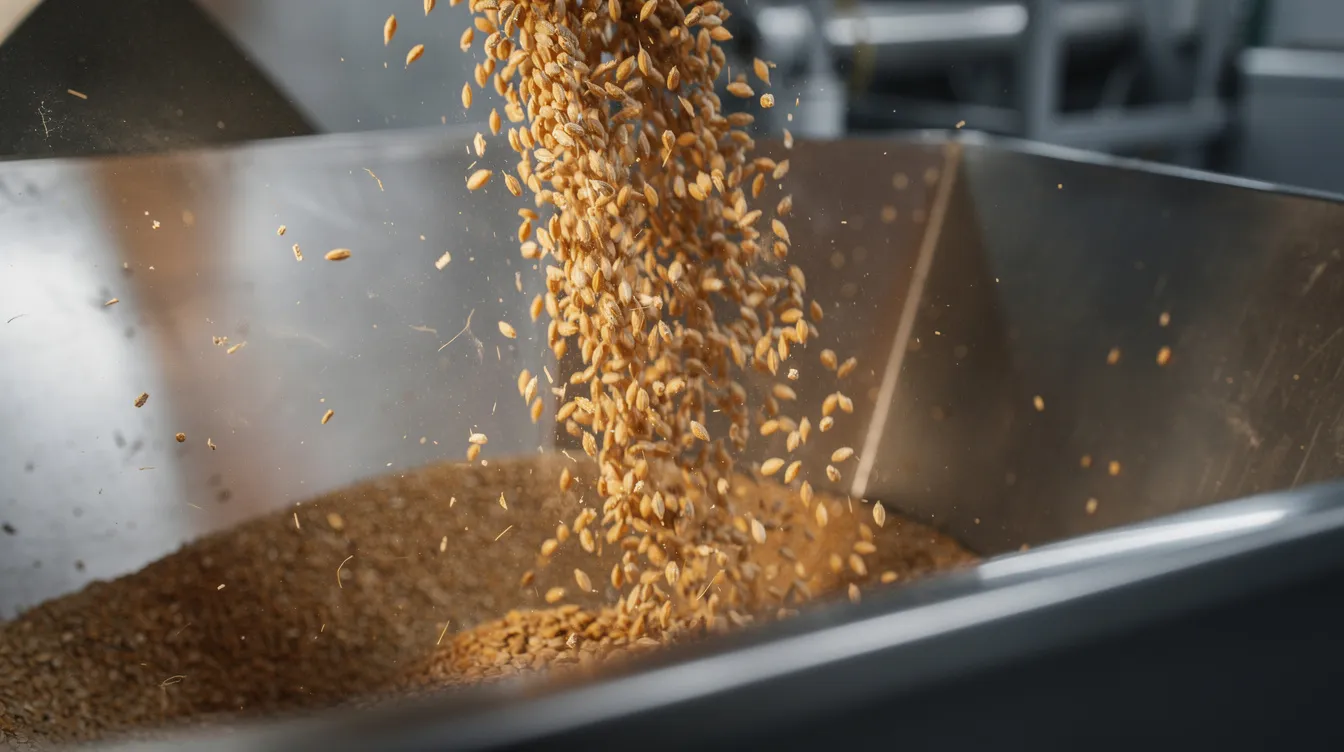
Flour extraction efficiency is crucial for optimizing milling processes. A CFTRI Mysuru pilot mill study using medium-hard wheat at approximately 15% moisture achieved 72% flour extraction with 25–26% bran yield.
Illustrative mass balance from 1,000 kg of wheat:
| Output | Approximate Yield |
|---|---|
| Maida (refined flour) | 540 kg (54%) |
| Suji (semolina) | 90 kg (9%) |
| Atta (whole wheat flour) | 85 kg (8.5%) |
| Bran and by-products | 245 kg (24.5%) |
| Process losses (moisture, dust) | 40 kg (4%) |
| Total | 1,000 kg |
These figures are hypothetical and depend on wheat quality, tempering, mill design and target product specifications. The role of tempering – adding moisture before milling and managing moisture loss during processing – affects reconciliation between wheat input and product output weights. Serious project decisions should rely on plant-specific trials and professional feasibility studies.
What Is the Most Profitable Maida, Suji, Atta and Bran Product Mix?
There is no single ideal maida suji atta bran production ratio that suits every flour mill. The best mix depends on local wheat quality, final product specifications, market demand, plant size, sales strategy and the promoter’s financial objectives.
Profitable product mix optimisation means maximising contribution per tonne of wheat processed over a sustained period – not simply producing more of the highest-priced item. A mill that pushes maida extraction to 60% but cannot sell the additional output without steep discounts may generate less contribution than one producing 45% maida with stable industrial contracts.
The main drivers of an optimal mix include:
- Wheat procurement price, quality and consistency of supply
- Technical constraints of the roller flour milling system (purifiers, plansifters, roll gaps)
- Target ash content, protein and quality specifications demanded by buyers
- Regional consumer preferences – atta-dominant markets vs maida-dominant industrial clusters
- Packaging formats, logistics costs and achievable net selling prices
- Bran market strength and by-product realisation
- Credit terms, receivable cycles and working capital intensity
The following 100 TPD numerical example demonstrates these points with specific figures.
Product-Wise Revenue and Profitability Analysis
The core revenue formula for a wheat flour mill is:
Total Revenue = (Maida Qty × Maida Realisation) + (Suji Qty × Suji Realisation) + (Atta Qty × Atta Realisation) + (Bran Qty × Bran Realisation)
Here, quantities are in MT and realisations in ₹ per MT. “Realisation” means the net amount received after trade discounts, freight borne by the mill, promotional schemes and selling expenses. Ex-mill industrial realisations are typically 20–30% below consumer retail prices.
Moving from revenue to contribution requires subtracting: wheat cost allocated per tonne, power and fuel per tonne, packing material, milling labour, direct selling costs and product-specific freight. The result is product-wise contribution margin.
It is important to understand the progression:
- Gross profit = Revenue minus direct material and processing costs
- Contribution = Revenue minus all variable costs
- EBITDA = Contribution minus fixed operating expenses (rent, salaries, administration)
- Net profit = EBITDA minus interest, depreciation and tax
Baking flour, incidentally, is the least profitable product among wheat products in many Indian mills, which is why understanding product-wise margins – rather than average gross profit per tonne – is essential. Professional Financial Projections & Financial Modelling Services use this product-wise approach to build defensible DPR projections.
Practical Example – 100 TPD Wheat Flour Mill Product Mix Optimisation
Base assumptions:
- Plant capacity: 100 TPD of wheat
- Operating days: 300 per year
- Annual wheat processed: 30,000 MT
- Wheat purchase price: ₹25,000 per MT (delivered to the facility)
- All realisations are ex-mill, exclusive of GST
Assumed realisations (₹ per MT):
| Product | Ex-Mill Realisation |
|---|---|
| Maida | ₹40,000 |
| Suji | ₹38,000 |
| Atta | ₹32,000 |
| Bran & by-products | ₹22,000 |
Processing and selling cost assumption: ₹3,500 per MT of wheat (covering power, fuel, labour, packaging, freight, maintenance)
Scenario A – Conventional Balanced Mix
| Parameter | Scenario A |
|---|---|
| Maida | 30% (30 MT/day) |
| Suji | 15% (15 MT/day) |
| Atta | 30% (30 MT/day) |
| Bran & by-products | 22% (22 MT/day) |
| Process losses | 3% (3 MT/day) |
| Revenue per MT of wheat | ₹31,340 |
| Annual revenue | ₹94.02 Cr |
| Annual wheat cost | ₹75.00 Cr |
| Processing & selling cost | ₹10.50 Cr |
| EBITDA (approx.) | ₹8.52 Cr |
Scenario B – Higher Realisation Focus
The mill adjusts its process to increase maida and suji share within technical limits, reducing atta. This may require better wheat quality and more intensive purification.
| Parameter | Scenario B |
|---|---|
| Maida | 45% (45 MT/day) |
| Suji | 20% (20 MT/day) |
| Atta | 7% (7 MT/day) |
| Bran & by-products | 25% (25 MT/day) |
| Process losses | 3% (3 MT/day) |
| Revenue per MT of wheat | ₹33,540 |
| Annual revenue | ₹100.62 Cr |
| Annual wheat cost | ₹75.00 Cr |
| Processing & selling cost | ₹11.10 Cr (higher purification cost) |
| EBITDA (approx.) | ₹14.52 Cr |
Scenario C – Market-Balanced, Contribution-Optimised
This scenario balances plant capability with local demand absorption – slightly lower maida than Scenario B but stronger suji and bran realisation through secured offtake contracts.
| Parameter | Scenario C |
|---|---|
| Maida | 38% (38 MT/day) |
| Suji | 22% (22 MT/day) |
| Atta | 13% (13 MT/day) |
| Bran & by-products | 24% (24 MT/day) |
| Process losses | 3% (3 MT/day) |
| Revenue per MT of wheat | ₹33,200 |
| Annual revenue | ₹99.60 Cr |
| Annual wheat cost | ₹75.00 Cr |
| Processing & selling cost | ₹10.80 Cr |
| EBITDA (approx.) | ₹13.80 Cr |
Comparison Summary
| Metric | Scenario A | Scenario B | Scenario C |
|---|---|---|---|
| Revenue per MT of wheat | ₹31,340 | ₹33,540 | ₹33,200 |
| Annual revenue (₹ Cr) | 94.02 | 100.62 | 99.60 |
| EBITDA (₹ Cr) | 8.52 | 14.52 | 13.80 |
| EBITDA per MT of wheat | ₹2,840 | ₹4,840 | ₹4,600 |
The difference between Scenario A and Scenario B is approximately ₹6.00 crore in annual EBITDA – driven by a shift of just 15 percentage points from atta to maida and 5 points to suji. Scenario C, while slightly below Scenario B in EBITDA, may be more achievable where local suji demand is strong and full maida offtake at premium prices is uncertain.
These results demonstrate why promoters planning a wheat milling project should carefully evaluate product mix assumptions before finalising machinery orders or approaching banks. For customised financial modelling, promoters may consider professional Bank Finance DPR & Loan Proposal Assistance.
How to Optimise Wheat Milling Revenue Per Tonne
The weighted average selling price per tonne of wheat is the single most important revenue metric for a flour mill. Both better prices and better product mix can increase this figure without necessarily increasing plant capacity.
Practical levers include:
- Improving flour grades and consistency through better wheat cleaning and conditioning to obtain premium maida or suji realisation
- Segmenting customers: bulk institutional buyers vs wholesalers vs branded retail, each with different price and credit profiles
- Selecting sales channels with lower credit risk and faster collections
- Reducing process losses and rejections through better moisture management
- Optimising packaging sizes to match market willingness to pay
- Timing wheat procurement to reduce average raw material cost – India exported 200,000 tonnes of wheat in 2021, and domestic supply-demand dynamics affect procurement windows
- Monitoring key performance indicators such as extraction rate, ash content, revenue per tonne and product-wise contribution helps track milling efficiency and profitability continuously
Linear programming and other quantitative techniques can also optimise wheat flour production processes when multiple wheat varieties and product specifications are involved simultaneously.
Wheat Bran Revenue Optimisation and Value Addition
Bran accounts for 20–25% of wheat input by weight – a volume too large to ignore in any serious profitability analysis. A ₹200 per MT improvement in bran realisation across 7,200 MT of annual bran output (in a 100 TPD mill) adds approximately ₹14.4 lakh to annual revenue.
Simple optimisation steps:
- Better segregation of pure bran from screenings and pollard
- Efficient bulk handling to reduce spillage and storage losses from moisture or pests
- Negotiating long-term offtake agreements with established feed manufacturers
- Maintaining consistent particle size and moisture to command better prices
Higher-level value addition – bran pellets, de-oiled bran, dietary-fibre ingredients – requires separate capital investment, additional raw materials processing and new market development. These should not be assumed in the base wheat flour mill DPR unless supported by a separate feasibility study and realistic market survey.
Product Mix Optimisation Through Machinery and Process Planning
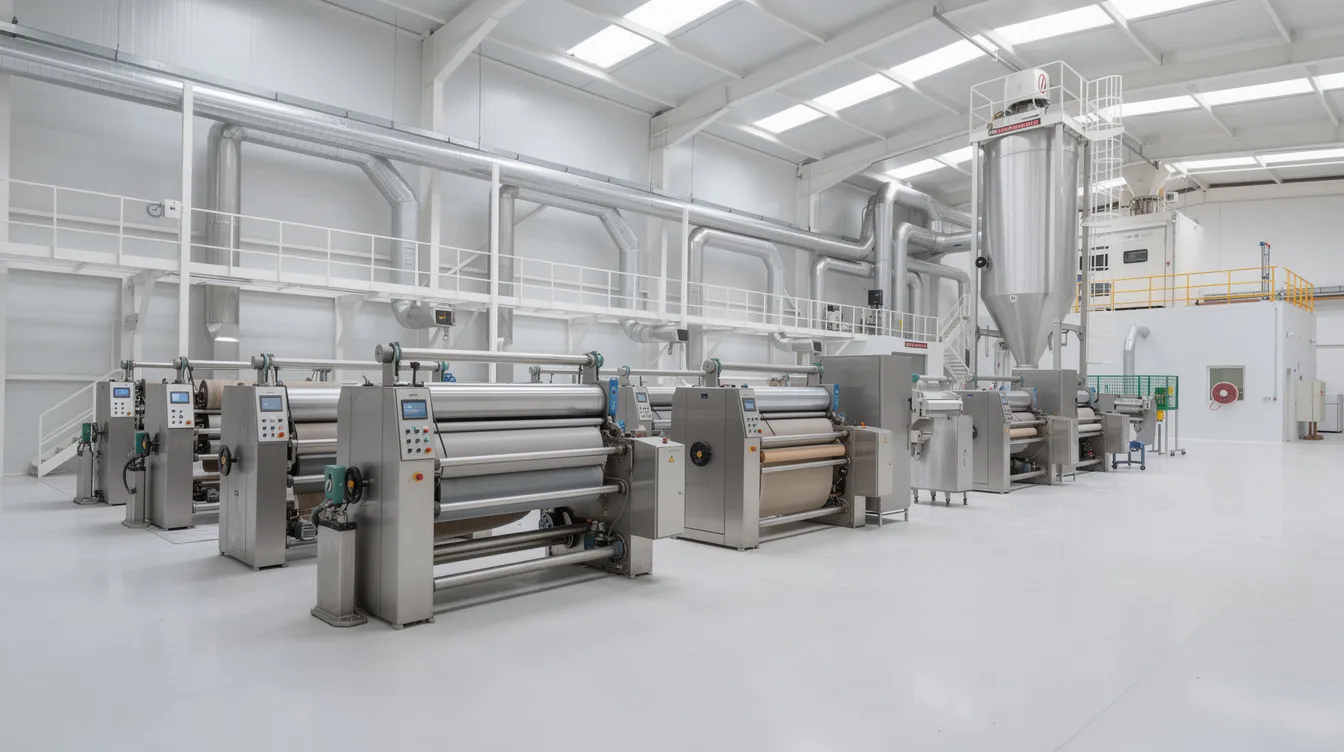
The main sections of a roller flour mill – wheat cleaning, tempering, break system, reduction system, purification and sifting – collectively determine how effectively wheat is separated into maida, suji, atta and bran streams.
Millers can fine-tune break and reduction roll gaps, sifter mesh selection and purifier air flows to slightly change product yields. Milling adjustments are made in micrometers and milligrams for precision – even small changes in roll gap or sieve aperture affect ash content and product grade. However, major shifts in product mix require appropriate equipment capacity, additional purifiers or fundamentally different flowsheets.
Operational constraints like available milling capacity, number of purification stages and plansifter area directly affect product diversification. A mill without purifiers will struggle to produce low-ash maida regardless of roll gap settings.
This is why machinery specifications in the DPR stage should be based on the targeted product mix and local market demand, not just overall wheat milling capacity. Unrealistic claims – such as 80% maida extraction with perfect quality from any wheat – often lead to DPR rejection during technical scrutiny by banks. For detailed process and equipment guidance, the Maida & Suji Manufacturing Process & Flow Chart provides useful reference.
Product Mix Optimisation and Working Capital Requirements
Product mix affects working capital in ways that are not always obvious. A mill emphasising branded atta in consumer packs typically requires larger finished goods inventory (30–45 days), longer distributor credit (30–45 days receivables) and higher packing material stock. In contrast, bulk maida and suji sold to industrial users may involve 15–30 days receivables and simpler packaging.
Illustrative working capital comparison:
| Parameter | Mix 1 (Consumer Atta Focus) | Mix 2 (Bulk Maida-Suji Focus) |
|---|---|---|
| Finished goods inventory days | 30–45 days | 10–15 days |
| Debtor (receivable) days | 30–45 days | 15–30 days |
| Packing material inventory | Higher (printed packs) | Lower (plain bags) |
| Estimated working capital | ₹18–20 Cr | ₹14–16 Cr |
The working capital requirement for a 300 TPD flour mill can be as high as Rs. 17.86 Cr, which underscores the importance of aligning working capital estimation with the chosen product mix. CMA data prepared for bank loans must reflect realistic inventory and debtor levels derived from the specific product and customer strategy.
A mix with slightly lower EBITDA but much lower working capital intensity can still provide stronger DSCR and safer cash flows for lenders, as explained in Maida & Suji Plant Financial Projections, Working Capital & DSCR.
Effect of Product Mix on DPR, DSCR, ROI and Project IRR
The assumed maida–suji–atta–bran production ratio directly affects projected sales volume, average selling price per MT, gross margin and ultimately EBITDA in any detailed project report. A DPR includes financial projections for 5 to 10 years, and the product mix assumption runs through every year of those projections.
DSCR is calculated from cash flows after interest, principal repayment and taxes – not directly from EBITDA. An overly optimistic product mix can inflate projected DSCR and create risk for both promoter and lender. The expected rate of return for a well-structured roller flour mill project can reach 41%, but this depends entirely on realistic extraction and pricing assumptions.
A DPR includes a market survey and techno-economic feasibility report, and banks expect these to substantiate the assumed product mix. The total capital investment for a 300 TPD flour mill is Rs. 37.92 Cr – a commitment that demands rigorous analysis of how product mix assumptions translate into return on investment and project IRR.
What lenders and investors typically review:
- Reasonableness of product mix versus technical norms and industry benchmarks
- Match between assumed product mix and documented market survey or offtake arrangements
- Linkage between product mix, working capital requirement and cash conversion cycle
- DSCR trends across projection years – whether they improve or deteriorate
- Project IRR robustness under downside scenarios
For detailed viability analysis frameworks, the Maida & Suji Plant Feasibility Study & Project Viability guide offers practical reference.
Sensitivity Analysis – What Happens When Prices or Yields Change?
No product mix remains optimal under all conditions. Business conditions change – wheat prices fluctuate, selling prices come under pressure, extraction rates vary with wheat quality and power costs rise.
Using Scenario C from the 100 TPD example (EBITDA ₹13.80 Cr), here is how adverse changes affect results:
| Sensitivity Variable | Change | Impact on Annual EBITDA |
|---|---|---|
| Wheat price +5% (₹1,250/MT) | Higher raw material cost | –₹3.75 Cr (EBITDA drops to ₹10.05 Cr) |
| Average selling price –5% | Lower product realisation | –₹4.98 Cr (EBITDA drops to ₹8.82 Cr) |
| Extraction rate –2 percentage points | More bran, less flour | –₹1.20 Cr approx. |
| Capacity utilisation –10% | Lower production volume | –₹1.38 Cr approx. |
| Combined: wheat +5% and selling price –3% | Both adverse | –₹6.74 Cr (EBITDA drops to ₹7.06 Cr) |
The break-even point for a roller flour mill project is approximately 39%, meaning the mill needs to operate above roughly 39% of capacity to cover all fixed and variable costs. A product mix that appears profitable at 85% utilisation may become unviable below 50%.
Professional DPRs and CMA data for wheat flour mills should always include such sensitivity checks before finalising debt size and repayment schedules.
Product Mix Strategies for 50 TPD, 100 TPD and 200 TPD Flour Mills
Plant scale significantly influences feasible product strategy. A smaller 50 TPD flour mill may focus on a simpler mix – predominantly atta with some maida – serving local markets with limited suji output, constrained by capital and sales reach.
A 100 TPD plant can balance bulk institutional maida and suji supplies with regional atta brands, achieving moderate diversification that stabilises cash flows. This is often the sweet spot for developing a market position across multiple product categories.
For 200 TPD and higher capacities, the roller flour mill can process 300 MT of wheat daily at the upper end, enabling multiple product lines, separate silos for different wheat grades and more advanced process control. Dedicated lines for bakery flour or specialised suji become feasible at this scale – the Bakery Flour Manufacturing Plant Project Report & DPR addresses specialised flour diversification.
Scale allows more flexibility in product mix optimisation but also demands stronger marketing arrangements, higher working capital and more systematic project planning. CMA data is essential for bank loan applications at every scale.
Common Mistakes in Wheat Milling Product Mix Planning
Promoters and project planners frequently make errors that affect both the credibility of their DPR and the eventual profitability of the project:
- Assuming unrealistically high maida or suji extraction percentages (e.g., 65% maida) without technical backing, ignoring that bran and process losses impose hard constraints on mass balance
- Focusing only on headline selling prices without calculating product-wise contribution margin – a product with a high price but high processing and freight cost may contribute less than expected
- Underestimating bran realisation and treating it as a negligible by-product instead of a revenue stream worth ₹1.5–2 crore annually in a 100 TPD mill
- Ignoring local market demand and assuming all extra maida or suji can be sold at the same price irrespective of increased supply and competition from other mills
- Presenting inconsistent or arithmetic-error-filled assumptions in DPRs – total output exceeding wheat input or missing moisture adjustments – which immediately reduces credibility with banks
- Not aligning working capital estimation with the chosen product mix, especially for branded atta requiring longer credit periods
- Omitting sensitivity analysis on wheat prices, selling prices and utilisation, leading to over-optimistic DSCR and IRR estimations
- Copying generic PDF project profiles or templates instead of commissioning a customised detailed project report suited to the specific location, capacity and market of the proposed mill
How CA Manish Gugliya and Project Report Bank Support Wheat Milling Projects
Project Report Bank is a Chartered Accountant-led project finance advisory practice specialising in customised DPRs, feasibility studies, financial projections, CMA data and bank loan documentation for manufacturing projects across India, including wheat flour mills of various capacities.
For wheat milling product mix optimisation, the firm builds detailed financial models showing product-wise yields, revenues, costs, working capital and sensitivity to wheat prices and selling prices – aligned with what banks and financial institutions expect in a bankable project report.
Key deliverables for flour mill promoters:
- Customised detailed project report with realistic product mix, extraction and pricing assumptions
- Product-wise contribution margin analysis and EBITDA modelling
- Working capital assessment and DSCR analysis tailored to maida–suji–atta–bran mixes
- Sensitivity analysis covering wheat cost, product prices, utilisation and extraction changes
While CA Manish Gugliya’s team analyses numbers and prepares professional documentation to serve the objectives of the promoter, they do not guarantee bank approval or certify future profits. Investment results ultimately depend on market performance, operational execution and lender policies.
Serious promoters planning 50–200 TPD wheat flour mills may contact Project Report Bank through the official website for customised DPR preparation and financial modelling.
Conclusion – Optimising Profitability from Every Tonne of Wheat
Maximum profitability in a wheat milling plant does not come from higher capacity alone. It comes from the disciplined process of optimising maida, suji, atta and bran product mix, extraction efficiency, pricing strategy and working capital management – and then validating these assumptions through rigorous financial analysis.
A robust flour mill project in India requires realistic yield assumptions grounded in wheat quality and mill design, well-researched market demand validated through a proper market survey, product-wise contribution analysis, DSCR and IRR evaluation across the projection period, and sensitivity checks on key variables that could change the results.
Product mix planning is an integrated technical and financial decision, best evaluated before finalising machinery orders or approaching banks for finance. The summary of objectives for any wheat milling entrepreneur should be clear: understand the numbers, start with defensible assumptions and produce documentation that tells a logical business story.
Entrepreneurs and MSME owners planning wheat flour mill projects across India are encouraged to connect with Project Report Bank for customised DPRs, CMA data preparation, feasibility studies and product mix optimisation analysis through the official website and published WhatsApp contact details.
FAQs – Wheat Milling Product Mix Optimisation
The following FAQs address additional practical questions not fully covered in the main body of this article.
Can a flour mill freely choose any maida, suji, atta and bran ratio it wants?
No. A roller flour mill cannot arbitrarily decide its product ratio. Yields are constrained by wheat quality, milling system design, purifier and plansifter configuration and required product specifications. Optimisation usually happens within a feasible range – for example, shifting 5–10 percentage points between maida and atta. Large changes typically require major machinery and process modifications that should be evaluated in a detailed project report before implementation.
How much maida, suji, atta and bran typically come from 1,000 kg of wheat?
Actual yields vary significantly by wheat variety, moisture content and mill design. A plausible illustrative example: combined flour and suji in the 70–78% range and bran and other by-products in the 20–25% range, with 2–4% process losses. For instance, one benchmark shows approximately 540 kg maida, 90 kg suji, 85 kg atta and 245 kg bran from 1,000 kg of wheat. Serious project decisions should rely on plant-specific trials, manufacturer data and professional feasibility analysis rather than generic numbers.
Which wheat milling product usually has the highest margin?
Apparent selling price is not the same as margin. While maida or specialised bakery flour may have higher prices per tonne, they also require stricter quality control, better wheat, more purification energy and sometimes longer credit periods. In some markets, suji or branded atta can give better contribution after accounting for raw material allocation, processing cost, packaging, freight and marketing. Product-wise costing within a financial model is the only reliable way to determine which product truly contributes most to profitability.
When should a promoter seek professional help for product mix planning?
Promoters should seek professional DPR and financial modelling support when they are deciding plant capacity, machinery configuration or target markets – ideally before placing machinery orders or approaching banks for term loans and working capital. At this stage, a professional advisory firm can evaluate different maida–suji–atta–bran scenarios, model their effect on DSCR and IRR, and present a bankable case aligned with realistic technical and market assumptions.
Why is sensitivity analysis important in wheat milling project reports?
Sensitivity analysis reveals how changes in key variables – wheat procurement price, product selling prices, extraction rates, power costs or capacity utilisation – affect profitability, cash flow and loan repayment capacity. A product mix that appears highly profitable under base assumptions may become financially stressed if wheat prices rise 5% while selling prices drop 3% simultaneously. Banks expect to see this analysis in the DPR before approving project finance, and promoters need it to understand the true risk profile of their investment.