Key Takeaways
This article explains how to convert installed wheat milling capacity (TPD) into realistic maida, suji, atta and bran output, and how this conversion directly links to profitability, working capital requirements and bankable financial projections.
- A 100 TPD flour mill processes 100 MT of wheat per day – it does not produce 100 MT of maida. Saleable maida output may be only 40–55 MT depending on extraction and utilisation.
- Extraction rates and product mix together determine the quantity and value of saleable output; small changes in yield or product mix can materially change profit per MT of wheat.
- Practical capacity utilisation is usually 60–90% of rated TPD, especially during the initial years of a new plant.
- Planning production capacity requires balancing market demand and financial viability – not merely selecting the largest available machinery.
All numerical examples (50 TPD, 100 TPD, 200 TPD) in this article are illustrative and must be validated in a customised detailed project report prepared for each specific project. Professional capacity planning combines technical parameters such as wheat quality and milling efficiency with financial modelling covering working capital, DSCR and sensitivity analysis. Project Report Bank provides advisory support for maida and suji plant DPRs, feasibility studies and financial projections.
Introduction – Why Capacity Planning Matters in Maida & Suji Manufacturing
Maida and suji manufacturing plants are commercial roller flour mills typically processing 50–200 TPD of wheat, supplying bakery flour, noodles, biscuit manufacturers, retail suji and rava markets across India. In the flour mill industry, “capacity” usually refers to wheat input per day – not maida or suji output. This distinction is frequently misunderstood by new entrepreneurs, leading to unrealistic production and revenue assumptions.
Installed capacity selection directly affects total capital investment: machinery cost depends on TPD, and civil construction and electrical setup contribute significantly to project costs. A higher TPD plant requires larger factory building space, more utilities, additional labour and substantially greater working capital for raw materials and finished goods inventory. Flour mill setup costs range from approximately ₹10 lakh to ₹2 crore depending on scale and automation.
A well-planned 50–75 TPD commercial flour mill running at 85–90% utilisation with realistic yields and strong market demand can outperform an oversized 200 TPD plant operating at 40–50% utilisation with poor extraction and weak sales realisation. Capacity should be designed based on realistic sales potential and demand variations. Project planning should incorporate demand forecasting and seasonal alignments to avoid committing capital to capacity that cannot be utilised. This article focuses on capacity, yield and product mix; separate articles cover plant setup cost and the manufacturing process and flow chart.
Understanding Installed Capacity, Operating Capacity and Actual Production
Installed wheat processing capacity is the maximum TPD the plant is designed to handle. Rated machinery throughput is expressed in MT per hour. Operating capacity reflects what the plant actually processes after accounting for downtime, and capacity utilisation is the percentage of installed capacity achieved. Saleable finished-product output is always lower than wheat input because flour extraction typically ranges between 72–78% of cleaned wheat, with bran and losses accounting for the remainder.
A 100 TPD commercial flour mill can process 100 MT of wheat in a 24-hour day – it does not produce 100 MT of maida or suji. Flour mills across India typically produce 5–120 TPD of flour depending on scale. Actual production is lower than theoretical due to cleaning losses, maintenance downtime, power interruptions, product changeovers and market-driven stoppages.
- A mini flour mill (5–20 TPD) may operate single shift; a small 10–20 TPD atta plant typically costs ₹15 lakh to ₹30 lakh, while a small flour mill of 5–10 TPD costs ₹10 lakh to ₹25 lakh.
- A medium roller flour mill (50–100 TPD) usually runs two to three shifts; a medium-scale flour mill costs around ₹35 lakh to ₹80 lakh.
- A large integrated flour milling complex (>200 TPD) operates near-continuously and large mills of 80–120 TPD may require ₹1 crore to ₹2 crore. Fully automatic flour mill plants cost between ₹50 lakh to ₹2 crore.
The base formula: Actual Wheat Milled per Day = Installed TPD × Capacity Utilisation %. This forms the foundation for all yield and product-mix planning.
What Does TPD Mean in a Maida & Suji Plant?
TPD means metric tonnes of wheat the plant is designed to process in one 24-hour production day. Net milling time is typically 20–22 hours after cleaning cycles and minor stoppages. A 100 TPD wheat flour mill runs at approximately 4.5 MT per hour assuming 22 hours of operation.
Annual capacity uses the formula: Annual Wheat Processing Capacity (MT) = TPD × Working Days. At 300 operating days:
| Plant Size | Hourly Throughput (TPH) | Annual Capacity at 100% |
|---|---|---|
| 50 TPD | ~2.3–2.5 | 15,000 MT |
| 100 TPD | ~4.5 | 30,000 MT |
| 200 TPD | ~9.1 | 60,000 MT |
Installed Capacity vs Achievable Capacity Utilisation
Even a new commercial flour mill rarely achieves 100% utilisation initially. Industry-wide data suggests average utilisation across organised Indian mills is approximately 55–65%. Banks typically assume 60–70% in the first year, rising toward 80–90% once the plant stabilises.
Key reasons for lower utilisation include mechanical breakdowns, power cuts, raw-wheat supply gaps, seasonal demand fluctuations and quality-related re-milling. OEE (Overall Equipment Effectiveness) provides a more detailed efficiency assessment than utilisation alone, factoring in availability, performance and quality losses.
Formula: Actual Daily Wheat Processing (MT) = Installed TPD × Capacity Utilisation (%)
| Utilisation | Daily Wheat (MT) | Annual Wheat (MT) at 300 Days |
|---|---|---|
| 70% | 70 | 21,000 |
| 80% | 80 | 24,000 |
| 90% | 90 | 27,000 |
(Illustrated for a 100 TPD plant)
Conservative utilisation assumptions in the first 2–3 project years are viewed positively by bankers and project appraisers.
Maida & Suji Plant Capacity Planning – 50 TPD, 100 TPD and 200 TPD
These three benchmarks cover small commercial to larger integrated plants. Production capacity significantly influences flour mill project cost, and capital investment planning includes both initial setup costs and operational expenses.
| Parameter | 50 TPD | 100 TPD | 200 TPD |
|---|---|---|---|
| Installed Capacity | 50 MT/day | 100 MT/day | 200 MT/day |
| Operating Hours/Day | ~22 | ~22 | ~22 |
| Hourly Wheat Requirement | ~2.3 TPH | ~4.5 TPH | ~9.1 TPH |
| Annual Capacity (100%) | 15,000 MT | 30,000 MT | 60,000 MT |
| At 70% Utilisation | 10,500 MT | 21,000 MT | 42,000 MT |
| At 80% Utilisation | 12,000 MT | 24,000 MT | 48,000 MT |
| At 90% Utilisation | 13,500 MT | 27,000 MT | 54,000 MT |
Entrepreneurs should choose capacity based on wheat procurement strength, confirmed demand for maida and suji, distance to key buyers, available equity, bank support and working capital comfort. Market demand should evaluate local and regional consumption patterns before finalising plant size. Utility and infrastructure analysis must include power and water availability at the proposed location. For capex estimation, refer to the dedicated article on maida and suji plant setup cost in India.
Wheat Milling Yield and Extraction Rate Explained
Extraction rate is the percentage of a specific product recovered from wheat input. Flour mills typically achieve overall flour extraction rates between 60% to 75% in general, though well-configured commercial roller mills in India commonly reach 72–78% combined flour extraction from cleaned wheat. Extraction rates depend on the milling process and raw wheat quality. Milling efficiency is influenced by both flour and by-product yields.
A product-yield matrix should be established for effective capacity planning, mapping each product stream against wheat input. Extraction rates are not fixed benchmarks – they must be validated through test milling and trial runs before finalising a detailed project report or feasibility study.
How Much Maida, Suji, Atta and Bran Can Be Produced from 1,000 kg of Wheat?
This illustrative material balance assumes 1,000 kg of raw wheat. Production capacity should account for all by-products like bran and whole wheat flour. A detailed mass balance should be prepared for financial feasibility.
Table: Illustrative Material Balance (1,000 kg Raw Wheat)
| Item | Weight (kg) | % of Raw Wheat |
|---|---|---|
| Raw Wheat Input | 1,000 | 100% |
| Cleaning Losses | 20 | 2% |
| Cleaned Wheat | 980 | 98% |
| Maida (refined flour) | 540 | 54% |
| Suji / Semolina | 90 | 9% |
| Atta / Coarse Flour | 85 | 8.5% |
| Bran & By-products | 240 | 24.5% |
| Process Losses (moisture, dust) | 25 | 2.5% |
| Total Outputs + Losses | 980 | 98% |
Starch content in millfeed (bran and middlings fractions) can range from 5% to 40% depending on separation efficiency. This example scales directly: a 50 TPD plant processes 50,000 kg/day, and a 100 TPD plant processes 100,000 kg/day.
Formula for Wheat Milling Extraction Rate
Extraction % of Maida = (Weight of Maida Produced ÷ Weight of Cleaned Wheat Input) × 100
Worked example: if 540 kg maida is produced from 980 kg cleaned wheat, then Maida Extraction = (540 ÷ 980) × 100 = 55.1%. Some millers use raw wheat as the denominator; consistency within a project report is essential.
Factors Affecting Maida and Suji Recovery
- Wheat variety: hard wheat grains produce better suji separation; soft wheat yields less clean endosperm
- Grain hardness, moisture content and thousand-kernel weight affect break roll performance
- Conditioning (tempering to ~15–16.5% moisture) improves bran separation
- Plansifter efficiency and purifier performance directly impact suji quality and yield
- Ash content is a key indicator of milling efficiency; premium maida requires ash below ~0.50%, which may reduce extraction slightly
Complete separation of kernel parts is rarely achieved in milling – separation efficiency can reach a maximum of E=1 only theoretically. Product quality specifications must comply with established standards; choosing the right milling technology affects both processing efficiency and product yield. Tighter quality specs (low ash, light colour, strong gluten characteristics) may reduce extraction percentages but support premium pricing.
Optimal Product Mix in a Maida & Suji Manufacturing Plant
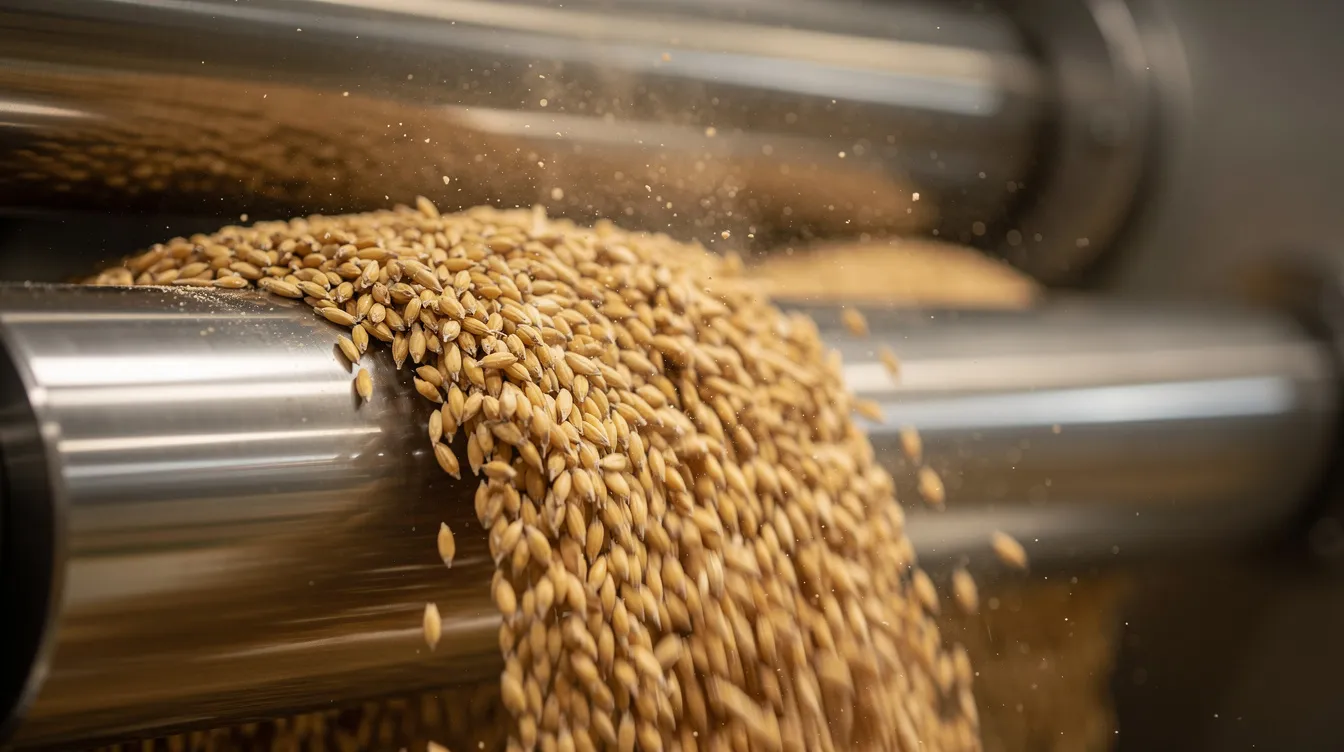
A maida–suji plant is a multi-product flour mill: maida, suji, atta maida combinations, other flour types and bran – all generated from the same wheat input. While product-mix adjustments are possible through milling settings, the overall balance between flour and bran is constrained by the physics of the wheat kernel.
Product mix planning must consider steady offtake, credit terms, packaging preferences and competition. Bran, though a by-product, can contribute meaningfully to revenue through wheat bran processing and value addition.
Maida-Dominant vs Suji-Focused Product Mix
A maida-dominant scenario targets bakeries, biscuit manufacturers and food processors, maximising refined flour extraction. A suji-focused configuration, suitable for markets with strong demand for rava and cereals-based products, configures purifiers to maximise semolina recovery. For suji-focused planning, refer to the suji manufacturing plant project report.
Impact of Product Mix on Revenue and Profitability
Table: Product Mix Scenarios – Revenue per 1,000 kg Cleaned Wheat (Illustrative)
| Product | Scenario A: Maida-Heavy | Scenario B: Balanced | Scenario C: Suji-Focused |
|---|---|---|---|
| Maida (₹32/kg) | 580 kg = ₹18,560 | 540 kg = ₹17,280 | 490 kg = ₹15,680 |
| Suji (₹35/kg) | 50 kg = ₹1,750 | 90 kg = ₹3,150 | 140 kg = ₹4,900 |
| Atta (₹30/kg) | 100 kg = ₹3,000 | 85 kg = ₹2,550 | 80 kg = ₹2,400 |
| Bran (₹14/kg) | 230 kg = ₹3,220 | 240 kg = ₹3,360 | 245 kg = ₹3,430 |
| Gross Revenue | ₹26,530 | ₹26,340 | ₹26,410 |
All prices are hypothetical. Optimising product mix is an ongoing management decision based on live market feedback, not a one-time design choice. Strategic forecasts help prevent management from making decisions based on unusual market conditions.
Daily and Annual Production Planning for a 100 TPD Plant
Table: 100 TPD Plant – Annual Production at 80% Utilisation (Illustrative)
| Parameter | Value |
|---|---|
| Installed Capacity | 100 TPD |
| Operating Days | 300/year |
| Capacity Utilisation | 80% |
| Daily Wheat Input | 80 MT |
| Annual Wheat Requirement | 24,000 MT |
| Maida (55% recovery) | 44 MT/day → 13,200 MT/year |
| Suji (9% recovery) | 7.2 MT/day → 2,160 MT/year |
| Atta (8.5% recovery) | 6.8 MT/day → 2,040 MT/year |
| Bran (24.5% recovery) | 19.6 MT/day → 5,880 MT/year |
| Process Losses (3%) | 2.4 MT/day → 720 MT/year |
The same method applies for 50 TPD and 200 TPD plants. This production planning feeds directly into revenue projections, working capital requirements and DSCR analysis in a DPR. A phased capacity expansion strategy is recommended for scaling operations.
Machinery Capacity and Production Bottlenecks
A plant’s nameplate TPD is achievable only if all critical sections – cleaning, conditioning, milling, sifting, purification and packing – are properly balanced. Production capacity impacts the type of machinery required, and higher capacity mills require more advanced machinery. The type of machinery affects the overall project cost, and automation level impacts the investment required for setup.
Bottleneck analysis helps identify constraints in the milling process. If a 100 TPD milling section is paired with only an 80 TPD cleaning line, effective throughput stays near 80 TPD regardless of roller mill capacity. Automation and digital monitoring can improve capacity management by tracking throughput across each section in real time. For detailed equipment specifications, refer to maida and suji plant machinery, equipment and cost.
Raw Material Procurement, Wheat Quality and Capacity Utilisation
Raw material availability is crucial for consistent production. A 100 TPD plant at 80% utilisation needs approximately 24,000 MT of wheat annually. Procurement strategy – mandis, large traders, contracted farmers – affects landed cost and working capital lock-in.
Wheat quality affects yields and should be considered in capacity planning. Moisture, protein content, foreign matter and grain hardness all influence extraction and throughput. Inventory management should address optimal levels for raw wheat and finished products, including safety stock to buffer against supply chain disruptions. Covered godowns with proper fumigation, FIFO rotation and moisture monitoring are essential.
Product Mix Optimisation and Profitability Analysis
Once extraction rates are understood, profitability analysis maps each product’s volume × selling price – variable cost to arrive at contribution per tonne of wheat processed. Key drivers include wheat purchase cost, electricity and fuel consumption per MT, packing cost, labour, freight and selling expenses. Flour mill project profitability is assessed through financial projections built on these parameters.
Product-Wise Revenue Calculation
For 24,000 MT annual wheat processing: multiply product-wise annual volumes by selling prices to derive total gross revenue. Contribution per MT wheat = total revenue minus variable costs (wheat, power, packing, direct labour). All prices used are illustrative and must be replaced with current local market estimates in the project report. Market research specific to the target geography is essential.
Why Higher Yield Does Not Always Mean Higher Profit
Chasing maximum extraction can lower quality – higher ash, darker colour – forcing sales into low-margin bulk markets. A mill producing slightly less maida at premium quality and price may earn higher contribution per MT than one maximising volume at discounted prices. From a feasibility study perspective, conservative extraction and realistic prices produce more defensible projections than aggressive assumptions.
Capacity Utilisation, Working Capital and Financial Projections
Banks examine capacity utilisation assumptions closely because they drive revenue, inventory and debt-servicing ability. Projected cash flow is crucial for flour mill financial planning.
| Year | Utilisation | Annual Wheat (MT) | Illustrative Revenue (₹ Cr) |
|---|---|---|---|
| Year 1 | 65% | 19,500 | ~5.1 |
| Year 2 | 75% | 22,500 | ~5.9 |
| Year 3 | 85% | 25,500 | ~6.7 |
(100 TPD plant, 300 days, assumed average realisation ~₹26,300 per MT wheat processed)
Higher utilisation increases working capital needs proportionally. For detailed month-wise projections and CMA Data preparation, refer to the article on roller flour mill financial projections and working capital.
Sensitivity Analysis – Changes in Yield, Product Mix and Utilisation
Professional project viability analysis must test how sensitive profitability is to changes in key assumptions. Break-even analysis helps determine flour mill project viability under stress conditions.
Table: Sensitivity Impact on Contribution per MT Wheat (Illustrative)
| Scenario | Change | Impact on Contribution/MT |
|---|---|---|
| Base Case | – | ₹0 (reference) |
| Maida extraction −2 pp | 55% → 53% | −₹60 to −₹80 |
| Wheat price +₹1,000/MT | Cost increase | −₹1,000 |
| Maida price −5% | ₹32 → ₹30.4/kg | −₹80 to −₹100 |
| Utilisation −10 pp | 80% → 70% | Fixed cost spread worsens |
| Bran price −20% | ₹14 → ₹11.2/kg | −₹50 to −₹60 |
For comprehensive feasibility methods, refer to the roller flour mill feasibility study and project viability article.
How Capacity Planning Is Presented in a DPR for Bank Finance
A professional detailed project report for a maida and suji plant must include: installed capacity (TPD), annual processing capacity, phased utilisation schedule, product-wise production quantities, raw material requirements, material balance tables, working capital assessment, and DSCR analysis. The Debt Service Coverage Ratio is vital for loan repayment analysis.
Financial projections (profit and loss, cash flow, balance sheet) must be internally consistent with capacity figures – sales volumes must match production, and inventories cannot exceed realistic storage and working capital limits. Compliance with local regulations is necessary for food safety and quality standards. Margin money requirements and other components of the means of finance must align with the business plan.
Project Report Bank prepares customised DPRs, capacity-based financial models and CMA Data for bank loan proposals. For multi-year projections and DSCR modelling, financial projections and modelling services are available.
Common Mistakes in Maida & Suji Plant Capacity Planning
Many project issues arise from unrealistic assumptions at the planning stage, not technology shortcomings:
- Confusing wheat-input capacity with maida-output capacity
- Ignoring 2–5% cleaning and handling losses from raw wheat
- Assuming fixed extraction rates regardless of wheat quality or variety
- Planning 100% utilisation from Year 1 without supporting demand evidence
- Underestimating bran’s commercial importance and treating it as waste
- Neglecting maintenance downtime and power interruption allowances
- Ignoring packaging and logistics constraints on achievable despatch volumes
- Over-investing in TPD capacity without parallel planning for procurement, marketing, distribution and working capital
- Preparing revenue projections without market research or confirmed buyer interest
- Not cross-verifying capacity and yield assumptions with machinery vendors and an independent financial advisor before freezing the business plan
Professional Advisory – Choosing the Right Plant Capacity
The “right” capacity is project-specific: it must reflect confirmed demand, raw material access, available investment, promoter experience and risk appetite. A structured feasibility study comparing multiple capacity options on parameters like total project cost, breakeven volume, expected ROI/IRR and DSCR under realistic assumptions is essential before committing capital. Estimating plant economics accurately requires professional input at the planning stage.
Planning a commercial maida and suji manufacturing plant? CA Manish Gugliya provides professional assistance with detailed project reports, capacity-based financial projections, CMA Data preparation and bank finance planning. Share your proposed plant capacity, project location and investment requirements through WhatsApp to discuss the appropriate scope of advisory services.
Frequently Asked Questions
These FAQs address practical queries raised during early planning of a maida and suji manufacturing plant.
What is a practical starting capacity for a new maida and suji manufacturing plant?
For many first-time entrepreneurs, a 40–75 TPD commercial flour mill is more manageable than a 150–200 TPD plant because it requires lower capital, simpler market coverage and more achievable utilisation targets. The ideal size depends on confirmed demand (bulk buyers vs retail), wheat sourcing comfort, land and power availability, and the promoter’s capacity to manage working capital. A feasibility study before final selection is advisable.
How do I estimate how much wheat my plant will consume in a year?
Use the formula: Annual Wheat Requirement (MT) = Installed TPD × Capacity Utilisation % × Operating Days. For example, 100 TPD × 80% × 300 days = 24,000 MT/year. Adjust for planned shutdowns and seasonal closures specific to the project location.
Can the same flour mill easily switch between atta-only production and maida–suji–atta mix?
Most integrated roller mills are designed to produce multiple final products (atta, maida, suji, bran). Basic chakki-type atta plants may lack purifiers and plansifters required for quality maida and suji. Modifying an atta-only plant requires additional machines and layout changes, so it is better to freeze the desired product range at the planning stage. For atta-specific projects, refer to the atta manufacturing process guide.
How does capacity planning impact my bank loan proposal?
Banks assess whether the proposed TPD, utilisation ramp-up, extraction rates and sales volumes are realistic. Clearly presented capacity calculations, material balance tables, working capital estimates and DSCR analysis in a techno economic feasibility report help lenders take an informed view on term loan and working capital limits. Overly aggressive assumptions may weaken the appraisal.
Is a higher TPD plant always more profitable than a smaller plant?
Larger TPD can offer economies of scale and broader investment opportunities if the plant runs at high utilisation with stable yields and strong sales. However, an underutilised large plant with a weak product mix can produce less revenue than a smaller but efficient and well-marketed mill. Evaluate both technical milling capacity and realistic market absorption before assuming bigger is automatically better. The food processing industry in India offers viable opportunities at various scales when planning is thorough.