Key Takeaways
- Roller flour mill financial projections must be built from realistic operating assumptions – installed capacity, wheat recovery percentages and product mix – rather than from a desired profit figure or predetermined loan amount.
- Wheat procurement cost and working capital for inventory and receivables are the two factors that most directly determine both profitability and cash-flow health in a flour mill business.
- Product-wise projections for atta, maida, suji and bran must feed separately into revenue, cost and working capital calculations, since each product has different recovery, pricing and margin characteristics.
- A complete working capital assessment – covering wheat stocks, finished goods, packing materials, receivables and creditor days – is as critical as the projected profit and loss account in any bankable DPR.
- Professional advisory from experienced project finance practitioners improves the quality and defensibility of financial projections without guaranteeing loan sanctions or specific returns.
Introduction: Why Financial Projections Matter in a Roller Flour Mill DPR
A roller flour mill is a high-volume, comparatively thin-margin manufacturing business. The roller flour milling sector processes roughly 12–15% of total wheat consumed in India, with around 800 large flour mills processing approximately 10.5 million tons of wheat annually. Even small changes in wheat price, extraction percentage or capacity utilisation can significantly alter profitability and cash flow.
Roller flour mill financial projections and working capital assessment form the core of any Detailed Project Report or CMA Data submitted for bank finance. The key profitability drivers include wheat procurement cost, product-wise recovery for atta, maida, suji and bran, capacity utilisation, power consumption, labour, packaging, freight and interest cost. India’s packaged atta market reached ₹95.1 billion in 2025, and the global flour market is valued at $114.23 billion, reflecting steady demand growth – but demand alone does not ensure profitability at the plant level.
A project may show attractive profit on the projected profit and loss account yet face serious cash shortages if working capital is underestimated. This article, written from my professional perspective as a practising Chartered Accountant, focuses on how financial projections and working capital requirements are structured for commercial roller flour mills in Indian conditions.
Key Operating Assumptions Behind Roller Flour Mill Financial Projections
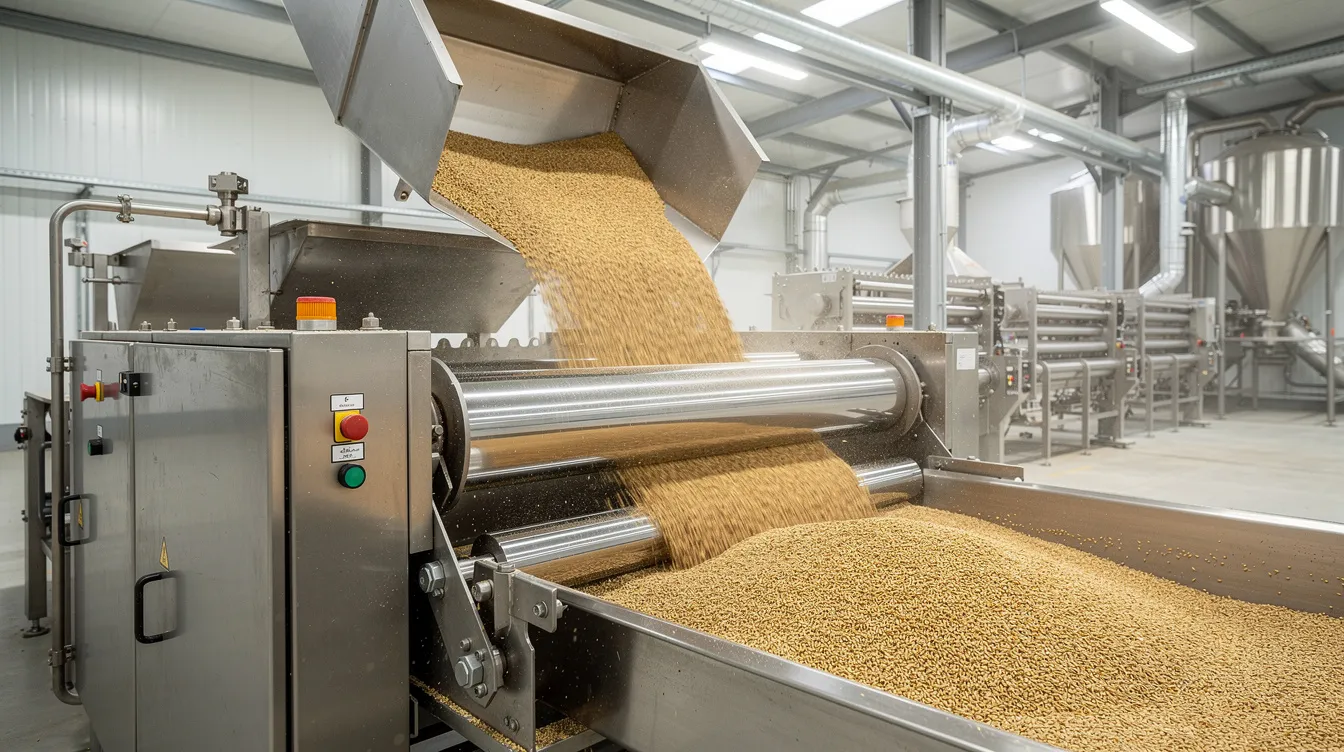
Robust flour mill financial projections must begin with operating assumptions rather than arbitrary revenue numbers. Every assumption should be justified with technical data from the plant design, the roller flour milling process and market realities.
The following assumptions must be clearly defined in any financial model:
- Capacity and throughput: Installed capacity in TPD, operating days per year (typically 300), shifts per day, and hourly throughput. These should align with roller flour mill capacity planning decisions.
- Material assumptions: Annual wheat input quantity, flour extraction percentage, product-wise recovery for atta (72–75%), maida (45–50%), suji (2–5%) and bran (20–25%), and expected wastage. Roller mills are capital-intensive and require high capacity utilisation to be economically viable.
- Commercial assumptions: Product-wise selling prices, annual price escalation, wheat purchase price (which fluctuates based on minimum support prices and seasonal harvests), power tariff, labour cost, packing material rates, freight and marketing expenses.
- Financial assumptions: Depreciation rates as per the Companies Act or Income Tax Act, interest on term loan and working capital, tax rate and repayment schedule.
Expect a conservative utilisation rate when starting a roller flour mill. Projections prepared merely to justify a loan amount rather than to reflect realistic operations create problems during lender appraisal.
Capacity Utilisation Assumptions and Their Financial Impact
Banks generally do not accept projections showing 100% capacity utilisation from the first year for a new flour mill setup. A realistic ramp-up pattern might look like:
- Year 1: 55–60%
- Year 2: 70–75%
- Year 3: 80–85%
The capacity utilisation must be planned carefully when projecting revenues. Higher utilisation improves revenue and contribution, strengthens fixed-cost absorption (salaries, minimum demand power charges), and supports better DSCR. However, it also increases working capital needs due to higher wheat procurement and receivables.
Breaking even in roller flour milling typically requires 45% to 55% capacity utilisation, depending on scale, product mix and cost structure. A plant projected at 60% utilisation in Year 1 versus 80% in Year 3 will show materially different EBITDA and cash-flow profiles.
Product Mix: Atta, Maida, Suji and Bran in Projections
Turnover cannot be estimated using a single average selling price. A roller flour mill produces multiple products with distinct prices and margins. It is important to calculate extraction rates in flour milling to understand profitability accurately.
An illustrative product-wise projection for a hypothetical 60 TPD plant at 75% utilisation (processing ~13,500 MT wheat per year) might look like:
| Product | Indicative Recovery % | Production (MT/Year) | Selling Price (₹/kg) | Revenue (₹ Lakh) |
|---|---|---|---|---|
| Atta | 50% | 6,750 | 30 | 2,025 |
| Maida | 22% | 2,970 | 32 | 950 |
| Suji/Rava | 3% | 405 | 35 | 142 |
| Bran | 22% | 2,970 | 14 | 416 |
| Total | ~97% | 13,095 | 3,533 |
Note: These are illustrative figures only. Actual recovery varies depending on wheat quality, plant configuration, whole grain processing strategy and target specifications.
Roller mills are preferred for producing maida and suji for bakeries and food processors. The process of milling wheat also yields bran, which is sold as animal feed – and its pricing can materially affect overall economics. Higher margins in flour milling can often be achieved through product diversification, and the demand for high-value byproducts plays a critical role in financial projections.
Revenue Projections for a Commercial Roller Flour Mill
The core formula is straightforward: Annual Revenue = Σ (Product-wise Production Quantity × Expected Selling Price per kg).
Revenue projections should consider separate realisations for each product and customer segment. Bulk B2B flour supply typically involves 30–60 day receivables, while packaged flour sales can yield margins of 15–25%. Plain packaged atta typically delivers 5–9% net margin at the retail level. Demand for organic and specialty flours is increasing among consumers, and the global convenience food market is projected to reach USD 810.2 billion by 2033 – but over-optimistic selling-price escalation in projections can artificially inflate profitability.
At 50 TPD capacity processing roughly 15,000 MT annually, a mere ₹0.50/kg change in average selling price alters annual revenue by approximately ₹75 lakh. This sensitivity underlines why local competition and realistic market pricing matter in revenue projections.
Raw Material Cost: Wheat as the Main Driver of Economics
Raw wheat accounts for 70% to 80% of total operating costs in flour milling. Wheat grain procurement prices in major producing states averaged ₹23,000–24,000 per metric tonne in early 2026, though prices fluctuate based on seasonal harvests and government policy.
Grain procurement usually occurs in bulk during harvest seasons, requiring significant upfront capital. Key factors affecting raw material costs include procurement source (mandi, FCI, local traders), transport and handling, storage losses, and moisture and quality variations that impact yield.
A ₹1,000/MT increase in wheat cost for a plant processing 15,000 MT annually adds ₹1.5 crore to annual expenses. Sensitivity analysis on wheat cost is therefore essential in roller flour mill financial projections submitted to banks or investors. This cost directly links to working capital – promoters buying larger quantities during harvest to lock prices need sufficient inventory funding.
Manufacturing and Operating Expenses in a Roller Flour Mill
Non-wheat operational costs, while smaller, still significantly influence EBITDA and break-even. Key expense heads include:
- Electricity and fuel (power consumption is a major operational expense)
- Labour and staff salaries
- Packing material (bags, printed pouches, packaging for branded atta)
- Repairs and maintenance (heavy machinery in milling necessitates annual maintenance and depreciation budgeting)
- Stores, consumables and dust control systems
- Loading/unloading and freight (inward and outward)
- Quality control and laboratory expenses
- Insurance, administrative overheads and selling expenses
Variable costs (power per tonne, packing, transport) scale with production volume, while fixed costs (salaries, rent, minimum demand power charges) remain relatively constant. Flour mills typically achieve net profit margins of 8% to 15% of annual turnover, but these vary depending on scale, product mix and cost discipline. Operating costs for a wheat flour plant tend to increase significantly by year five due to inflation and maintenance cycles.
Power Cost and Its Role in Roller Flour Mill Profitability
Modern roller flour mills consume approximately 36–50 kWh per tonne of wheat processed. The formula is: Power Cost per Tonne = Total Annual Power Expense ÷ Total Tonnes Processed.
For a hypothetical 60 TPD plant processing 13,500 MT annually at 42 kWh/MT and an industrial tariff of ₹8/unit, annual power cost would be approximately ₹45 lakh – roughly ₹335 per tonne. Realistic power assumptions must match the planned roller flour mill machinery and equipment configuration, not generic estimates. Wheat flour processing plants are increasingly adopting automation and digital monitoring, which can improve energy efficiency.
Project Cost, Means of Finance and Their Link to Projections
The financing structure directly affects interest, depreciation and DSCR in the flour mill projected profit and loss account. CapEx includes costs for land, building, equipment, and utilities. Equipment expenditures claim the largest share of upfront funding – machinery costs account for the largest portion of capital expenditure in flour milling. A mini atta plant at 250 kg/hour costs roughly ₹16–27 lakh fully installed, while a small-scale flour mill costs approximately ₹12–25 lakh. For detailed guidance on roller flour mill project cost and means of finance, including capacity-wise investment ranges, readers may refer to the dedicated resource on roller flour mill setup cost in India.
Financing sources typically include promoter contribution (equity), term loan, possible unsecured loans from promoters, and margin money for working capital. Repayment period, moratorium and interest rate assumptions must align with bank norms.
Projected Profit and Loss Account for a Roller Flour Mill
The projected P&L summarises expected cost and revenue over typically 5–7 years. An illustrative Year 1 structure for a hypothetical 60 TPD plant at 60% utilisation:
| Particulars | Amount (₹ Lakh) | % of Revenue |
|---|---|---|
| Gross Revenue | 2,825 | 100% |
| Less: Wheat Cost | 2,070 | 73% |
| Less: Other Manufacturing Expenses | 225 | 8% |
| Gross Contribution | 530 | 19% |
| Employee Costs | 48 | 1.7% |
| Admin & Selling Expenses | 35 | 1.2% |
| EBITDA | 447 | 15.8% |
| Depreciation | 85 | 3.0% |
| Interest (Term Loan + WC) | 130 | 4.6% |
| Profit Before Tax | 232 | 8.2% |
| Taxes | 58 | 2.1% |
| Profit After Tax | 174 | 6.2% |
All figures are hypothetical and for illustration only. Actual results vary depending on capacity, wheat prices, recovery and market conditions.
Net profit percentage alone does not establish viability. Cash flow, working capital adequacy and DSCR must be examined alongside.
EBITDA, Operating Margin and Their Drivers
EBITDA – earnings before interest, tax, depreciation and amortisation – reflects operating profitability before financing and non-cash charges. Lenders and investors examine EBITDA margin as a key indicator. The main drivers include wheat procurement price, extraction rates, product mix, power consumption per tonne, and whether the mill sells bulk or branded products. Specialty and functional flours are gaining popularity among consumers, and mills investing in branded retail or fortified products may command better margins, though packaging and marketing costs also increase. Margins vary widely by region and scale, so projections must be project-specific.
Projected Cash Flow Statement and Its Importance
Cash flow is not the same as accounting profit. A projected cash-flow statement covers cash from operations (profit after tax plus depreciation minus working capital increase), investing activities (machinery, building) and financing activities (loan drawdown, repayment, equity).
Growing sales often increase working capital needs. A plant reporting higher profit in Year 2 may actually show tighter closing cash if wheat inventory and debtors have grown faster than internal accruals. Bankers assess whether internal cash generation is adequate to service both term loan and working capital interest. This is particularly relevant in the atta manufacturing business where seasonal wheat procurement can cause sharp cash outflows.
Projected Balance Sheet for a Flour Mill
The projected balance sheet shows financial position at year-end and must reconcile with P&L and cash-flow projections. Key assets include net fixed assets, raw wheat inventory, finished goods, packing material, receivables, cash and deposits. Key liabilities include share capital, retained profits, term loan outstanding, cash credit utilisation, trade creditors and other liabilities.
Working capital projections – inventory days, debtor days, creditor days – should flow logically into the current-assets and current-liabilities section. Total assets must equal total liabilities plus equity each year. Inconsistencies here are a common red flag in weak project reports and invite queries during bank appraisal.
What Is Working Capital in a Roller Flour Mill?
Working capital is the capital required to fund the operating cycle – mainly wheat stocks, finished goods, packing materials, receivables and a minimum cash buffer – after adjusting for credit from suppliers.
Working Capital Requirement = Inventory + Receivables + Other Current Assets – Trade Creditors – Other Current Liabilities
Flour milling requires substantial working capital due to seasonal procurement patterns and credit sales. Banks normally finance only a portion through cash credit; the rest must come from the promoter’s margin. Working capital is distinct from term loan, which finances fixed assets. Mixing the two often causes liquidity stress. Maintaining low gross current assets is vital to avoid excessive reliance on bank credit.
Major Components of Roller Flour Mill Working Capital
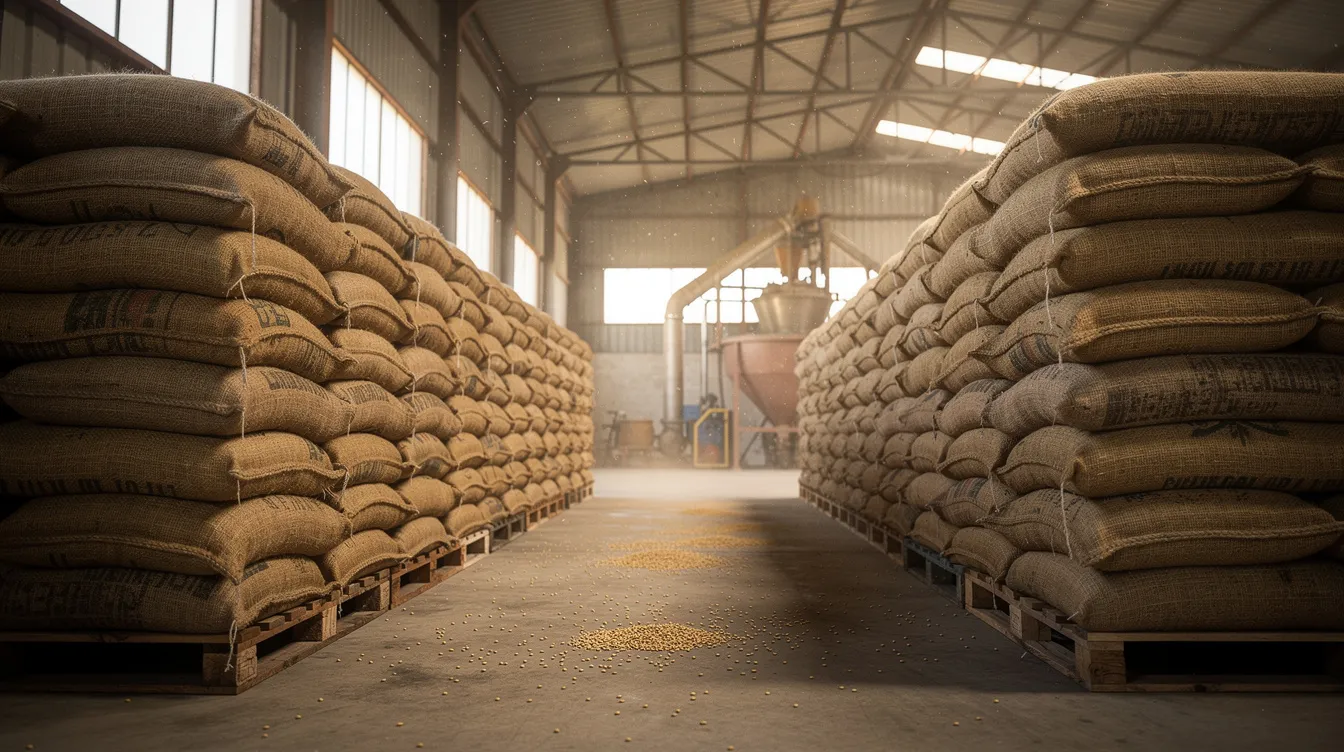
- Wheat inventory: Typically 20–45 days of consumption, valued at landed cost. Mills buying in bulk during harvest may carry 60+ days.
- Finished goods: Atta, maida, suji and bran stocks; usually 5–10 days of production. Product mix influences total stock value.
- Packing material: Bags, pouches, cartons and printing material; typically 10–15 days.
- Receivables: Credit period to distributors, wholesalers, bakeries, hotels and institutional buyers; commonly 15–45 days.
- Trade creditors: Supplier credit from wheat traders and packing vendors reduces the working capital gap.
- Cash and operating expenses: Minimum cash for salaries, electricity, transport even when cash credit is available.
Working Capital Cycle in Flour Milling
The operating cycle runs from paying for wheat to collecting cash from customers.
Net Working Capital Cycle (days) = Raw Material Days + Finished Goods Days + Receivable Days – Creditor Days
Illustrative example: Raw Material 30 days + Finished Goods 7 days + Receivables 20 days – Creditors 15 days = 42 days.
Once the net cycle is known: Working Capital Requirement ≈ (Annual Operating Cost ÷ 365) × Net Working Capital Days. These are indicative calculations, not fixed benchmarks. Actual numbers vary depending on whether the mill operates on job work (which has the lowest capital requirement among models), B2B supply or branded retail.
Illustrative Working Capital Requirement Calculation
For a hypothetical 60 TPD plant operating at ~70% utilisation:
| Particulars | Basis | Amount (₹ Lakh) |
|---|---|---|
| Wheat Inventory | 30 days consumption | 570 |
| Finished Goods Stock | 7 days cost of production | 155 |
| Packing Material | 10 days requirement | 18 |
| Receivables | 20 days sales | 195 |
| Cash & Other Current Assets | Lump sum | 20 |
| Total Current Assets | 958 | |
| Less: Creditors (Wheat & Packing) | 15 days | 295 |
| Less: Other Current Liabilities | 25 | |
| Working Capital Gap | 638 | |
| Promoter’s Margin (25%) | 160 | |
| Proposed Bank Cash Credit | 478 |
All figures are illustrative only. Actual working capital for a flour mill business varies depending on capacity, procurement strategy, credit policies and market conditions.
Working Capital Limit / Cash Credit Assessment by Banks
Banks assess roller flour mill working capital requirement primarily through stock-and-receivable-based methods (drawing power) for larger exposures and turnover-based methods for smaller MSME units. Key items bankers check include projected sales, levels of raw wheat and finished goods stock, book debts, trade creditors and promoter’s margin.
Drawing power is calculated as the margin-adjusted value of eligible paid stock and receivables, which caps actual utilisation of the sanctioned cash credit limit. Consistency between the projected balance sheet, CMA Data schedules and the requested limit is critical.
CMA Data for a Roller Flour Mill Project
CMA Data is the standard format used by Indian banks to analyse term loan and working capital proposals for manufacturing projects. Main components include operating statement, projected balance sheet, current assets and current liabilities statement, working capital analysis, fund-flow statement and key ratios (current ratio, TOL/TNW, interest coverage, DSCR).
Roller flour mill working capital requirement, inventory norms and receivable days are captured in detail within CMA schedules. CMA figures must reconcile with the DPR and should not be reverse-engineered to justify a desired cash credit limit. For professional assistance, promoters may consider CMA Data preparation services from experienced practitioners. FSSAI registration is mandatory for flour mill businesses above 2 metric tons per day, and lenders may also verify trade licence, udyam registration and state licence compliance as part of eligibility criteria assessment. Basic registration requirements are worth checking before applying.
Term Loan Versus Working Capital Finance in a Flour Mill
A roller flour mill project typically needs both a term loan (for fixed assets – building, advanced machinery, electrical installations, laboratory) and working capital limits (for inventory and receivables). Term loans are repaid through structured EMIs over 5–7 years, while cash credit is renewable annually based on drawing power.
Using term loan funds for working capital – or permanently parking cash credit in fixed assets – creates liquidity and compliance issues. A balanced structure improves financial stability and lender confidence.
Interest Cost and Its Treatment in Financial Projections
Interest is a critical bridge between financing structure and projected profitability. Term-loan interest is calculated on year-wise outstanding balances. Working-capital interest should be linked to realistic average utilisation, not the full sanctioned limit.
For a ₹2 crore cash credit limit: at 60% average utilisation, annual interest at 10% is approximately ₹12 lakh; at 90% utilisation, it rises to ₹18 lakh. This ₹6 lakh difference directly affects profit before tax and DSCR. Rising interest rates also deserve sensitivity testing in the flour mill financial model, especially for highly leveraged projects.
DSCR and Loan-Repayment Capacity
Lenders evaluate DSCR to determine whether projected cash accruals can service term-loan obligations: DSCR = (Profit After Tax + Depreciation) ÷ (Principal Repayment + Interest). Banks typically expect DSCR of 1.50 or higher. Roller flour mill DSCR depends on capacity utilisation, EBITDA margin, interest cost and repayment schedule. If DSCR appears tight under realistic assumptions, professional review of the financial model and repayment structure may be needed. A separate detailed treatment of DSCR methodology is available for wheat flour mill project report planning.
Break-Even Analysis for a Roller Flour Mill
Break-even analysis identifies the minimum sales or utilisation required to cover all fixed costs.
Break-Even Sales (₹) = Fixed Costs ÷ Contribution Margin Ratio
If annual fixed costs are ₹180 lakh and contribution margin ratio is 19%, break-even sales = ₹180 ÷ 0.19 = approximately ₹947 lakh. Staying significantly above break-even utilisation is essential for sustainable debt repayment. The processed food sector in India accounted for 23.4% of total agri-exports in 2023-24, indicating strong market scale – but each plant’s break-even depends on its own cost structure.
Sensitivity Analysis in Roller Flour Mill Financial Models
Sensitivity analysis tests how project viability responds to changes in key assumptions. Scenarios to test include wheat price increase by 5–10%, selling price decrease by 2–3%, capacity utilisation lower by 10 percentage points, power cost escalation and longer receivable cycles.
For each scenario, promoters should observe impact on EBITDA margin, net profit, cash flow, DSCR and break-even – not only on revenue. Wheat prices heavily impact input costs and operational margins. Our financial projections and financial modelling services typically include such sensitivity checks as standard practice.
Common Mistakes in Flour Mill Financial Projections
- Assuming 100% utilisation from year one
- Ignoring product-wise recovery; treating all output as generic flour
- Treating bran as waste with zero revenue
- Underestimating wheat price volatility and raw materials cost escalation
- Using aggressive selling-price escalation unsupported by market trends
- Under-budgeting electricity, repairs and maintenance
- Ignoring freight, packaging and distribution costs
- Assuming all sales are cash; omitting debtor days entirely
- Miscalculating inventory days for working capital
- Ignoring working-capital interest in the projected P&L
- Creating projections where P&L, cash flow and balance sheet do not reconcile
- Forcing repayment assumptions to make DSCR appear comfortable
Banks and experienced appraisers quickly identify such inconsistencies. Realistic, internally consistent projections carry far more credibility.
Why Working Capital Is Often Underestimated in Roller Flour Mills
Many promoters focus on roller flour mill setup costs – machinery, building, site selection – but do not fully budget the cash needed to buy wheat and support credit sales at planned capacity. A plant technically capable of 60 TPD may run at only 25–30 TPD because promoters lack sufficient working capital to procure raw materials and hold stocks.
This underutilisation weakens DSCR despite sound technical design. For comparison, job work milling generates ₹2.50 to 5 per kg with no inventory risk, precisely because working capital demands are minimal. Banks also expect the promoter’s own margin in working capital – not 100% financing – which further increases real cash requirements. In a flour mill business, working capital planning is as important as machinery selection and plant layout.
Financial Projection Checklist for a Roller Flour Mill DPR
- Installed capacity (TPD) and operating shifts
- Capacity utilisation ramp-up over projection years
- Annual wheat requirement and procurement plan
- Product-wise recovery percentages and product mix
- Product-wise selling prices with realistic escalation
- Wheat cost assumptions and seasonal procurement strategy
- Power consumption per tonne and applicable tariff
- Labour and salary structure
- Packing, freight and other variable costs
- Fixed administrative overheads and selling expenses
- Total project cost and means of finance (equity, term loan, margin)
- Depreciation policy and income-tax rate
- Inventory holding days (raw, finished, packing)
- Receivable days, creditor days and working capital gap
- Working capital borrowing and interest assumptions
- Term-loan repayment schedule
- Projected P&L, cash flow and balance sheet (internally consistent)
- DSCR computation
- Break-even analysis and sensitivity analysis
Practical Insight from Project Finance Perspective
In my experience preparing DPRs, CMA Data and bank finance proposals for manufacturing projects across India, I have observed that the real strength of a flour mill financial model lies not in complex spreadsheets but in whether the operating assumptions are realistic and internally consistent.
The priority areas that deserve most attention:
- Achievable capacity utilisation based on actual marketing capability, not aspiration
- Realistic wheat procurement prices reflecting seasonality and regional variation
- Technically sound extraction percentages validated by equipment specifications
- Conservative selling-price and margin expectations aligned with local competition
- Adequate working capital with correct promoter margin, not just bank limits
- Balanced debt-equity structure with repayment tenure aligned to projected cash accruals
I have seen cases where a project’s financial model had to be substantially reworked before lender discussions because the assumed utilisations and wheat costs could not be defended. Projections built to justify a predetermined loan amount rather than to reflect business reality create difficulties during appraisal. Well-prepared projections give promoters clarity and confidence in their own investment decisions.
Promoters should also explore available investment opportunities through government schemes. PMFME offers a 35% capital subsidy up to ₹10 lakh. PMEGP provides a subsidy on project costs for food processing units. Haryana’s HEEP offers capital subsidies for MSME units. CGTMSE offers collateral-free credit for eligible businesses, and state food processing policies may provide additional subsidies – all worth checking during the project planning stage.
Frequently Asked Questions
How much working capital is typically required for a 50–60 TPD roller flour mill?
Working capital requirements vary depending on wheat inventory days, product mix, receivable period and creditor terms. For a 50–60 TPD plant operating at 70–75% capacity, the working capital gap may range from ₹5 crore to ₹8 crore approximately, of which banks may finance 70–75% and the promoter must bring the stipulated margin. Actual figures depend entirely on project-specific assumptions.
How are flour mill financial projections prepared for a bank loan?
Projections start with operating assumptions – installed capacity, utilisation ramp-up, wheat input, product-wise recovery, selling prices and cost structure. These feed into a projected P&L, cash flow and balance sheet over 5–7 years. Working capital calculations based on inventory, debtor and creditor days are built into CMA Data. An economic analysis covering break-even, DSCR and sensitivity completes the financial model. A comprehensive business plan should be supported by machinery quotations, market assessment and a defensible project report.
Does every roller flour mill need both a term loan and cash credit facility?
Most commercial roller flour mills require both. The term loan finances fixed assets like machinery, building and electrical installations. Cash credit funds ongoing wheat procurement, finished goods inventory and receivables. Some very small-scale or job-work mills may manage without formal working capital limits, but any plant operating at meaningful scale with credit sales will typically need structured working capital finance.
Why does projected cash flow differ from projected profit in a flour mill?
Profit is an accounting measure that includes non-cash items like depreciation. Cash flow reflects actual timing of receipts and payments, plus loan repayments and capital expenditure which do not appear in the P&L. A flour mill reporting growing profit may still face cash tightness if wheat inventory and receivables are expanding faster than internal cash generation. This is why lenders look at both statements.
Is CMA Data mandatory for a roller flour mill bank loan?
For term loans and cash credit facilities from banks, CMA Data is typically required for MSME manufacturing projects including roller flour mills. It provides a structured format for operating statement, balance sheet, working capital analysis and ratio computation that bankers use during credit appraisal. The exact requirement may depend on the company, loan amount and bank policy. In my experience, having well-prepared CMA Data substantially improves the quality of lender discussions.
Conclusion and Call to Action
A sound roller flour mill financial model must integrate production capacity, product-wise recovery, wheat pricing, operating expenses, project financing and working capital into coherent, internally consistent projections. Working capital should receive the same analytical rigour as fixed investment – without adequate funds for wheat, packaging and receivables, even a technically well-designed plant may fail to reach planned utilisation and struggle with loan repayment.
Entrepreneurs and MSME owners planning a new roller flour mill, expansion or bank-funded project may require customised financial projections, CMA Data, working capital assessment and a bank-ready DPR based on their specific capacity, machinery quotations, wheat procurement strategy, product mix and funding structure. For professional assistance, readers may contact ProjectReportBank.com. While professional preparation improves the quality and credibility of documentation, no advisor can guarantee loan approval or specific profitability outcomes.
CA Manish Gugliya is a Fellow Chartered Accountant with more than 20 years of professional experience in project reports, CMA Data, financial projections, project finance, feasibility analysis and business advisory for manufacturing and MSME projects across India. Through ProjectReportBank.com, he leads a professional advisory practice focused on realistic, data-backed financial modelling rather than generic templates.