Key Takeaways
- Atta Chakki Plant ROI depends not only on projected profit but also on total project cost, working capital requirements, capacity utilisation, debt obligations and actual cash flows over the project life.
- IRR, payback period and detailed sensitivity analysis covering wheat price, atta selling price, power cost and utilisation levels are essential to judge true atta chakki plant investment returns.
- Small changes of even 2–5% in wheat procurement cost or atta selling price can significantly alter flour mill ROI, cash accrual and debt-servicing capacity.
- Combined sensitivity analysis – where multiple variables move together – provides a far more realistic picture of project resilience than single-variable tests alone.
- All numerical examples in this article are purely illustrative. Actual project viability requires a customised detailed project report based on project-specific assumptions, location, machinery, financing and market conditions.
Introduction: Why Profit Alone Cannot Judge an Atta Chakki Project
A common mistake among new promoters is evaluating an atta chakki or wheat flour mill project by looking only at expected profit per year. That single number, however attractive, tells an incomplete story. It does not account for how much capital was invested, how long money remains tied up, whether the business generates enough cash to repay loans, or how fragile profitability becomes when wheat prices rise or selling prices soften.
India produces over 70 million tonnes of wheat annually, and the packaged wheat flour market in the country grows at approximately 19% CAGR. This growing market attracts entrepreneurs across the country – from Delhi to smaller towns. Yet wheat processing and chakki atta manufacturing are volume-driven businesses where even small changes in raw-material cost, atta selling price or capacity utilisation can sharply change profit and cash accrual.
From a project-finance perspective, lenders and investors look well beyond the projected P&L. They examine DSCR, break-even volumes, cash flow stability, IRR and sensitivity analysis before committing funds. This article explains how atta chakki plant ROI, IRR, payback period and sensitivity analysis should be understood, calculated and interpreted – written from the practical experience of preparing and analysing manufacturing-project reports.
Understanding Investment Returns in an Atta Chakki / Flour Mill Project
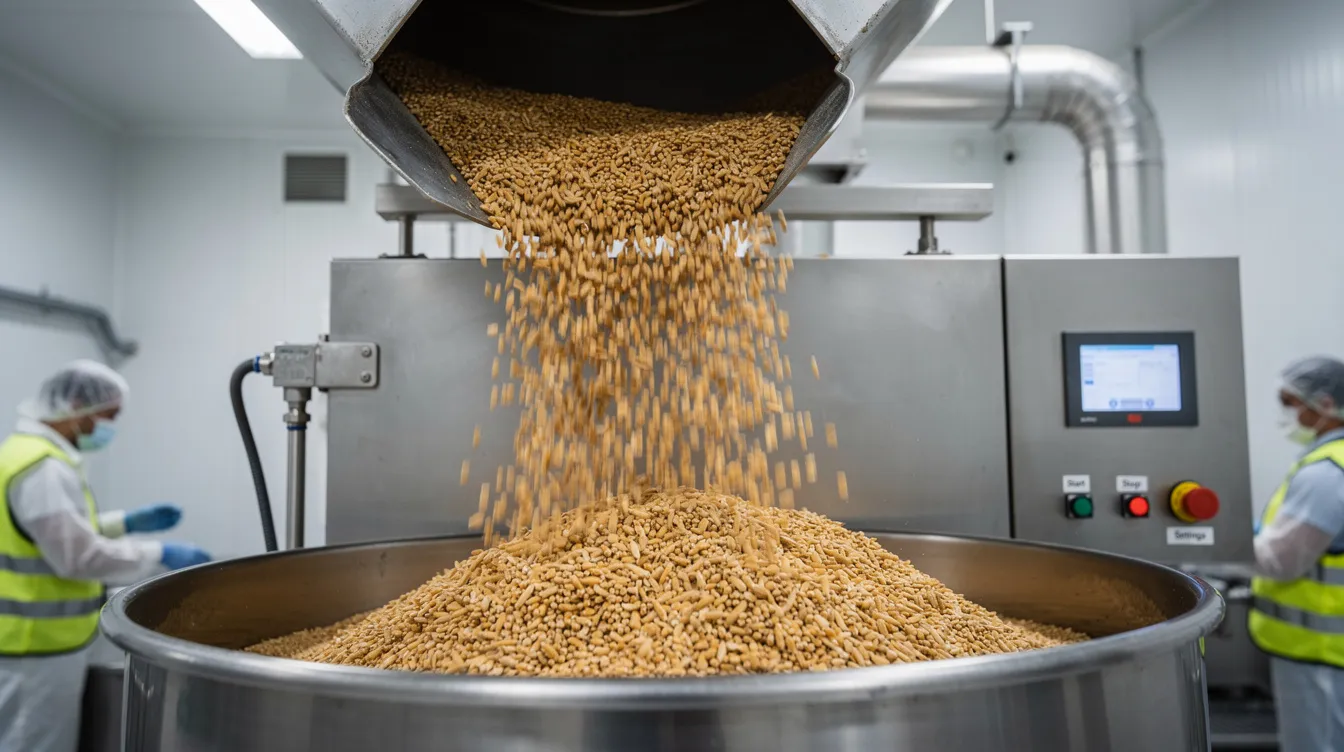
Investment returns in an atta plant are not determined by a single ratio. They emerge from a chain: total project cost (land, building, automatic flour mill machinery, electrical installation, pre-operative expenses) plus working capital flows into production capacity and sales, which generates gross contribution, then EBITDA, profit after tax, and finally cash accrual – the actual money available for debt servicing and promoter returns.
The distinction between accounting profit and cash flow is critical. Depreciation is a non-cash charge that reduces reported profit but does not consume cash, while loan principal repayment consumes cash but does not appear on the profit statement. High PAT does not automatically mean strong cash flow or comfortable DSCR.
Two atta plants with equal turnover can show very different financial viability because of differences in:
- Machinery efficiency and power consumption per tonne
- Wheat procurement price and quality
- Atta selling price and product mix
- Capacity utilisation and production volume
- Packaging cost, freight and working-capital cycle
For a complete view of project cost and means of finance, promoters should analyse the capital structure separately before drawing conclusions about returns.
Atta Chakki Plant ROI: Meaning, Formula & Simple Illustration
Return on Investment measures the percentage return earned on the total funds invested in the project. In simple terms:
ROI = (Annual Return ÷ Total Project Investment) × 100
The key question is what “Annual Return” means. Different analysts may use PAT, cash profit, EBITDA or return on capital employed depending on the purpose. For atta chakki plant ROI calculation, many bankers prefer cash profit or average annual cash accrual rather than pure accounting profit, since cash profit reflects actual money available.
The return on investment for an atta chakki plant typically ranges from 30% to 50% annually for well-run units at optimal scale, though profit margins for atta chakki plants can vary between 10% and 30% based on operation scale, location and management. These are broad industry ranges – actual results depend entirely on project-specific conditions.
| Parameter | Illustrative Figure |
|---|---|
| Total Project Investment | ₹4.00 crore |
| Average Annual Cash Profit | ₹72 lakh |
| Indicative ROI (on total investment) | ~18% |
All figures are illustrative only.
It is important to distinguish between:
- ROI on total project cost – measures return relative to the entire investment
- ROI on promoter’s equity – measures return relative to only the promoter’s own contribution
- Return on Capital Employed (ROCE) – considers total capital (equity + long-term debt) employed in the business
- Return on Equity (ROE) – measures net profit relative to shareholder funds
Confusing these measures can lead to misleading conclusions. Always state which measure is being used in any flour mill ROI discussion.
Atta Chakki Plant IRR: Internal Rate of Return for a Flour Mill
Internal Rate of Return is the discount rate at which the present value of all future cash inflows from the atta plant exactly equals the initial project investment. In practical terms, if the IRR exceeds the cost of borrowing and the promoter’s required return, the project is generally considered financially attractive.
IRR is especially relevant for an atta manufacturing plant where cash flows extend over 8–10 years of machinery life. Unlike simple ROI, IRR accounts for the time distribution of cash flows – whether returns come early or late in the project life.
| Year | Cash Flow (₹ Lakh) |
|---|---|
| 0 (Investment) | –400 |
| 1 | 50 |
| 2 | 65 |
| 3 | 75 |
| 4 | 80 |
| 5 | 82 |
| 6 | 85 |
| 7 | 85 |
| 8 | 88 |
| Indicative IRR | ~16–18% |
Illustrative only. Calculated using standard financial methods.
Acceptable atta chakki plant IRR depends on cost of capital, bank interest rate, project risk, capacity utilisation assumptions and promoter expectations. There is no single “magic” IRR level. In professional analysis, IRR is always considered alongside DSCR, break-even and sensitivity tests on wheat price and atta selling price.
Payback Period of an Atta Chakki / Wheat Flour Mill Plant
Payback period is the time required for cumulative project cash flows to recover the initial total project investment. For projects with relatively stable annual cash inflows:
Payback Period = Initial Investment ÷ Annual Cash Inflow
The payback period for an atta chakki plant usually varies from 12 to 36 months for smaller units with lower capital outlay, while larger-scale projects (30–150 TPD) typically show payback periods in the range of 3.7 to 5.7 years depending on scale, utilisation and margin.
The difference between simple payback (ignores time value of money) and discounted payback (discounts future cash flows at a chosen rate) matters for larger investments. Simple payback is easy to understand but overstates attractiveness by treating future rupees as equal to today’s rupees.
Payback analysis is useful for risk-conscious promoters and bankers but has limitations: it ignores cash flows generated after the payback point and does not directly compare projects with very different life spans.
ROI vs IRR vs Payback Period: How They Differ in Atta Chakki Analysis
ROI, IRR and payback period are complementary tools to judge atta chakki plant investment returns, not substitutes. Each captures a different dimension of financial attractiveness.
| Parameter | ROI | IRR | Payback Period |
|---|---|---|---|
| Meaning | Percentage return on investment | Discount rate where NPV = 0 | Time to recover investment |
| What it measures | Profitability relative to capital | Time-adjusted return | Speed of capital recovery |
| Main advantage | Simple, widely understood | Considers timing of cash flows | Easy risk assessment |
| Main limitation | Ignores time value of money | Can be misleading with irregular flows | Ignores post-payback returns |
| Time value considered | No (simple ROI) | Yes | No (simple) / Yes (discounted) |
| Best use | Quick profitability snapshot | Comparing projects over time | Assessing investment risk exposure |
In my experience of preparing atta mill project reports, lenders often look at DSCR and payback first for repayment safety, while equity investors pay more attention to IRR and ROE.
Key Drivers of Atta Chakki Plant Investment Returns
The principal financial drivers that determine atta plant profitability analysis include:
- Wheat procurement price and quality – wheat cost typically forms 60–70% of total sales revenue in flour milling, making proper raw material procurement strategies critical to profit margins
- Atta selling price realisation – wholesale, retail and institutional channels offer different margins; competitive analysis should inform marketing strategies for packaged flour products
- By-product income – byproduct sales such as bran can add additional revenue streams, often contributing 15–30% of total revenue
- Capacity utilisation and production volume – detailed capacity planning directly influences how efficiently fixed expenses are absorbed
- Power cost – energy costs are a major recurring operational expense; the average industrial flour mill machine price ranges from ₹12,000 to ₹15 lakh, and the price of flour mill machines varies based on size and horsepower, affecting both capital cost and operating efficiency
- Machinery type and automation – an automatic atta plant costs approximately ₹800,000 for smaller configurations, while fully automatic atta chakki plants require minimal manual work and a fully automatic flour mill plant reduces labour costs significantly; a fully automatic atta plant handles cleaning, grinding, and packing in an integrated line
- Working-capital cycle – wheat inventory, atta stocks, receivable days and creditor days combine into a cash conversion cycle of typically 95–125 days
- Financing structure – proportion of term loan versus promoter capital, interest rate and repayment schedule directly influence net cash accrual
- Local sourcing and supply chain logistics play a critical role in optimising operating costs, and water and power requirements should be considered carefully during plant setup and layout planning
Regulatory compliance including FSSAI and GST is essential for running food processing plants in India and adds to operating cost.
Wheat Price Sensitivity Analysis: Impact on Atta Chakki Plant ROI & IRR
Wheat cost is the single largest cost component in chakki atta manufacturing. Wheat prices fluctuate seasonally and can impact overall project costs materially. Any meaningful atta chakki plant sensitivity analysis must begin with wheat price scenarios.
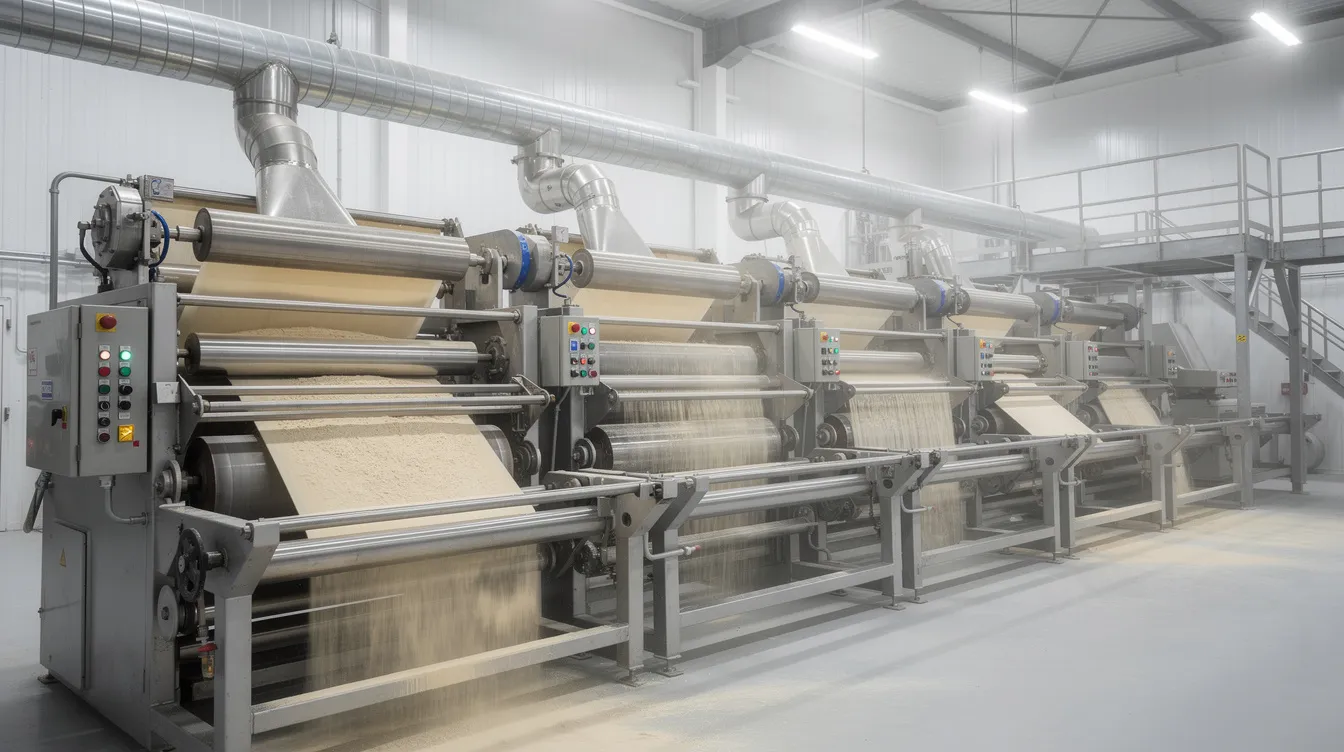
Production recovery rates from wheat processing determine the quantity of saleable flour – typically 72–75 kg of atta per 100 kg of wheat, with the remainder being bran and middlings.
Illustrative Base Case: Wheat at ₹2,400/quintal, atta selling price ₹42/kg, processing cost ~₹280/MT, contribution margin ~₹5.80/kg.
| Scenario | Wheat Price Change | Indicative Gross Margin Impact | Effect on ROI / IRR / Payback |
|---|---|---|---|
| Wheat –5% | ₹2,280/quintal | Margin improves ~₹1.20/kg | ROI and IRR improve; payback shortens |
| Base Case | ₹2,400/quintal | ~₹5.80/kg | As projected |
| Wheat +5% | ₹2,520/quintal | Margin drops ~₹1.20/kg | ROI and IRR decline; payback extends |
| Wheat +10% | ₹2,640/quintal | Margin drops ~₹2.40/kg | Significant pressure on cash accrual and DSCR |
All figures illustrative. Actual impact depends on local procurement, contracts and ability to adjust atta prices.
The inability to pass on higher wheat prices immediately to customers compresses the atta plant operating margin and can sharply reduce cash accrual. Promoters should always run at least ±5% and ±10% wheat price scenarios when reviewing any detailed project report for flour mill ROI.
Atta Selling Price Sensitivity: Effect on Contribution & Profitability
Even small changes in atta selling price (±2–5%) can materially affect the atta chakki operating margin because many costs – labour, power, rent, salaries – are largely fixed in the short term. The appropriate business model (whether selling branded retail products, wholesale supply or custom grinding as a service) can significantly affect capital requirements and price realisation.
| Selling Price Scenario | Atta Price/kg | Indicative Contribution/kg | EBITDA Margin % |
|---|---|---|---|
| –5% | ₹39.90 | ~₹3.70 | ~8% |
| –2.5% | ₹40.95 | ~₹4.75 | ~10% |
| Base Case | ₹42.00 | ~₹5.80 | ~12% |
| +2.5% | ₹43.05 | ~₹6.85 | ~14% |
| +5% | ₹44.10 | ~₹7.90 | ~16% |
Illustrative only. Wheat price held constant.
A 2–3% reduction in atta selling price can disproportionately reduce atta plant return on investment, potentially turning a comfortable DSCR into a borderline case. Automatic atta plants serve bakeries, biscuit manufacturers, hotels and retail buyers – marketing strategy, brand strength and product differentiation (multigrain atta, premium chakki atta, fortified atta) can sometimes provide pricing power and protect margins.
Capacity Utilisation Sensitivity Analysis: Volume, Fixed Costs & Returns
Capacity utilisation – actual production divided by rated capacity – is where many projections go wrong. Indian roller flour mills often operate at approximately 55–60% of capacity. Capacity utilisation significantly affects profitability in atta chakki operations, and fixed overhead costs can impact profit severely when utilisation is low.
| Capacity Utilisation | Annual Production (MT) | Revenue (₹ Lakh) | EBITDA Margin % | ROI / IRR / Payback Impact |
|---|---|---|---|---|
| 50% | 12,000 | ~504 | ~6% | Weak; payback likely >6 years |
| 60% | 14,400 | ~605 | ~9% | Marginal; DSCR may be tight |
| 70% | 16,800 | ~706 | ~11% | Moderate; broadly viable |
| 80% | 19,200 | ~806 | ~13% | Comfortable for most projects |
| 90% | 21,600 | ~907 | ~15% | Strong returns if sustained |
Based on illustrative 80 TPD plant, 300 operating days. All figures approximate.
At low utilisation, fixed costs per kg are high, depressing margins. As utilisation increases, unit fixed cost falls and overall operating margin improves. Promoters should not base atta manufacturing plant ROI only on optimistic 85–90% utilisation figures; banks typically test lower utilisation for DSCR comfort.
Power Cost Sensitivity: Electricity Impact on Flour Mill ROI
Electricity drives motors, blowers, pneumatic systems, cleaning machines that remove dust and stones from grains before grinding, and packaging lines. Automatic atta plants require 15 to 75 kilowatts of power depending on scale and configuration. Dust collection systems in modern plants achieve 99% particulate capture but add to power consumption. A 7.5 hp flour mill is ideal for mid-size grinding jobs, while larger installations consume proportionally more.
| Scenario | Power Tariff (₹/kWh) | Cost per MT (₹) | Impact on EBITDA |
|---|---|---|---|
| Base Case | ₹8.00 | ~₹320 | As projected |
| Tariff +10% | ₹8.80 | ~₹352 | EBITDA reduced ~₹32/MT |
| Tariff +20% | ₹9.60 | ~₹384 | EBITDA reduced ~₹64/MT |
Assumes ~40 kWh per MT. Illustrative only.
Higher electricity tariffs or poor power factor can gradually erode flour mill investment returns even when wheat and atta prices remain stable. Efficient motors, proper loading, preventive maintenance and appropriate automation help manage power cost per tonne in an automatic flour mill.
Operating Margin Sensitivity: Contribution, EBITDA & Cash Flow
Contribution margin (selling price minus variable cost) and EBITDA margin (EBITDA divided by sales) together determine the cash-generating capacity of the atta plant. When you examine the manufacturing process and flow of any flour mill, every stage – cleaning, tempering, milling, sifting, packing – contributes to the overall cost structure.
| EBITDA Margin Scenario | EBITDA Margin % | Annual Cash Profit (₹ Lakh) | Indicative ROI | Payback Direction |
|---|---|---|---|---|
| Base Case | 12% | 72 | ~18% | As projected |
| Margin –1% | 11% | 66 | ~16.5% | Extends |
| Margin –2% | 10% | 60 | ~15% | Extends further |
| Margin –3% | 9% | 54 | ~13.5% | Significantly longer |
Assumed turnover ₹6 crore. Illustrative only.
When turnover crosses several crore, even a 1–2% margin swing translates into a large absolute change in cash accrual and DSCR. Maintaining disciplined procurement, pricing, wastage control and process efficiency is critical to protect margins.
Combined Sensitivity Analysis: When Multiple Factors Move Together
In real business, wheat price, atta selling price, power tariff and capacity utilisation rarely move one at a time. Sensitivity analysis can help assess the impact of simultaneous fluctuations in costs and prices on ROI. Combined analysis is therefore essential for realistic atta chakki plant sensitivity analysis.
| Scenario | Key Changes | EBITDA Impact | IRR Impact | Payback | DSCR |
|---|---|---|---|---|---|
| A | Wheat +5%, atta price unchanged | Falls ~15–20% | Declines | Extends | Tight |
| B | Wheat +5%, atta price +2% | Falls ~8–10% | Moderate decline | Slight extension | Manageable |
| C | CU 10% below projection | Falls ~12–18% | Declines | Extends | May weaken |
| D | Atta price –3%, wheat +3% | Falls ~25–30% | Significant decline | Materially longer | Weak |
Directional indicators only. Actual impact requires project-specific modelling.
Stress scenarios help identify whether the project remains viable with moderate adverse changes. Promoters should insist on combined sensitivity in any detailed project report rather than accepting only single-variable tests.
Best Case, Base Case and Stress Case: Range of Possible Outcomes
| Parameter | Best Case | Base Case | Stress Case |
|---|---|---|---|
| Revenue (₹ Lakh) | 850 | 720 | 580 |
| EBITDA (₹ Lakh) | 120 | 86 | 52 |
| PAT (₹ Lakh) | 75 | 48 | 18 |
| Annual Cash Accrual (₹ Lakh) | 105 | 78 | 48 |
| ROI (Total Investment) | ~26% | ~19% | ~12% |
| IRR | ~22% | ~17% | ~11% |
| Simple Payback (Years) | ~3.5 | ~4.5 | ~7+ |
All figures hypothetical and illustrative. Not a projection of actual results.
The purpose is to understand how wide the range of outcomes can be and whether debt obligations can be met even under stress assumptions. DSCR in the stress case is the number bankers scrutinise most carefully – this metric is discussed in depth in the financial projections, working capital and DSCR resource.
Break-Even Analysis for an Atta Chakki / Flour Mill
Operating break-even is the production and sales volume at which total contribution equals fixed operating costs, resulting in zero operating profit:
Break-Even Quantity (kg) = Fixed Costs ÷ Contribution per kg
Effective project feasibility studies require evaluating demand, costs, margins and break-even points together. If annual fixed costs are ₹36 lakh and contribution per kg is ₹5.80, break-even quantity is approximately 6.21 lakh kg – or roughly 2,070 kg per day. For an 80 TPD plant producing ~58 MT of atta daily, this translates to about 36% capacity utilisation at operating break-even.
Financial break-even – including interest and loan repayment – requires a higher volume. Understanding break-even helps promoters judge minimum viable sales volume and design realistic capacity-utilisation projections.
Effect of Debt Financing on Atta Chakki Investment Returns
Term loans add interest cost and scheduled repayments to the cash-flow profile. When atta chakki plant IRR exceeds the effective cost of borrowing, return on promoter equity can be higher than ROI on total project cost – this is positive leverage.
However, excessive leverage creates tighter DSCR, higher cash-flow pressure and greater vulnerability under stress scenarios. Lenders typically examine DSCR (minimum acceptable usually ≥1.25), stability of cash accrual and promoter commitment before sanctioning large flour mill loans.
The objective is not to take maximum possible debt but to choose a balanced mix of term loan and promoter contribution that keeps the project financially resilient. CMA data preparation for bank loans should reflect this balance clearly.
Working Capital & Cash Cycle: Hidden Impact on Returns
Working capital represents funds blocked in wheat inventory, atta stocks, packaging material, receivables and routine operating expenses, minus supplier credit. In wheat and atta businesses, the cash conversion cycle is typically 95–125 days, meaning money invested in raw material does not return as cash for three to four months.
Consider two identical plants: one with 15-day receivables and another with 45-day receivables. The second plant needs substantially more working capital on the same turnover, increasing interest cost and reducing effective atta chakki plant investment returns.
Underestimating working capital can lead to liquidity stress, emergency borrowings at higher rates and disrupted production. A bankable detailed project report must realistically project working-capital needs alongside profitability, DSCR and ROI.
How Promoters Should Interpret ROI, IRR & Sensitivity Results
Promoters should go beyond headline atta chakki plant ROI percentages and examine:
- Are wheat procurement prices realistic for the chosen location and season?
- Is the expected atta selling price achievable given local competition and the best price customers can find elsewhere?
- Is the capacity ramp-up reasonable, or does the model assume near-full utilisation from day one?
- Have power, packaging, freight and maintenance costs been included at current rates?
- Has adequate working capital been considered?
- Are by-product realisations (bran, pollard) conservatively estimated?
- Can the project service debt even under moderately adverse conditions?
Sensitivity analysis results deserve more attention than the base-case headline. A project that shows comfortable returns only when everything goes right is fundamentally different from one that remains viable under moderate pressure.
How Bankers and Investors View Atta Chakki Plant Returns
Commercial banks primarily examine DSCR, cash accrual, break-even analysis and downside resilience rather than high ROI numbers alone. Bankers typically test at least one stress scenario – lower utilisation, higher raw-material cost – to ensure comfortable repayment even under pressure.
Equity investors or partners may focus more on long-term flour mill IRR, scalability (expansion to higher TPD), brand building and return on equity. Every lender or investor has different benchmark ranges, but almost all give importance to the quality and realism of assumptions.
Promoters should prepare consistent, transparent assumptions and be ready to explain wheat price, atta price and utilisation logic during appraisal discussions.
Common Mistakes in Evaluating Atta Chakki Plant Investment Returns
- Assuming 90–95% capacity utilisation from Year 1 without established customers or distribution
- Underestimating wheat procurement prices or ignoring seasonal fluctuation
- Assuming atta selling prices only increase, without accounting for competition from organised brands and local mills
- Ignoring power-tariff escalation and motor efficiency differences
- Understating packaging, freight, maintenance and roller replacement costs
- Omitting working-capital interest from projected cash flows
- Not accounting for loan repayment in cash-flow statements (confusing profit with cash)
- Presenting only a single optimistic base case without any sensitivity analysis for wheat price, utilisation or operating margin
- Ignoring by-product income or, conversely, overestimating bran realisation
- Failing to account for regulatory costs including FSSAI licensing and GST compliance
Promoters should treat very “rosy” projections with caution and seek professional review before committing to large term loans or equipment purchases.
Practical Interpretation & Professional View (By CA Manish Gugliya)
In my experience of evaluating numerous manufacturing and agro-processing projects, the quality and conservatism of assumptions matter more than whether projected atta chakki plant IRR shows 20% or 25% on paper. Numbers in a spreadsheet can be made to look attractive – the real test is whether those numbers hold when wheat prices rise, selling prices soften or capacity utilisation stays at 60% instead of 80%.
A project which remains reasonably viable under stress scenarios is usually a stronger investment than one showing very high returns only in an optimistic base case. I have seen projects with modest-looking IRR of 17–18% that performed well because the underlying assumptions were realistic and conservative. I have also seen projects projecting 28–30% IRR that ran into financial stress within two years because the assumptions were too aggressive.
No article, template or pdf can guarantee profitability or loan sanction. Each atta plant requires project-specific analysis, discussion with machinery suppliers and bankers, and a thorough understanding of local wheat markets and end-customer needs. Promoters should treat ROI, IRR, payback and sensitivity analysis as decision-support tools, not as marketing numbers.
Professional Support for Atta Chakki Project Reports & Financial Analysis
Promoters planning a commercial or automatic atta chakki plant can seek professional assistance for:
- Customised detailed project report for atta chakki and flour mills
- Financial projections including ROI, IRR, payback period and break-even calculation
- CMA data for bank loan applications
- DSCR and sensitivity analysis across wheat price, atta price, utilisation and power cost scenarios
- Project feasibility and viability assessment
All projections are customised to project size, location, machinery configuration and financing structure – not generic templates. Serious promoters may reach out via WhatsApp or phone call for professional advisory. No guarantee of profitability, specific returns or bank approval is made.
Conclusion: Using ROI, IRR & Sensitivity to Take Better Atta Chakki Decisions
Atta chakki plant ROI, IRR, payback period and break-even collectively help assess whether an atta manufacturing project is financially attractive. Each metric captures a different dimension – profitability, time-adjusted returns, speed of capital recovery and minimum viable production volume. Together, they provide a substantially more complete picture than any single number.
However, it is sensitivity analysis – across wheat price, atta selling price, capacity utilisation, power cost and operating margin – that reveals how robust or fragile those returns really are. A financially sound atta chakki project is not the one with the highest projected ROI in the base case, but the one whose cash flows and DSCR remain reasonably comfortable under realistic adverse scenarios.
Entrepreneurs today should combine realistic technical planning – right model of plant setup, machinery selection, layout and capacity – with disciplined financial modelling before making major investment or borrowing decisions. The results of that analysis, not headline profit estimates, should guide the final call.
CA Manish Gugliya
FAQ: Atta Chakki Plant ROI, IRR & Viability
What plant size is generally required for attractive Atta Chakki Plant ROI?
While even 2–5 TPD vertical flour mills are suitable for small shops or homes and can work in niche local markets, many bank-financed commercial atta plants in India are planned in the 30–120 TPD range for better economies of scale. Processing cost per MT drops from approximately ₹380–420 at 50 TPD to ₹260–300 at 100 TPD, demonstrating the impact of scale on unit economics. However, attractive ROI depends on utilisation, margin and working capital management – not only on TPD size. A well-run smaller plant can sometimes outperform a poorly managed larger unit. A tailored feasibility study is required to find the right model and optimal capacity for a specific location and market. Wheat demand continues to grow globally, and countries across the world are expanding milling capacity, but Indian site selection and local demand assessment remain fundamental.
Does an automatic flour mill always give better ROI than a semi-automatic plant?
Automatic atta plants can reduce labour cost and improve consistency, which may support higher operating margin and better flour mill ROI if capacity is fully utilised. Fully automatic machines have higher costs but save on labour – the output per worker-hour is substantially higher. However, automation also involves higher upfront machinery cost and sometimes higher maintenance requirements. The store of spare parts and commissioning support from the manufacturer should also be factored in. Therefore, automatic flour mill ROI must be evaluated against expected throughput and manpower savings. The decision should be based on scale, local labour situation and financing capacity, evaluated through project-specific financial modelling rather than a generic assumption that automation always pays for itself.
What project life should be considered when calculating Atta Chakki Plant IRR?
Many DPRs for atta mills assume an economic life of 8–10 years for main machinery, with land and building having longer useful life. In practice, IRR can be calculated over 7–10 years depending on machinery quality and features, technology, maintenance culture and market visibility. The knowledge of how well equipment holds up over time – through training of operators and proper maintenance – matters significantly. Promoters and lenders should agree on a reasonable project life assumption before relying on IRR figures. Using an unrealistically long project life inflates IRR, while an unrealistically short one understates it.
How do government subsidies or incentives affect Atta Chakki Plant investment returns?
Capital subsidies, interest subventions or state-level incentives can improve effective ROI and shorten payback by reducing net promoter investment or borrowing cost. Some schemes are available for food products manufacturing under MSME categories, and people planning new ventures should check current eligibility. However, such benefits must be treated carefully in projections – timing of disbursement, eligibility conditions and documentation requirements matter. ROI and IRR should be analysed both with and without subsidies to understand underlying project strength. Availability of schemes opens and changes over time across states, so updated professional advice via email or direct contact is recommended before relying on subsidy assumptions. Information shared on any external website about subsidies should be verified from official sources.
Can a small local chakki compete with large branded atta players and still be viable?
Smaller mills usually compete on freshness, local relationships, custom grinding for customers, safe and additive-free products or niche items like pulses and specialty flour rather than mass advertising against large brands. Their investment and ROI profile is fundamentally different from a large packaged-atta brand spending on delivery networks and national distribution. Viability depends on local demand, procurement access, operating efficiency and the ability to maintain stable margins. Even for smaller units, sensitivity analysis is useful – a buy decision on machinery should be preceded by structured projections including basic ROI and payback calculations. Promoters who started with informal estimates often find that a structured financial guide, even at small scale, helps build confidence and avoid costly mistakes. The growing market for freshly manufactured chakki atta supports local mills, but structured planning remains essential.