Key Takeaways
- Atta manufacturing financial projections must connect installed capacity, capacity utilisation, wheat consumption, atta recovery, by-product revenue, operating costs, working capital cycle, cash flow and DSCR into one integrated model – simply multiplying installed capacity by MRP produces misleading results.
- Realistic assumptions on wheat cost, atta production yield percentage, inventory days, receivable days and creditor days directly determine the atta plant working capital requirement and debt service coverage ratio.
- A complete atta flour mill financial model should include a projected profit and loss statement, projected cash flow statement and projected balance sheet that are fully interconnected across at least five projection years.
- All numerical examples in this article are illustrative figures only – actual atta manufacturing project financials must be prepared using plant-specific quotations, local cost data and confirmed financing terms.
- Project Report Bank, led by CA Manish Gugliya, provides customised DPR, CMA data and bank-ready atta chakki financial projections for serious entrepreneurs and MSME promoters.
Introduction: Why Atta Manufacturing Financial Projections Must Be Integrated
Many entrepreneurs planning a flour mill business attempt to prepare projections by multiplying installed TPD capacity by expected selling price per kg. The result is an impressive-looking turnover figure that often has little connection with the actual cash the business can generate. This approach ignores wheat consumption, recovery losses, by-product economics, packaging costs, credit terms, working capital and debt obligations – and it rarely survives scrutiny by a credit officer at any bank.
A realistic atta flour mill financial model must connect the full chain: installed capacity → capacity utilisation → wheat requirement → atta production yield percentage → by-product quantity → net selling price → operating expenses → working capital cycle → EBITDA → cash accrual → term loan repayment → DSCR. Financial projections for atta manufacturing require assessing operational drivers like raw material costs, power consumption and market realisation before any revenue number is projected.
Lenders evaluating an atta manufacturing DPR or atta chakki project report financial analysis examine the assumptions behind wheat procurement cost, recovery, margins, inventory days and receivable days – not just the projected turnover. Low margins and high volume characterise the atta manufacturing sector, which means that even small deviations in cost or realisation can make a significant difference to viability.
In my experience as a practising Chartered Accountant reviewing flour milling and atta chakki DPRs for over 20 years, I have frequently seen bank proposals fail because the projections ignore working capital, overstate Year-1 utilisation or treat MRP as manufacturer realisation.
Understanding Financial Projections for an Atta Manufacturing Plant
A complete atta flour mill financial model should cover projected sales, wheat and other raw material consumption, manufacturing and operating costs, employee cost, administration expenses, selling expenses, EBITDA, depreciation, interest, profit before tax, tax, profit after tax and cash accrual. A structured approach to projections includes revenue forecasts, cost of goods sold, and operating expenses linked to production volumes.
For a bankable flour mill project report or detailed project report, projections must also include:
- Projected profit and loss statement (minimum 5 years)
- Projected cash flow statement
- Projected balance sheet
- Working capital assessment with gap analysis
- Term loan repayment schedule
- Break-even analysis
- Year-wise DSCR calculation
Projected statements must be mathematically interconnected. A change in capacity utilisation should automatically update wheat requirement, sales, raw material cost, working capital and DSCR. If these statements are prepared independently in separate spreadsheets, inconsistencies will appear – and experienced bankers notice them quickly.
Atta manufacturing DPR financial projections prepared for bank finance or government schemes such as PMFME, PMEGP or Mudra should cover at least 5 years, often up to 7–10 years depending on the loan tenure.
Start With Installed Capacity and Capacity Utilisation
The installed capacity of a wheat flour atta plant – for example 30 TPD, 60 TPD or 100 TPD – represents the theoretical maximum output under ideal conditions. Actual achievable production is always lower because of planned maintenance, power interruptions, market constraints and the stabilisation period for new machinery. Capacity utilization significantly impacts cost-per-kg for milling operations, making this assumption the starting point for every other projection.
An illustrative capacity utilisation ramp-up for a new commercial atta plant might look like this:
| Year | Illustrative Utilisation |
|---|---|
| Year 1 | 50% |
| Year 2 | 60% |
| Year 3 | 70% |
| Year 4 | 75% |
| Year 5 onwards | 80% |
These percentages are for illustration only. Actual utilisation must reflect the specific project’s market, distribution and commissioning timeline.
Banks expect realistic capacity utilisation of 45–55% in Year 1 for a new atta plant. Key factors that influence this include local atta demand, distribution and branding strength, wheat availability, plant reliability, power supply quality and the commissioning period. Capacity utilization planning is critical for scheduling business growth in the flour milling industry, and every subsequent projection – sales, wheat consumption, operating costs and break-even point – flows from this assumption.
For a deeper understanding of how installed capacity connects with production planning, refer to the guide on atta plant capacity planning and production capacity.
Wheat Requirement and Raw Material Cost Assumptions
Wheat cost in atta manufacturing is usually the single largest cost item. Raw material costs account for 75% to 85% of total costs in flour milling, which means that even a 3–5% increase in wheat procurement cost per kg can materially reduce atta plant profitability.
Annual wheat requirement can be estimated as:
Annual Wheat Requirement (MT) = Planned Atta Output (MT) ÷ Expected Recovery Percentage
For example, a 30 TPD mini flour mill operating at 60% utilisation produces approximately 18 MT of atta per day. Over 300 working days, annual atta production is roughly 5,400 MT. At 72% wheat extraction recovery, the annual wheat requirement would be approximately 7,500 MT. If wheat is purchased at ₹25 per kg, the annual wheat procurement cost alone comes to roughly ₹18.75 crores.
Wheat prices fluctuate seasonally and should be factored into financial projections for atta manufacturing. Factors influencing raw material cost include mandi price trends, transportation cost, moisture and quality assessment, storage losses and the promoter’s procurement strategy – whether buying in bulk post-harvest or purchasing throughout the year.
The atta plant inventory requirement for wheat must also consider how many days of stock the promoter plans to hold. Working capital planning is essential due to the seasonal nature of wheat procurement, and holding 30–60 days of wheat inventory post-harvest is common in many regions.
Atta Yield, Recovery and By-Product Revenue
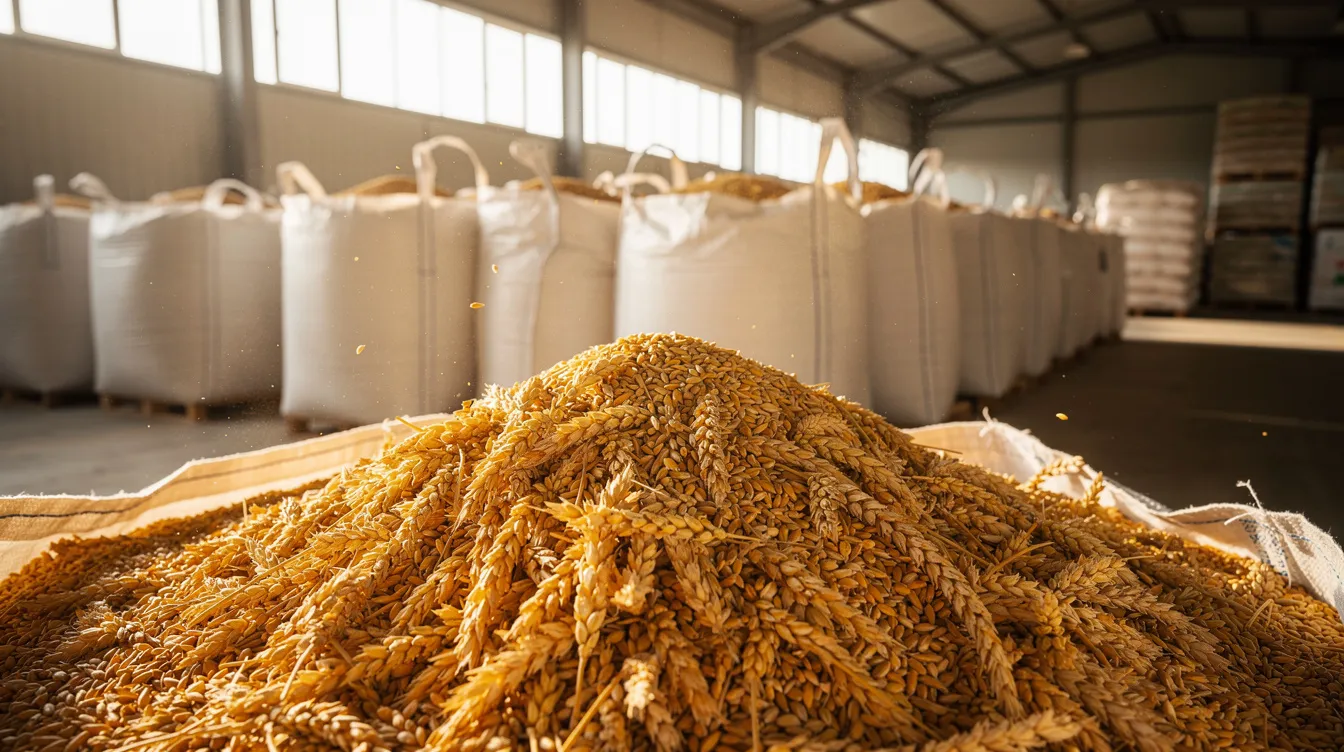
Material balance in flour milling determines how much of each input becomes saleable output. From 100 kg of wheat, approximate outputs might be:
| Output | Illustrative Quantity |
|---|---|
| Atta (whole wheat flour) | 72–75 kg |
| Bran | 20–22 kg |
| Refractions and process loss | 3–5 kg |
This is for illustration only. Actual recovery depends on wheat quality, milling machinery type, extraction level and product specification.
Wheat extraction recovery rates typically range from 72% to 78% in milling processes, as documented in ICAR studies on Indian wheat varieties. Higher extraction levels mean more atta per unit of wheat but may affect product quality, shelf life and bran revenue.
Bran by-product revenue can meaningfully improve the atta plant profit margin. If 7,500 MT of wheat produces roughly 1,650 MT of bran annually, and bran is sold at ₹5,000 per MT, atta manufacturing by-products income could be approximately ₹82.5 lakh – a material offset against raw material cost. However, bran pricing and offtake assumptions must be conservative and based on actual local demand.
The atta manufacturing revenue projection should separately consider primary atta products and by-product sales to correctly compute total revenue. For more on the production process and material flow, see the article on atta manufacturing process and flour mill flow.
Sales Assumptions for an Atta Manufacturing Project
Atta plant sales projections should be built from the bottom up rather than assumed as a lump-sum figure:
Projected Sales (₹) = Saleable Quantity (kg) × Expected Net Realisation (₹/kg)
The sales model should include projections for both consumer-ready packs and bulk supplies. Revenue from packaged wheat flour in branded 5 kg or 10 kg bags carries a higher gross margin but involves packaging, branding and distribution costs. Bulk loose atta sold to local shops or institutional supplies to canteens and hotels may have lower margins but faster movement.
Selling prices for atta should consider market dynamics and channel differences. Net realisation is not the MRP printed on the packet – it is the ex-mill price after subtracting distributor and retailer margins, trade promotions, freight where borne by the manufacturer, and any scheme discounts. In a flour mill business plan, the gap between MRP and net realisation can be 15–25%, and failing to account for this is one of the most common projection errors.
Sales projections should be aligned with market research and the promoter’s actual distribution capacity, not just theoretical production capability.
Manufacturing and Operating Cost Assumptions
Major operating cost heads in an atta manufacturing plant include:
- Wheat procurement (the dominant cost)
- Packing material cost
- Electricity and power (high power consumption is a critical cost for grinding units)
- Labour and supervision
- Repairs and maintenance
- Freight and handling
- Quality control and FSSAI compliance (FSSAI license is mandatory for food processing units)
- Insurance
- Factory overheads
- Administration expenses and selling expenses
A detailed cost breakdown per kilogram assists in understanding profitability in atta production. Variable costs – wheat, packaging, outward freight, power proportional to production – move with output. Fixed costs – salaries, rent, minimum power charges, security, administrative overheads – remain relatively constant regardless of utilisation. This classification is essential for break-even analysis.
Illustrative Operating Cost Structure (Example Only)
| Cost Head | Approximate % of Total Cost |
|---|---|
| Wheat and raw materials | 75–85% |
| Packaging material | 3–5% |
| Power and fuel expenses | 4–6% |
| Labour and supervision | 3–5% |
| Other overheads | 3–6% |
Illustrative figures only – actual proportions depend on plant scale, machinery efficiency and local costs.
For detailed guidance on how atta plant machinery and equipment cost affects capex and operating expenses, refer to the linked guide. Working capital interest and bank charges should also be explicitly included in the finance cost section of atta manufacturing project financials.
Estimating EBITDA and Operating Margin
The EBITDA computation follows a straightforward structure:
Revenue (atta + by-products) – Wheat and other raw materials – Power and fuel – Labour and wages – Manufacturing overheads – Selling and administration expenses = EBITDA
EBITDA – Earnings Before Interest, Tax, Depreciation and Amortisation – indicates the operating surplus generated by the flour mill business before accounting for financing structure and capital asset write-offs. The atta manufacturing EBITDA margin is expressed as EBITDA divided by total sales.
However, EBITDA is not cash available for loan repayment. It does not account for term loan interest, principal repayment, income tax, working capital changes or capital expenditure. Promoters should clearly distinguish between:
- EBITDA – operating surplus
- EBIT – EBITDA minus depreciation
- Profit Before Tax – EBIT minus interest
- Profit After Tax – after income tax
- Cash Accrual – PAT plus depreciation, often used to assess atta plant debt repayment capacity
Working Capital Requirement of an Atta Manufacturing Plant
Good atta manufacturing financial projections often fail in practice because the atta plant working capital requirement is underestimated or ignored entirely. A project may look profitable on paper but face persistent cash shortages if the cash conversion cycle is not properly funded.
The working capital cycle operates as follows:
Cash → Wheat Inventory → Processing → Finished Goods → Sales → Receivables → Cash
The time taken in this cycle determines the working capital gap. Working capital gap analysis is crucial for flour mill projections, and banks will examine this carefully before sanctioning limits.
Main current assets for an atta plant include wheat inventory, packaging material inventory, finished goods inventory, trade receivables and minimum cash and bank balance.
Main current liabilities (excluding bank borrowings) include trade creditors for wheat and packing material, wages payable, statutory dues and other accrued expenses that partly fund the working cycle.
The working capital assessment for an atta plant must quantify inventory days, receivable days and creditor days realistically.
Raw Material Inventory
Wheat inventory working capital depends on procurement strategy. Some atta plants hold 30–60 days of wheat stock post-harvest to manage price volatility and ensure supply continuity, while others with reliable year-round supply maintain lower stock days. Holding larger stocks locks up significant cash – for a plant consuming 25 MT of wheat per day at ₹25/kg, 30 days of wheat inventory alone represents approximately ₹1.87 crores.
Raw material inventory is valued on the projected balance sheet at landed cost per kg multiplied by quantity in stock. Inventory days are typically computed as (Average Stock ÷ Annual Consumption) × 365. Higher wheat inventory days increase the atta plant working capital gap and the need for cash credit or working capital borrowing.
Finished Goods Inventory
A commercial atta manufacturing unit must maintain finished goods inventory of packed atta and by-products to service orders without delay, typically expressed in days of cost of production. By-products such as bran may also sit in stock if not immediately lifted by buyers.
For example, if a plant keeps 10 days of finished goods and monthly cost of production is ₹1.5 crores, the finished goods inventory value is roughly ₹50 lakh. Longer finished goods holding increases storage cost and working capital requirement, both of which must be captured in atta manufacturing cash flow projections.
Receivables
Typical credit practices in atta distribution vary:
- Partial cash-and-carry for small retailers
- 7–15 days credit for local wholesalers
- 21–45 days for institutional buyers, modern trade and chain stores
- Advance payments in some B2B contracts
Receivable days are calculated as: (Average Debtors ÷ Annual Credit Sales) × 365. A higher atta plant receivables calculation – for example 30–45 days – increases the working capital gap and therefore interest cost, directly affecting DSCR. Projections should differentiate between cash sales and credit sales to estimate realistic receivable levels.
Creditors
Suppliers of wheat and packing material often provide trade credit of 7–30 days, which partially finances the operating cycle. The formula for working capital gap is:
Working Capital Gap = Current Assets – Current Liabilities (other than bank borrowings)
Banks generally fund a percentage of the working capital gap as drawing power under cash credit limits, with the balance funded by promoter margin money. In credit monitoring arrangement (CMA data) formats for atta plant bank loan projections, these inventory and creditor assumptions appear in stock statements and working capital assessment tables.
Illustrative Working Capital Calculation
Illustrative Example Only – Working Capital Assessment for a 25 TPD Atta Plant at 60% Utilisation
| Particulars | Amount (₹ Lakh) |
|---|---|
| Current Assets | |
| Wheat inventory (30 days) | 112.50 |
| Packaging material inventory (15 days) | 6.25 |
| Finished goods inventory (10 days) | 50.00 |
| Trade receivables (15 days) | 56.25 |
| Cash and bank balance | 5.00 |
| Total Current Assets | 230.00 |
| Current Liabilities | |
| Trade creditors (15 days) | 56.25 |
| Other current liabilities | 8.00 |
| Total Current Liabilities | 64.25 |
| Working Capital Gap | 165.75 |
| Bank cash credit (say 75% of gap) | 124.31 |
| Promoter margin money (25%) | 41.44 |
Illustrative figures only – actual projections will depend on plant-specific assumptions, local costs and bank assessment methodology.
Different banks may use the turnover method, operating cycle method or projected balance sheet method for working capital assessment. The promoter should discuss the applicable method with the financing bank.
Term Loan and Means of Finance
Key project cost components for a wheat flour atta plant include land and site development, factory building and civil construction, plant and machinery, electrical and utility installations, pre-operative expenses and margin for working capital.
Project costs vary significantly with scale. A small atta chakki unit costs ₹3–8 lakh. A 500 kg/day flour mill costs ₹9–27 lakh. A commercial-scale flour mill costs ₹30–60 lakh. Typical project costs for smaller setups range from ₹2–25 lakh, as documented by the Ministry of Food Processing Industries cost norms.
Typical means of finance include:
- Promoter contribution (equity): minimum promoter contribution is typically 10–25% of project cost
- Term loan: banks fund 75–90% of the project cost as loans
- Working capital limits: separate cash credit or overdraft facility
- PMEGP subsidy: PMEGP offers a 15–35% subsidy on project costs for eligible units
A balanced debt–equity ratio is important for maintaining a reasonable interest burden, adequate DSCR and acceptable leverage. For a detailed discussion on atta plant project cost and means of finance, refer to the linked guide. Promoters seeking capex ranges for different plant sizes may also find the article on atta chakki plant setup cost in India useful.
Loan Repayment Schedule
The atta plant loan repayment schedule should consider the project implementation timeline – land acquisition, building construction, machinery installation, trial run and commencement of commercial production – with a realistic moratorium on principal repayment during the implementation and stabilisation period.
Equal quarterly instalments or structured step-up repayments affect yearly principal repayment and therefore DSCR for an atta manufacturing project.
Illustrative Term Loan Amortisation (₹2 Crore Loan, 7 Years, 1-Year Moratorium)
| Year | Opening Balance (₹ Lakh) | Principal Repaid (₹ Lakh) | Interest @ 11% (₹ Lakh) | Closing Balance (₹ Lakh) |
|---|---|---|---|---|
| 1 | 200.00 | 0.00 | 22.00 | 200.00 |
| 2 | 200.00 | 33.33 | 20.17 | 166.67 |
| 3 | 166.67 | 33.33 | 16.50 | 133.33 |
| 4 | 133.33 | 33.33 | 12.83 | 100.00 |
| 5 | 100.00 | 33.33 | 9.17 | 66.67 |
| 6 | 66.67 | 33.33 | 5.50 | 33.33 |
| 7 | 33.33 | 33.33 | 1.83 | 0.00 |
Illustrative figures only – actual repayment structure will depend on sanctioned terms.
Overly aggressive repayment – very short tenure or heavy early instalments – can depress DSCR and make otherwise viable atta manufacturing cash flow projections look financially strained. Promoters should evaluate multiple repayment scenarios while planning atta plant bank loan projections.
Understanding DSCR for an Atta Manufacturing Project
The debt service coverage ratio is a measure of how comfortably the project can service its interest and principal obligations from its own cash generation. In simple terms, if the plant generates ₹1.50 of cash for every ₹1.00 of loan repayment due, the DSCR is 1.50.
The conceptual formula is:
DSCR = Cash Available for Debt Service ÷ Debt Service (Interest + Principal Repayment)
Cash available for debt service in atta manufacturing DSCR analysis is usually taken as cash accrual – profit after tax plus depreciation – plus or minus specific non-cash or non-operating adjustments, depending on the lender’s format.
Banks typically examine both yearly DSCR and average DSCR for the atta plant across the entire loan tenure. A Debt Service Coverage Ratio above 1.5 is generally required for approval, though the RBI and individual lender policies may vary depending on collateral, promoter profile and industry risk.
There is no single guaranteed DSCR level that ensures sanction. Acceptable DSCR depends on the overall financial strength of the proposal.
Illustrative DSCR Calculation
Illustrative DSCR Computation – Example Only
| Particulars | Amount (₹ Lakh) |
|---|---|
| Profit After Tax | 38.00 |
| Add: Depreciation | 12.00 |
| Cash Accrual | 50.00 |
| Interest on Term Loan | 16.50 |
| Principal Repayment | 33.33 |
| Total Debt Service | 49.83 |
| DSCR | 1.00 (50.00 ÷ 49.83) |
This example is intended only to explain the calculation methodology and should not be treated as a lending benchmark.
In this example, the DSCR is barely at 1.00 – indicating almost no cushion. If wheat cost rises, sales realisation drops or utilisation falls below projection, DSCR would slip below 1.0 and the project would not be able to service its debt. This illustrates why DSCR should always be examined under multiple scenarios, not only the base case.

Projected Profit & Loss Statement
The projected profit and loss for an atta manufacturing plant follows a standard structure: turnover (atta plus by-products) minus raw material consumption equals gross profit; subtract manufacturing, employee, selling and administration expenses to arrive at EBITDA; then subtract depreciation and interest to get profit before tax; deduct tax to arrive at profit after tax.
Flour mill financial projections must include 5-year P&L statements. Flour mills achieve net profit margins of 18–24% at 70% capacity utilisation when operating costs are well controlled and wheat procurement is efficiently managed.
Illustrative 5-Year Projected P&L for a Commercial Atta Plant
| Particulars (₹ Lakh) | Year 1 | Year 2 | Year 3 | Year 4 | Year 5 |
|---|---|---|---|---|---|
| Capacity Utilisation | 50% | 60% | 70% | 75% | 80% |
| Sales (Atta + By-products) | 950 | 1,140 | 1,330 | 1,425 | 1,520 |
| Raw Material Cost | 740 | 878 | 1,010 | 1,075 | 1,140 |
| Other Operating Costs | 95 | 105 | 115 | 120 | 125 |
| EBITDA | 115 | 157 | 205 | 230 | 255 |
| EBITDA Margin | 12.1% | 13.8% | 15.4% | 16.1% | 16.8% |
| Depreciation | 30 | 28 | 26 | 24 | 22 |
| Interest | 32 | 28 | 23 | 18 | 13 |
| Profit Before Tax | 53 | 101 | 156 | 188 | 220 |
| Tax (25%) | 13 | 25 | 39 | 47 | 55 |
| Sales Net Profit | 40 | 76 | 117 | 141 | 165 |
Illustrative figures only – actual projections will depend on plant-specific assumptions.
In a real detailed project report, the atta flour mill financial model must include detailed schedules behind each line item, not just aggregate values.
Projected Cash Flow Statement
Accounting profit and cash flow are different for an atta plant. Cash flow includes the effect of capital expenditure, term loan drawdown, principal repayment and changes in working capital – none of which appear in the profit and loss statement. Cash flow projections are crucial to ensure liquidity in the atta manufacturing business.
The main blocks of a projected cash flow statement are:
- Cash from operations – net profit adjusted for depreciation, working capital changes and non-cash items
- Cash used in investing activities – purchase of fixed assets, plant and machinery
- Cash from financing activities – equity infusion, term loan receipt, repayment of principal, interest
An atta plant can show accounting profit but still face negative cash flow in a year with heavy loan instalments, increased wheat inventory or extended receivable periods. Banks and investors reviewing atta manufacturing cash flow projections focus on whether operating cash flows are adequate to meet term loan repayment and working capital interest. Cash flow statements must reconcile with the projected P&L and projected balance sheet to ensure internal consistency.
Projected Balance Sheet
The projected balance sheet for an atta plant shows the financial position at the end of each year. Key components include:
Assets side: fixed assets (gross block less accumulated depreciation), current assets (wheat and finished goods inventory, trade receivables, cash and bank balance) and any other investments.
Liabilities side: equity capital, reserves and surplus (accumulated profits), term loan outstanding, working capital borrowings and current liabilities (trade creditors, statutory dues).
Closing balances change each year based on capital expenditure, depreciation, profit retention, loan drawdown and repayments, and working capital movement. Banks often cross-check ratios such as total outside liabilities to tangible net worth (TOL/TNW), current ratio and total debt to EBITDA from the projected balance sheet and P&L combined. These projections directly feed into CMA data formats used for atta plant bank loan proposals.
Break-Even Analysis
Break-even analysis determines the volume of flour sales needed to cover total costs in atta production – the point where the plant neither makes a profit nor incurs a loss. A DPR should include a break-even analysis for viability assessment.
The key concepts are:
- Fixed costs – salaries, rent, minimum power, admin overheads, depreciation, interest
- Variable costs – wheat, packaging, freight, power proportional to production
- Contribution per kg – selling price per kg minus variable cost per kg
The formulas:
- Break-even Sales (₹) = Fixed Costs ÷ Contribution Margin Ratio
- Break-even Production (MT) = Fixed Costs ÷ Contribution per MT
For example, if annual fixed costs are ₹80 lakh and contribution per kg of atta is ₹4, the break-even production is 200 MT per year. If the plant has annual capacity of 2,700 MT at 50% utilisation, the break-even utilisation is roughly 7.4% – indicating a comfortable cushion. Plants with lower break-even utilisation have more resilience against demand drops, though this should not be the sole investment conclusion.
Sensitivity Analysis for an Atta Manufacturing Plant
In practice, atta manufacturing EBITDA margin and atta plant profit margin are highly sensitive to wheat price changes, selling price variations and utilisation levels. Sensitivity analysis should account for fluctuations in input costs such as wheat prices in financial models.
Key scenarios to evaluate:
Illustrative Sensitivity Analysis (Impact on Year-3 Projections)
| Scenario | Impact on EBITDA | Impact on DSCR |
|---|---|---|
| Wheat price up 5% | EBITDA falls ~25% | DSCR may drop below 1.2 |
| Net selling price falls 3% | EBITDA falls ~20% | DSCR reduces meaningfully |
| Utilisation 10% below plan | EBITDA falls ~15% | DSCR under pressure |
| Receivable days increase to 30 | Marginal EBITDA effect | Working capital cost rises, cash flow stressed |
| Power tariff rises 10% | EBITDA falls ~3–4% | Small DSCR reduction |
Illustrative figures only – actual sensitivity depends on plant-specific cost and revenue structures.
Promoters and lenders should pay particular attention to scenarios where DSCR drops close to 1.0 or below, as these indicate thin repayment comfort. One practical issue I frequently observe in atta project projections is that sensitivity analysis reveals projects appearing comfortable at base case face tight liquidity if wheat price or realisation move only 3–5% against the promoter.
Financial Ratios Banks May Examine
Banks reviewing atta manufacturing projects typically evaluate:
| Ratio | What It Indicates |
|---|---|
| DSCR (yearly and average) | Debt repayment capacity from cash generation |
| Current Ratio | Short-term liquidity position |
| Debt-Equity Ratio | Financial leverage and promoter stake |
| TOL/TNW | Total outside liabilities relative to net worth |
| EBITDA Margin | Operating efficiency |
| Net Profit Margin | Bottom-line profitability |
| Interest Coverage Ratio | Ability to cover interest from operating profit |
| Inventory Holding Period | Efficiency of stock management |
| Receivable Period | Speed of collection from customers |
Banks may apply their own internal benchmarks. Realistic assumptions on wheat inventory days, receivable days and margin levels are generally valued more by a credit officer than artificially high DSCR achieved through unrealistic selling prices. Ratios derived from atta chakki financial projections should show consistent year-on-year trends without abrupt, unexplained jumps.
Common Errors in Atta Plant Financial Projections
Frequent mistakes observed in atta manufacturing financial projections include:
Revenue and production errors:
- Assuming 90–100% capacity utilisation from Year 1
- Using consumer MRP as net realisation instead of ex-mill price
- Ignoring distributor and retailer margins
- Overstating atta recovery beyond realistic extraction levels
- Completely ignoring by-products revenue or over-valuing bran income
Working capital errors:
- Assuming zero receivables or immediate cash collection
- Using very low inventory days despite seasonal wheat procurement
- Excluding interest on working capital from projections
- Assuming all purchases on long credit while all sales are cash
Financing and structural errors:
- Showing extremely low promoter contribution
- Very short loan tenure creating heavy instalments
- Reverse-engineering assumptions solely to achieve a target DSCR
- Preparing P&L without integrating cash flow and balance sheet
Projections are decision-support tools, not sales brochures. They should reflect commercially realistic scenarios even if DSCR or profit margins appear modest. As a Chartered Accountant reviewing atta chakki project reports, I frequently advise promoters to rework wheat price and realisation assumptions before approaching banks – sound business decisions require honest numbers, not optimistic ones.
Importance of Plant Layout and Infrastructure in Financial Planning
Land, building and layout choices directly affect project cost, depreciation, material handling cost, fuel expenses and potential for future expansion. Efficient plant layout can reduce internal transport, labour requirement and wastage, improving operating margins and the projected pay back period.
Building design should provide separate zones for wheat cleaning, milling, packaging and finished goods storage to meet hygiene standards and FSSAI inspection requirements. For detailed guidance, refer to the article on atta plant land, building and layout requirements.
Infrastructure and site development expenditure assumptions feed directly into depreciation, term loan amount and ultimately DSCR in atta manufacturing financial projections.
How Machinery Selection Affects Financial Projections
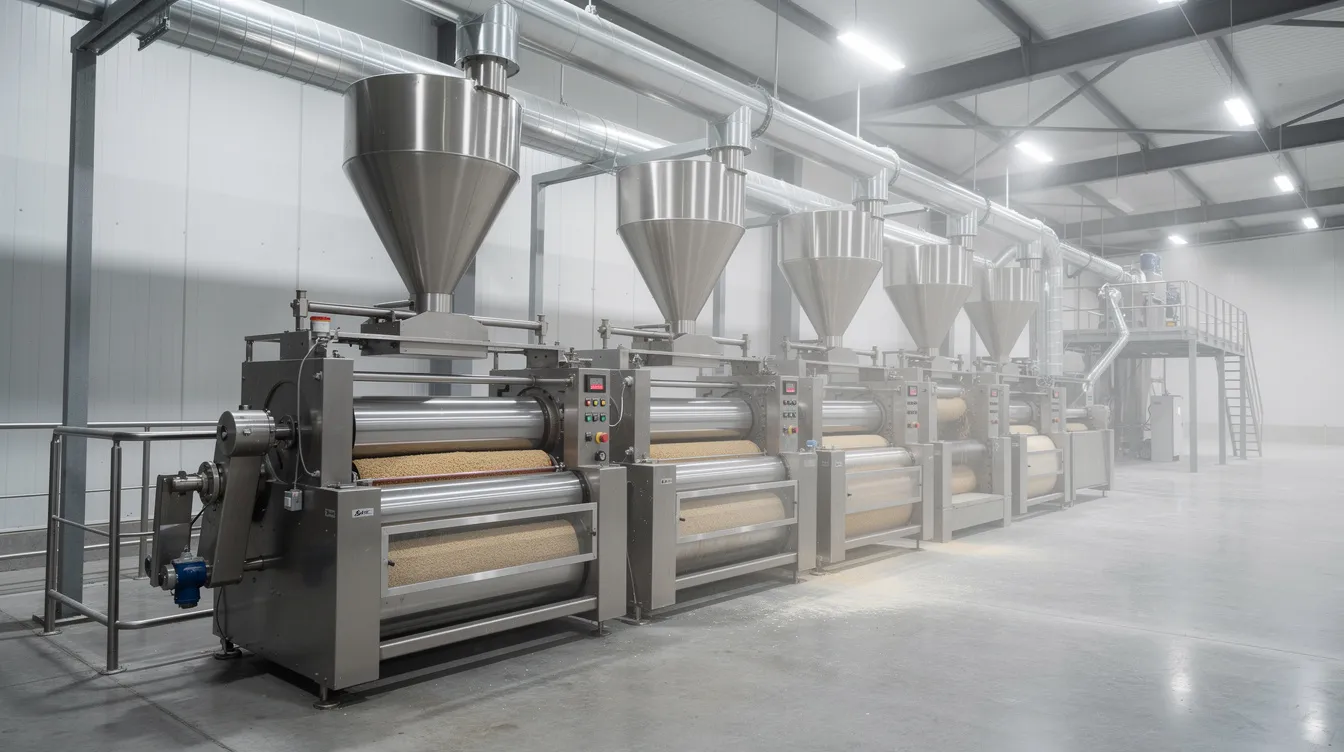
Choosing between different types of machinery – stone-based atta chakki versus a fully automatic roller flour mill – affects installed capacity, power consumption, atta yield, labour requirement and maintenance cost. Operational efficiency in milling directly impacts survival in the atta manufacturing sector.
Higher-efficiency machinery, though costlier upfront, may offer better atta production yield percentage, lower specific power consumption and a potentially improved EBITDA margin over the long term. Machinery cost impacts capex, depreciation, interest during construction and term loan quantum – all of which must be correctly reflected in the atta flour mill financial model.
For example, a modern automatic plant with 70% recovery and lower power consumption per kg may generate a gross margin 2–3% higher than a conventional chakki with 68% recovery and higher power cost, even though the upfront machinery cost is significantly larger. This trade-off is best evaluated through an integrated financial model rather than by comparing machinery cost alone. Readers requiring capex details may refer to the earlier guide on atta plant machinery and equipment cost.
Financial Projections for Bank Finance vs Internal Planning
Projections prepared for bank finance focus strongly on repayment capacity, DSCR, working capital requirement, collateral coverage and compliance with scheme guidelines. A bank ready project report requires detailed schedules including CMA data, security details and year-wise DSCR. Internal planning models may go deeper into product mix, marketing spend, gradual demand increase scenarios and long-term expansion.
Both models should still be based on the same realistic operational assumptions – only the presentation and emphasis change. Promoters should first build an internal atta flour mill financial model testing different wheat prices, selling prices and utilisation levels, and then finalise the bank-ready version. This avoids repeated reworking later. For investors, IRR, payback period and return on equity may be more central, while banks place more weight on DSCR, current ratio and security coverage.
Role of DPR and CMA Data in Atta Manufacturing Finance
A Detailed Project Report for a wheat flour atta plant should contain market analysis (including target customer group identification and industry trends), technical details covering the manufacturing process, plant capacity, DPRs must include machinery specifications and production capacity, project cost, means of finance, key financial projections, working capital assessment, DSCR and risk analysis. Banks require a structured DPR to assess repayment capacity and project feasibility.
CMA data is mandatory for loans above ₹10 lakh. It converts atta manufacturing financial projections into a standardised multi-year format showing projected balance sheets, profit and loss accounts, fund flow, working capital gap and drawing power calculations.
In my practice, atta manufacturing DPR financial projections are prepared based on assumptions discussed with the promoter, machinery quotations, local cost estimates and tentative loan terms – they represent reasoned financial estimates, not certifications of future performance. Professional financial analysis aids in navigating the complexities of project finance and economic viability in manufacturing.
If you are planning a commercial atta manufacturing project and need customised DPR, financial projections, working capital assessment or DSCR analysis, the assumptions should be developed around your proposed capacity, machinery, location, funding structure and expected market. You may reach out to Project Report Bank for professional advisory, or refer to the page on CMA Data preparation for bank finance for further details. A well-prepared wheat flour mill project report can help banks understand the working capital cycle, break-even analysis and DSCR clearly, supporting faster credit decisions – though not guaranteeing approval.
Practical Financial Model Framework for an Atta Plant
A stepwise framework for building an integrated financial model:
- Determine installed capacity (TPD, annual production capacity)
- Estimate capacity utilisation over 5–7 years (gradual demand increase day by day)
- Calculate annual wheat requirement based on production plan
- Assume recovery and by-product ratios for the chosen machinery
- Forecast atta and by-product sales volumes (including packaged wheat flour and bulk)
- Apply realistic net realisation to compute atta plant sales projections
- Estimate wheat procurement cost and other variable raw material cost
- Build an operating expense budget covering all cost heads
- Compute EBITDA and EBITDA margin
- Prepare working capital assessment with inventory days, receivable days and creditor days
- Define project cost and means of finance (equity, term loan, existing proposed total particulars)
- Design a loan repayment schedule aligned with cash accrual
- Prepare projected P&L, cash flow and balance sheet
- Calculate DSCR and key financial ratios
- Run sensitivity analysis on wheat price, selling price, utilisation and credit terms
Each step must flow into the next so that any change in assumptions – wheat price, utilisation or recovery – automatically updates all outputs, including DSCR for atta manufacturing project. This framework serves as a checklist when reviewing any atta chakki project report financial analysis, and a well-structured model can be extended later to include maida, suji, gluten flour or other grains without rebuilding from scratch. It can also accommodate analysis of existing units considering expansion.
Project Report Bank develops such integrated models tailored to specific capacities – mini flour mill, mid-size or large commercial wheat flour atta plant – and various funding structures, providing a profitable project assessment rather than generic templates. This is not just a business idea on paper; it represents a rigorous framework for investment opportunities in the food processing and flour milling industry.
Conclusion
The financial viability of an atta manufacturing project depends on the realistic integration of wheat procurement cost, atta recovery, by-product revenue, net selling price, capacity utilisation, operating costs, working capital cycle and financing structure. Strong atta manufacturing financial projections are not about showing maximum possible profit but about demonstrating that the plant can generate sustainable EBITDA, adequate cash accrual and comfortable DSCR across varying conditions. The food industry demands discipline – it is among the basic food ingredients of the industrial world, but margins in consumed flour products remain thin and volume-dependent.
Before committing capital to a wheat flour atta plant, promoters should test multiple scenarios for wheat price, selling price and utilisation and examine the impact on DSCR and liquidity, not just on accounting profit. Industry performance depends on how well these variables are managed over time.
If you are serious about launching or expanding an atta plant and require customised DPR, atta chakki financial projections, working capital assessment, repayment schedule design or DSCR analysis based on your specific capacity, machinery, location and funding structure, you are welcome to connect with CA Manish Gugliya at Project Report Bank – preferably via WhatsApp – for a professional discussion around your other project financials and raw material sourcing strategy. Whether you are evaluating a new flour mill project, seeking a bank loan for an atta chakki business or preparing a detailed project report to assess basic foods processing as an investment, the approach should begin with realistic assumptions and an integrated model – not with a desired number.
CA Manish Gugliya FCA | Project Finance, DPR, CMA Data & Financial Modelling Advisory
Frequently Asked Questions
The following questions address practical matters on atta manufacturing financial projections, working capital and DSCR that are not fully covered in the main sections. Answers are general guidance – plant-specific DPR and CMA data should always be prepared on customised assumptions.
How many years of financial projections should I prepare for a new atta plant?
Most banks and government schemes expect at least 5-year atta manufacturing financial projections. Where the term loan has a longer repayment period – say 7 or 10 years – projections covering the full tenure are usually required. For internal planning purposes, extending projections beyond the loan tenure helps evaluate machinery replacement, expansion potential, and long-term return on the promoter’s investment. A flour mill project report prepared for a scheme like PMEGP may have specific formatting requirements.
What is a reasonable starting capacity utilisation assumption for Year 1?
Year-1 utilisation for a new wheat flour atta plant is rarely near full capacity. Many realistic projections and what banks expect suggest starting somewhere in the 40–60% range, depending on whether the promoter has an existing customer base, brand recognition or distribution arrangements. The correct assumption should reflect the specific business model, location and marketing ramp-up rather than copying a standard percentage. A gradual increase over 3–5 years to 75–80% is more defensible than claiming high utilisation from day one.
How do I decide the wheat inventory days to use in my working capital assessment?
Consider local procurement patterns. If wheat is available year-round at relatively stable prices from nearby mandis, 15–20 days of raw material sourcing stock may suffice. If prices fluctuate seasonally, if the plant is far from procurement centres, or if the promoter plans strategic bulk purchases post-harvest as a food crop procurement strategy, 30–60 days may be prudent. The trade-off is between price advantage and finance cost of holding inventory. Discuss storage capacity, interest implications and price-risk strategy with your CA or financial advisor before finalising assumptions. This is an important key parameters decision.
Can by-product (bran) income be safely relied upon for DSCR calculation?
Bran by-product revenue should be included in atta manufacturing project financials since it is a genuine output of the milling process and contributes to the R E (revenue and earnings) of the plant. However, pricing and offtake assumptions must be conservative and based on actual local demand – for example, tissue culture base seeds production or cattle feed manufacturers in the area who provide reliable demand for human consumption alternatives. While bran income improves margin and DSCR, the core viability should not depend on overly optimistic by-product prices.
When should I approach a professional for DPR and CMA Data for my atta plant?
Engage a professional advisor once you have broadly decided plant capacity, location and packaging equipment and machinery options – but before finalising bank applications. This allows the financial projections, working capital assessment and DSCR analysis to be aligned with actual quotations, confirmed costs and proposed funding structure. Approaching a bank without a properly prepared project report often results in delays, repeated documentation requests or rejection. Project Report Bank, under CA Manish Gugliya, specialises in customised DPR, CMA data and atta flour mill financial models designed for bank finance and investor discussions.