Key Takeaways
- Specialty flour plant capacity planning directly determines project investment, machinery selection, working capital needs, and long-term profitability for Indian MSME flour manufacturers.
- Products such as multigrain atta, fortified wheat flour, organic atta, high fiber atta, and customised bakery blends each carry different yield, processing speed, and contribution margin characteristics that must be modelled separately.
- A plant described as “10 TPD” or “20 TPD” must specify whether this refers to raw material input, blending throughput, or finished specialty flour output; this distinction affects every number in the Detailed Project Report.
- Financial projections submitted to banks should use realistic capacity utilisation (typically 50 to 70% in initial years), not theoretical maximums, to produce credible DSCR analysis and CMA Data.
- Project Report Bank, led by CA Manish Gugliya (FCA, DISA, 20+ years of experience), prepares customised DPRs, financial models, and feasibility studies for specialty flour plants across India.
Introduction: Why Capacity Planning Matters in Specialty Flour Manufacturing
The Indian flour industry has moved beyond commodity wheat flour. Since 2020, consumer demand for value-added specialty flours, prepared flour mixes, and functional flour products has risen steadily, driven by health conscious consumers, modern retail expansion, cloud kitchens, and quick-service restaurants. The global prepared flour mixes market size was USD 31.7 billion in 2023, projected to reach USD 35.5 billion by 2025, growing at a CAGR of 6.3% until 2035. India’s prepared flour mixes market is booming due to urbanization and government support, while the USA market expands on convenience demand and Germany’s market is driven by organic product demand.
Within this landscape, specialty flours like multigrain atta, fortified wheat flour, high-fibre atta, organic atta, and customised bakery blends present clear opportunities for small and medium flour plants in the 1 to 20 TPD range. Ethnic baking mix sales grew 21% in 2023 according to Euromonitor, plant-based baked foods grew by 27% over the last two years, and 63% of shoppers searched for convenience-driven baking products in 2023. The bakery segment alone is expected to reach a value share of 70.1% by 2025. Prepared flour mixes are extensively used in bakeries and foodservice, and investment in functional flour blends is encouraged by government programs.
Key players and major players in the global flour industry, including Archer Daniels Midland, Nisshin Flour Milling, and Ardent Mills, have expanded their product portfolios. Ardent Mills launched new specialty blends targeting baking applications and baked goods. In emerging markets across Asia Pacific and Latin America, rising demand for flour types meeting specific dietary needs is gaining traction. Even British foods categories now include specialty flour variants.
For Indian MSME entrepreneurs and food manufacturers, the core challenge is not whether the market exists; it is whether the chosen plant capacity, product mix, and production plan are aligned with realistic sales potential and available finance. Wrong sizing leads to underutilised assets, high fixed costs, and difficulty servicing term loans. From a Chartered Accountant’s perspective, capacity planning, product mix, production shifts, and capacity utilisation assumptions must be validated against working capital limits and bank loan conditions before machinery is ordered.
Project Report Bank specialises in customised Detailed Project Reports, financial modelling, and feasibility studies for specialty flour plants across India.
Understanding Specialty Flour Plant Production Capacity
Specialty flour plant capacity planning requires clarity on several distinct capacity measures. Confusing these can distort every financial calculation in a DPR.
Installed capacity is the maximum throughput the plant is designed for, measured in TPH (tonnes per hour) or TPD (tonnes per day). Rated machinery capacity refers to the throughput specified by the equipment manufacturer under ideal conditions without downtime. Theoretical capacity is the maximum output under ideal conditions without downtime. Effective capacity considers real-world constraints such as maintenance, changeovers, cleaning, and power disruptions; in specialty flour operations, this is often 50 to 70% of installed capacity in early years. Saleable finished-product capacity accounts for process losses from cleaning, sieving, bran separation, and rejects. Capacity utilisation is actual production divided by installed capacity, expressed as a percentage.
Each production line or section should have a finite-capacity production plan. The relevant formulas are:
- Daily Production Capacity = Hourly Production Capacity × Effective Operating Hours
- Annual Installed Capacity = Daily Capacity × Operating Days (commonly 250 to 300)
- Capacity Utilisation (%) = Actual Production ÷ Installed Capacity × 100
Capacity is separately influenced by flour milling capacity (if in-house wheat grinding is included), ingredient grinding capacity (for pulses, millets, bran), blending capacity (for multigrain and functional flour mixes using milling techniques such as roller milling and hammer milling), and packaging capacity, which for smaller pack sizes is often the binding constraint on milling capacity.
Illustrative example: A 1 TPH blending line operating 16 effective hours per day over 300 operating days produces a theoretical annual capacity of 4,800 tonnes. At 60% utilisation, actual production is 2,880 tonnes; at 70%, it is 3,360 tonnes; at 80%, it reaches 3,840 tonnes. Effective capacity planning is crucial for high asset utilisation in specialty flour operations.
When a supplier quotes a “10 TPD specialty flour plant,” the entrepreneur must confirm whether this refers to raw material input, total blending throughput, or finished specialty flour output. This distinction directly affects DPR assumptions, project cost estimation, and working capital calculations.
Selecting the Right Specialty Flour Plant Capacity in India
Common capacity bands observed in Indian MSME flour processing range from micro-scale pilot units to large industrial facilities. These are indicative planning scenarios, not official categories.
| Plant Capacity (TPD) | Annual Capacity (300 days) | Operational Structure | Product Diversification | Distribution Scope | Indicative Project Cost |
|---|---|---|---|---|---|
| 1–2 TPD | 300–600 tonnes | Single shift, minimal staff | 1–3 SKUs | Local health stores, test marketing | ₹15–25 lakh (blending-only) |
| 5 TPD | 1,500 tonnes | Semi-automatic, small team | 3–6 SKUs | City/district retail and wholesale | ₹35–80 lakh |
| 10 TPD | 3,000 tonnes | Full shift, QC lab, integrated | 5–10 SKUs | Regional, B2B bakery supply | ₹115–245 lakh |
| 20 TPD | 6,000 tonnes | Two-shift, higher automation | 8–15 SKUs | State-level, private labels | ₹150–300 lakh |
| 50+ TPD | 15,000+ tonnes | Continuous, roller mills | 10+ SKUs | National, industrial clients | Several crores |
Capacity choice must depend on realistic local and regional demand for specialty flours, existing competition from packaged wheat flour brands and local chakki operators, distribution tie-ups, availability of raw materials (wheat, millets, pulses, organic-certified grain), and the promoter’s equity and access to term loan and working capital limits.
Before finalising capacity, entrepreneurs should get scenario-based financial projections prepared (comparing, for example, a 5 TPD vs. 10 TPD plant) to compare project cost, break-even capacity, DSCR, and projected ROI.
Specialty Flour Product Mix Planning
Product mix refers to the percentage allocation of total specialty flour plant output across different products. Each product line differs in recipe complexity, processing time, packing formats, saleable yield, pricing, and expected sales volume. Specialty flour operations involve frequent changeovers and short production runs, so capacity planning in specialty flour production must balance blending requirements and allergen controls.
Product mix decisions should be driven by confirmed or likely market demand, contribution per kg, segregation requirements (for organic or allergen-free batches), and available machinery. Good product mix planning allows better utilisation of installed capacity, the ability to respond to seasonal demand, and a balance between stable high-volume items and niche higher-margin SKUs. The growing popularity of alternative flours, including coconut flour and flours from the cassava plant, and the increasing demand for gluten free options and gluten free products to accommodate dietary restrictions, have expanded the range of flour types that Indian plants can profitably produce.
Multigrain Atta
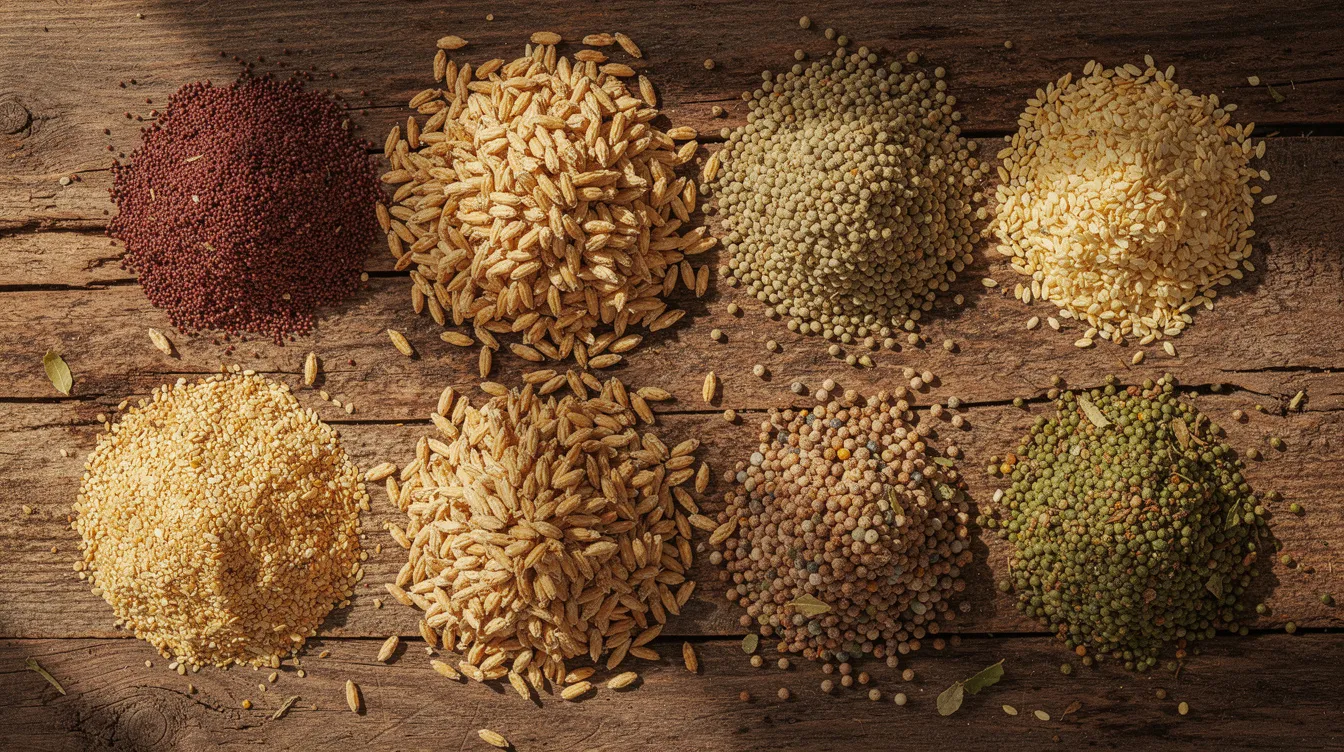
Multigrain atta typically uses whole wheat flour as a base, blended with ancient grains and ingredients such as ragi (finger millet), jowar (sorghum), bajra (pearl millet), oats, soybean, chana dal, flaxseed, and seeds like sesame or pumpkin. Many recipes exist; a common formulation might be 60% wheat, 15% ragi, 10% jowar, 10% bajra, and 5% oats.
Standardised recipes are essential for consistent quality in taste, texture, and nutritional claims. Process steps include separate receipt and cleaning of each grain, pre-grinding of coarse ingredients, blending time in ribbon or paddle mixers, and sieving and final packing. Multigrain atta may have 5 to 10% higher process loss (dust, fines) than plain wheat flour. Market positioning targets health conscious consumers seeking diabetic-friendly and weight management options, often demanding smaller pack sizes and attractive packaging, which can become a capacity bottleneck. For detailed production planning, see our Multigrain Flour Mill Project Report.
Fortified Wheat Flour
Fortified wheat flour in India typically includes added iron (20 mg/kg), folic acid (1,300 µg/kg), and vitamin B12 (10 µg/kg), along with nutrients like vitamin E in some formulations, following FSSAI food fortification programs and standards. The nutritional content must meet current food safety regulations. Fortification cost ranges from approximately ₹0.07 to ₹0.25 per kg depending on scale and premix system.
Precise micro-dosing systems for fortification premixes are required, affecting machinery selection. Controlled mixing times, batch documentation for compliance, and periodic testing of micronutrient content through labs are mandatory. Quality control and lot segregation are crucial in specialty flour milling for fortified flours, and these products often carry the “+F” logo. Fortified wheat flour may target government programmes, institutional buyers, and organised retail chains, demanding consistent bulk supply and reliable capacity utilisation assumptions in the DPR, making them distinct from other fortified flour blends.
High-Fibre Atta
High fiber atta incorporates bran, husk, psyllium husk, oats, or other fibre-rich ingredients into wheat or multigrain bases. Functional flour blends with added fiber are increasingly in demand; 42% of consumers seek food that positively impacts digestive health, and gut health has become a primary purchase driver among health conscious urban buyers.
Processing implications include higher bulk density or lower flowability affecting mixer and packer throughput, increased dust generation requiring stronger aspiration systems, and more fines at sieving that reduce saleable output. Fibre-rich ingredients may absorb more moisture, impacting shelf-life and packaging material selection (laminates, barrier films), which also affects packaging line speed. Yield assumptions must account for these nutritional benefits coming at a processing cost. Plant based diets and growing demand for high protein options have further broadened this segment.
Organic Atta
Organic atta requires certified organic wheat and other grains procured from recognised certification bodies. Documentation must track farm-to-pack traceability. Strict segregation from conventional streams is needed: separate storage bins, dedicated cleaning lines where possible, and thorough cleaning during changeovers. Organic certification audits examine production records, capacity utilisation, and material reconciliation, meaning yield calculations must be clear. The environmental impact consideration of organic farming adds to its market appeal.
Organic specialty flour usually commands a higher selling price, but the entrepreneur must evaluate whether higher raw material cost (often 20 to 50% premium), certification fees, and smaller batch sizes still allow attractive contribution margins.
Customised Specialty Flour Blends
Customised flour blends serve bakeries (bread flour, pizza flour, cake flour, pastry flour, bread improver mixes), institutional clients (hotel chains, QSR brands needing products like baking mixes or protein bars), and private labels and D2C brands wanting unique formulations for bakery products and baked goods with specific baking applications.
These run in smaller, variable batch sizes, increasing changeover time and affecting overall plant capacity utilisation. Flexible blending systems, accurate recipe control, and clear documentation of agreed specifications with each B2B customer are required. While customised blends can offer higher margins, they may require higher working capital in the form of slow-moving SKUs and more complex inventory.
Illustrative Product Mix for a 10 TPD Specialty Flour Plant
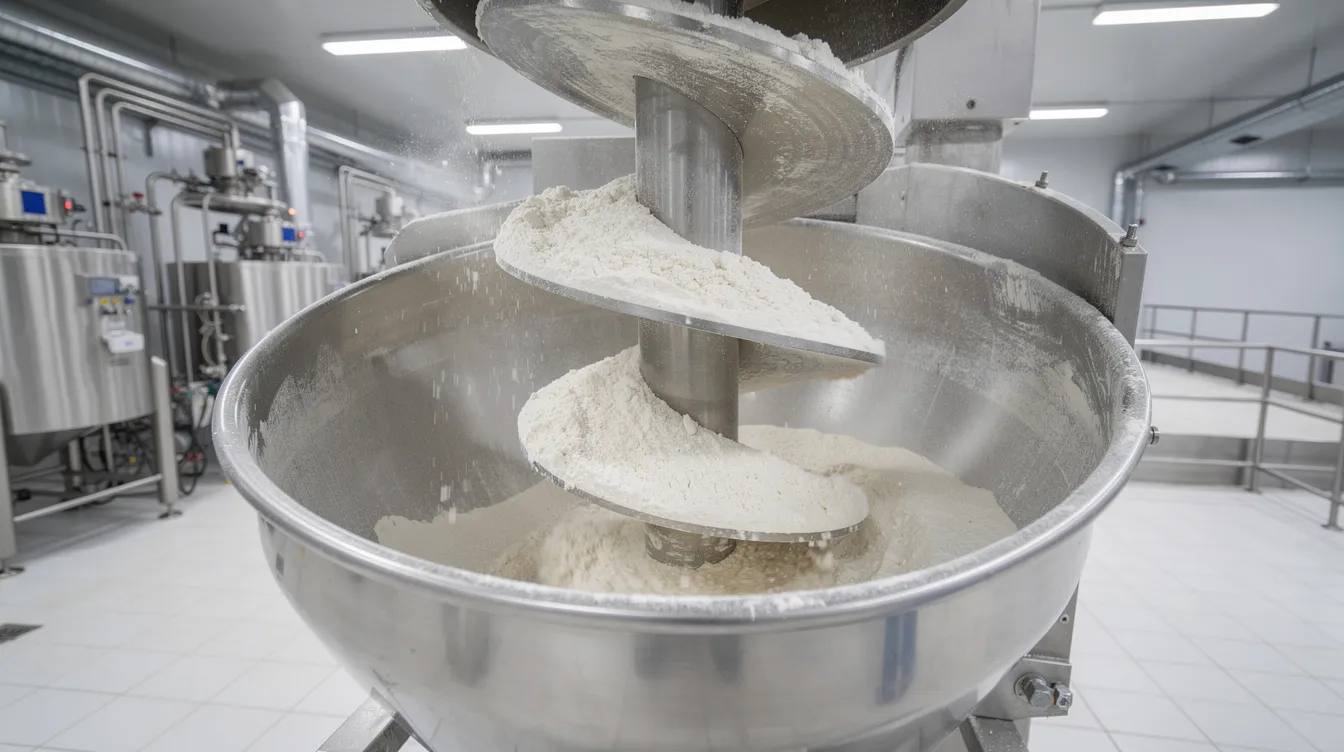
Planning scenario assumptions: installed finished-product capacity of 10 TPD of specialty flours and prepared flour mixes, 300 operating days per year, one production shift with approximately 16 effective operating hours. Annual installed capacity: 10 × 300 = 3,000 tonnes.
| Product | Product Mix (%) |
|---|---|
| Multigrain Atta | 30% |
| Fortified Wheat Flour | 25% |
| High-Fibre Atta | 20% |
| Organic Atta | 15% |
| Customised Flour Blends | 10% |
| Total | 100% |
Product-wise annual production at three capacity utilisation levels:
| Product | Mix % | At 60% (1,800 t) | At 70% (2,100 t) | At 80% (2,400 t) |
|---|---|---|---|---|
| Multigrain Atta | 30% | 540 | 630 | 720 |
| Fortified Wheat Flour | 25% | 450 | 525 | 600 |
| High-Fibre Atta | 20% | 360 | 420 | 480 |
| Organic Atta | 15% | 270 | 315 | 360 |
| Customised Blends | 10% | 180 | 210 | 240 |
| Total | 100% | 1,800 | 2,100 | 2,400 |
These are planning scenarios for DPR and financial projection purposes, not guaranteed sales volumes. Operational feasibility requires evaluating recipe changeovers per week, additional cleaning downtime for organic batches, whether packaging machinery can handle peak demand for multiple SKUs, and sufficient storage for product-wise finished goods. Demand forecasting in specialty production requires understanding volatile specialty trends.
Machinery Capacity and Production Bottlenecks
Total specialty flour plant output is limited by the slowest section. Bottleneck analysis is essential to identify constraints in production systems. Key equipment groups include raw material cleaning (destoners, magnetic separators), wheat flour milling (if integrated), ingredient grinding (pulverisers for millets and pulses), weighing and dosing systems, blending systems (ribbon blenders, paddle mixers), sieving equipment, fortification dosing systems, conveyors, packaging machines, and QC lab instruments.
Bottleneck example: A blending line rated at 1.5 TPH operating 16 effective hours per day produces 24 tonnes/day of blended flour. If the packaging line is rated at only 0.8 TPH, saleable packed output is limited to approximately 12 to 13 tonnes per day. The DPR capacity figure must align with the lower packaging throughput, not the blending capacity. Flexibility in machinery allows quick changeovers to minimize downtime, but micro-stops from cleaning, maintenance, and product changes still reduce Overall Equipment Effectiveness (OEE). OEE is vital for monitoring manufacturing performance and should be tracked as a core KPI.
Government cost norms for automatic wheat flour mill machinery range from approximately ₹17.15 lakh for a 0.5 TPH plant to ₹49.65 lakh for a 1.5 TPH unit and ₹102.70 lakh for 2.0 TPH, as per MoFPI notifications. Entrepreneurs must obtain detailed machinery quotations with clear TPH ratings and cross-check them while preparing capacity calculations. For detailed flour milling process and machinery guidance, refer to our published content.
Production Shift Planning and Capacity Utilisation
Production shift planning increases effective specialty flour plant capacity without additional machinery investment, subject to labour availability and maintenance constraints. Establishing performance KPIs is essential for controlling production capacity and efficiency across shifts.
| Parameter | Single Shift | Two Shifts | Three Shifts |
|---|---|---|---|
| Effective Hours/Day (1 TPH line) | 7 | 14 | 20 |
| Daily Output (tonnes) | 7 | 14 | 20 |
| Annual Output at 300 days (tonnes) | 2,100 | 4,200 | 6,000 |
Higher shift operation reduces per-unit fixed cost but increases labour expense, electricity consumption, and maintenance budgets. Capacity planning should align with actual demand rather than theoretical capacity. A plant technically capable of three-shift output may lack the sales volumes and distribution to absorb that production. Financial projections for bank DPRs should show modest, realistic improvements in capacity utilisation over 3 to 5 years (for example, Year 1 at 50%, Year 2 at 65%, Year 3 at 80%) rather than full three-shift utilisation from day one.
Raw Material Planning and Product-Wise Yield
Each specialty flour SKU has a defined recipe that drives wheat, millets, pulses, bran, premix, and packaging requirements. Main categories include wheat flour or wheat grain (depending on whether flour milling is integrated), other grains (ragi, jowar, bajra, oats, barley, rice), pulses and protein ingredients (chana, soya), bran and fibre supplements, fortification premixes, organic-certified grains, and packaging materials.
Key formulas:
- Raw Material Requirement (kg) = Planned Finished Output (kg) ÷ Saleable Yield (%)
- Monthly Consumption = Annual Requirement ÷ Number of Operating Months
Yield monitoring should include tracking extraction rates and quality losses. The milling process typically shows 3 to 5% loss from husk, dust, and screening. Blending operations have lower losses but must still account for spillage and lab samples.
Illustrative calculation: At 60% utilisation, a 10 TPD plant produces 1,800 tonnes annually. Assuming an average saleable yield of 97%, total raw material input required = 1,800 ÷ 0.97 ≈ 1,856 tonnes, or roughly 155 tonnes per month across 12 operating months. Product-wise mapping (for example, bajra flour or soya flour ingredients) follows from recipe percentages.
Raw material variability affects specialty flour production costs and capacity. Supply chain alignment is critical for maintaining effective production capacity; supplier diversification, minimum order quantities, seasonality in wheat and millet availability, and storage space for 1 to 2 months of critical ingredients must all be planned.
Product Mix Optimisation for Higher Profitability
A specialty flour with a higher MRP does not automatically deliver higher profitability. What matters is contribution margin per kg multiplied by realistic volume.
Contribution per Kg = Net Selling Price per Kg − Variable Cost per Kg
| Product | Selling Price (₹/kg) | Variable Cost (₹/kg) | Contribution (₹/kg) | Monthly Volume (tonnes) | Monthly Contribution (₹ lakh) |
|---|---|---|---|---|---|
| Multigrain Atta | 38 | 28 | 10 | 53 | 5.3 |
| Fortified Wheat Flour | 30 | 23 | 7 | 44 | 3.1 |
| High-Fibre Atta | 42 | 32 | 10 | 35 | 3.5 |
| Organic Atta | 55 | 43 | 12 | 26 | 3.1 |
| Customised Blends | 48 | 35 | 13 | 18 | 2.3 |
Illustrative figures at 70% utilisation; not verified benchmarks.
Contribution margin is used for break-even and product selection. EBITDA subtracts fixed factory overheads, net profit accounts for interest and depreciation, and cash flow includes term-loan repayment. A balanced approach maintains stable high-volume items like fortified wheat flour for consistent capacity utilisation and adds selective niche products like organic atta or functional flour to enhance margins. Private labels and expanding the product portfolio require demand forecasting before production allocation.
How Capacity Utilisation Affects Financial Projections
In a bankable specialty flour plant project report, capacity utilisation assumptions are among the most scrutinised elements. Lower utilisation directly increases per-unit fixed cost, compresses EBITDA, and weakens DSCR.
Illustrative scenario for a 10 TPD plant (installed annual capacity 3,000 tonnes, average selling price ₹37/kg, average variable cost ₹28/kg, annual fixed costs ₹55 lakh, interest + depreciation ₹25 lakh):
| Parameter | 50% | 60% | 70% | 80% |
|---|---|---|---|---|
| Production (tonnes) | 1,500 | 1,800 | 2,100 | 2,400 |
| Revenue (₹ lakh) | 555 | 666 | 777 | 888 |
| Variable Costs (₹ lakh) | 420 | 504 | 588 | 672 |
| Contribution (₹ lakh) | 135 | 162 | 189 | 216 |
| Fixed Costs (₹ lakh) | 55 | 55 | 55 | 55 |
| EBITDA (₹ lakh) | 80 | 107 | 134 | 161 |
| Interest + Depreciation (₹ lakh) | 25 | 25 | 25 | 25 |
| Profit Before Tax (₹ lakh) | 55 | 82 | 109 | 136 |
| DSCR Indication | Tight | Adequate | Comfortable | Strong |
Capacity ramp-up is typically gradual: Year 1 at 40 to 50%, Year 2 at 55 to 65%, Year 3 at 65 to 75% or higher. Over-optimistic assumptions like 90 to 100% utilisation from the first year reduce credibility and will be challenged by bankers. For detailed ROI, IRR, and sensitivity analysis frameworks, see our published guides.
Working Capital Planning Based on Product Mix
Specialty flour manufacturing capacity and product mix decisions directly influence working capital for raw material stock, work-in-process, finished goods of multiple SKUs, and trade receivables. Organic raw materials, imported ingredients, and niche functional flour components often require higher inventory days and advance payments. Safety stock optimization balances carrying costs against stockout risks across these varied inputs.
Typical credit patterns in the flour industry: wheat and major grains on 7 to 30 days credit; packaging and premix suppliers on shorter terms; distributors and modern retail chains taking 30 to 60 days or more. Increased product variety (multigrain atta, fortified wheat flour, organic atta, customised blends) leads to more SKUs, partial pallets, and slow-moving items requiring careful stock management to avoid expiry.
Working capital assessment and CMA Data preparation should be aligned with capacity planning and sales projections before submission to banks.
Capacity Planning for Bank Loan DPR and Project Finance
Bankers reviewing a specialty flour plant project report examine clarity on installed and effective capacity (TPD and annual), consistency between machinery quotations and claimed throughput, and a realistic capacity utilisation trajectory. CMA Data is essential for bank loan applications, and loan structuring is crucial for project finance in specialty flour projects.
Key DPR components lenders expect include clear description of specialty flour products and product mix, section-wise machinery capacities, raw material procurement strategy, and justification of sales volumes based on market analysis rather than just national market size figures. Detailed Project Reports assess project feasibility and viability. Financial modeling is crucial for preparing Detailed Project Reports, and DPRs include project cost assessments and working capital evaluations. Investor-ready documentation is part of Detailed Project Reports, and DPRs help in planning new manufacturing or processing projects.
Inflated capacity and aggressive product-mix projections (such as allocating 40% to organic atta without confirmed sourcing) damage credibility. Project Report Bank prepares customised, bankable specialty flour plant DPRs with realistic capacity, financial projections, and risk analysis under the guidance of CA Manish Gugliya.
Conclusion: Practical Next Steps for Specialty Flour Entrepreneurs
Specialty flour plant capacity planning, product mix decisions, and realistic capacity utilisation assumptions together determine total project investment, operating cost structure, working capital needs, and long-term loan repayment ability. Entrepreneurs should start with a clear view of target markets, choose plant capacity aligned to realistic demand, design a product mix that balances volume and margins, and validate machinery capacities to identify potential bottlenecks early.
Before final investment, promoters should obtain a customised specialty flour plant project report, financial model, and feasibility study to test different capacity and product-mix scenarios. Explore detailed resources and professional services on ProjectReportBank.com for flour production, prepared flour mixes, and food processing project planning in India.
FAQ: Capacity Planning & DPR for Specialty Flour Plants
These questions address practical concerns commonly raised by Indian entrepreneurs planning multigrain atta, fortified flour, and specialty flour blending plants.
What is a reasonable starting capacity for a new specialty flour plant in India?
Many first-time entrepreneurs start with 5 to 10 TPD finished specialty flour capacity, as this allows commercial volumes while keeping project cost between ₹35 lakh and ₹245 lakh depending on integration and automation. Micro-scale 1 to 2 TPD plants may suit test marketing but often struggle to cover fixed costs unless integrated with another business. Final capacity should be based on local demand assessment, available finance, and the ability to build distribution within 2 to 3 years.
Do I need in-house wheat flour milling or can I use bought-out wheat flour?
Both models exist. Some plants purchase high-quality wheat flour and focus on blending, fortification, and packaging; others integrate a small flour mill to control quality and reduce raw material cost per kg. In-house milling requires higher capital expenditure and larger space. Using bought-out wheat flour reduces project cost and complexity but depends on reliable suppliers. For most MSME specialty flour startups, starting with bought-out flour and adding milling later is often more practical; a wheat flour mill project report can help evaluate both options.
How can I estimate the break-even capacity for my specialty flour plant?
Break-even quantity in tonnes = Annual Fixed Costs ÷ Contribution per Kg. For example, if annual fixed costs are ₹55 lakh and average contribution is ₹9 per kg, break-even volume = ₹55,00,000 ÷ ₹9 ≈ 611 tonnes, or roughly 20% utilisation of a 3,000-tonne annual capacity. This formula should be validated within a full financial projection model with product-wise assumptions.
What quality certifications are important for specialty flour plants?
Typical requirements include FSSAI licence and adherence to Indian food safety standards, fortification guidelines compliance for fortified wheat flour, organic certification from recognised agencies for organic atta, and HACCP or ISO-based systems for plants targeting modern retail or exports. Certification does not change plant capacity in tonnes but influences plant layout, documentation, and cleaning protocols, which indirectly affect effective capacity and operating cost.
How can Project Report Bank support my specialty flour plant project?
Project Report Bank, led by CA Manish Gugliya, prepares customised specialty flour plant project reports, financial models, CMA Data, and bank loan proposals. The team helps promoters test multiple scenarios (5 TPD vs. 10 TPD, with or without in-house milling, different product mixes) and assess impact on project cost, DSCR, break-even, and returns. Interested readers can share basic project details through the ProjectReportBank.com website to receive professional guidance tailored to their location, budget, and business plan.