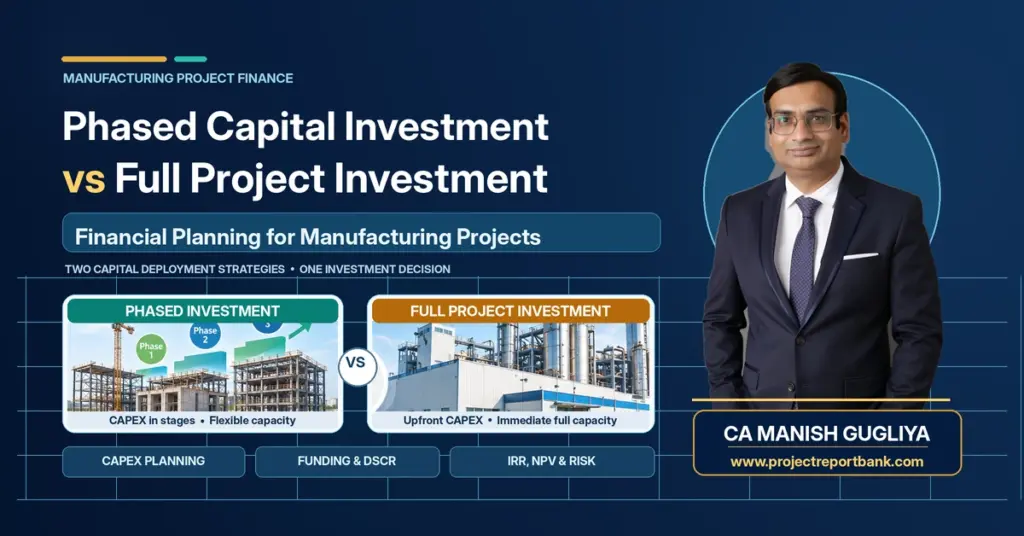
The decision to implement a manufacturing plant in one go or build it in stages directly affects how much capital you commit upfront, when revenue begins, how debt is serviced, and whether the project ultimately delivers acceptable returns. For Indian manufacturing promoters investing between ₹5 crore and ₹100 crore, this is not an abstract strategic question – it determines the structure of your term loan proposal, your equity funding requirement, your DSCR trajectory and, ultimately, whether the project is financially viable or strained from inception.
This article provides a structured, financially grounded comparison of phased capital investment versus full project investment, with practical illustrations, bank appraisal considerations, and risk analysis relevant to Indian manufacturing projects.
The short answer: Full project investment generally delivers better long-term unit economics, stronger project IRR and faster payback when demand is reasonably assured and the promoter can arrange the required equity and debt upfront. Phased capital investment is more appropriate when market demand is uncertain, promoter capital is constrained, or the production technology is modular enough to support efficient stage-wise commissioning. Neither model is universally superior – the right choice depends on your specific cash flow projections, financing capacity, and market confidence, which is precisely why a comparative financial model within a professionally prepared DPR is essential before committing to either approach.
What is phased capital investment in manufacturing projects?
Phased capital investment means implementing a manufacturing project’s plant and machinery, utilities and supporting infrastructure in two or more defined stages rather than commissioning the entire planned capacity at once. Each phase is designed to be independently operational, generating revenue while subsequent phases are planned, funded and executed.
Consider a proposed ₹40 crore food processing plant. Under phased capital investment, the promoter might implement Phase I at ₹22 crore during FY 2026–27, covering a single production line plus common infrastructure (land, building, utilities, effluent treatment) sized partly for future expansion. Phase II – adding a second line and augmenting utilities – might follow in FY 2028–29 at an estimated ₹18–20 crore (before cost escalation adjustments). The plant starts generating revenue from Phase I while Phase II is still on the drawing board.
Key elements of phased CAPEX include:
- Phase-wise installed capacity – initial capacity is a fraction (often 40–60%) of the ultimate design capacity.
- Common infrastructure decisions – land, building shells, utilities and environmental compliance systems may be sized for full capacity upfront, or incrementally expanded. This choice significantly affects Phase I costs and later duplication risk.
- Staggered machinery procurement – equipment for later phases is ordered separately, exposing the promoter to purchase price changes due to inflation, exchange rate shifts or supply chain disruptions.
It is important to distinguish physical project phasing from the separate question of how equity funding is raised. A promoter may implement the full project in one stage but still draw equity in tranches – this is a funding strategy decision, not a CAPEX phasing decision.
Typical reasons promoters opt for phased CAPEX include demand uncertainty in new or untested markets, limited immediate equity, evolving technology, and a preference to prove the concept before committing to large projects.
What is full project investment (single-stage CAPEX)?
Full project investment means implementing the entire planned manufacturing capacity and infrastructure through one integrated project execution programme. The promoter commits total project capital upfront – all machinery, civil works, utilities and new equipment are procured, installed and commissioned before commercial operations begin.
Using the same ₹40 crore food processing plant example: under full project investment, the entire CAPEX is deployed between April 2026 and September 2027, with commercial production starting at 100% installed capacity from October 2027. There is a single construction period, one commissioning cycle and one ramp-up phase.
Financial and operational features of this approach include:
- Higher upfront capital expenditure and a longer pre-revenue construction period during which interest during construction (IDC) and pre-operative expenses accumulate without any offsetting revenue.
- Stronger economies of scale – full project investment offers economies of scale by allowing bulk procurement of new equipment, negotiating consolidated contracts with external contractors, and achieving designed operational efficiency from Day 1.
- Single learning curve – one commissioning, one workforce training cycle, one set of trial runs. This avoids the repeated mobilisation and demobilisation costs inherent in multi-phase execution.
Full investment typically results in faster project completion and operational readiness, but requires higher initial equity, larger term loan sanctions and more robust DSCR comfort from bankers. Capital expenditure planning for the entire plant must be thorough, as there is limited scope to adjust the capital plan once construction contracts are signed.
Phased capital investment vs full project investment: how they compare at a glance
The table below provides a high-level comparison across the factors that most directly influence investment decisions for Indian manufacturing promoters. Specific numbers will vary by industry, scale and location.
| Factor | Phased Capital Investment (Phase-wise CAPEX) | Full Project Investment (Single-Stage CAPEX) |
|---|---|---|
| Best suited for | Uncertain demand, limited capital, modular technology | Confirmed demand, scale economies, integrated processes |
| Initial CAPEX outlay | 40–60% of ultimate project cost | 100% of planned project cost |
| Time to first commercial operation | Shorter (12–18 months for Phase I) | Longer (18–30 months for full plant) |
| Time to reach ultimate design capacity | 4–6 years (across two phases) | 2–3 years (single ramp-up) |
| Interest during construction (initial) | Lower for Phase I; cumulative IDC can be higher | Higher single IDC block, but one-time |
| Working capital intensity at start-up | Lower initially; scales up with later phases | Higher from Day 1 of operations |
| Bank term loan at initial sanction | Smaller (Phase I debt only) | Larger (full project debt) |
| Typical DSCR profile (Years 2–5) | Comfortable early; may dip when Phase II debt is added | Tighter initially; improves as utilisation grows |
| Flexibility to change product mix or technology | Higher – can adapt later phases | Lower – full project investment locks a company into a rigid project design from its inception |
| Exposure to future cost escalation | Significant – later phases face inflation and exchange risk | Limited – contracts and prices locked at outset |
The core trade-off: phased investment reduces initial strain on equity and debt but can increase total lifetime cost and execution risk. Full investment demands more upfront but typically delivers better long-term unit economics and project IRR when demand materialises as projected.
Decisive factor 1: timing of cash flows and interest during construction
The single biggest financial difference between these two approaches is the timing of capital outlay relative to revenue generation, and how this affects cash flow, IDC and early-year returns.
Under full project investment, the entire CAPEX – say ₹20 crore – is deployed over 18–24 months before any commercial revenue begins. During this period, interest on the term loan component (often 65–75% of CAPEX) accrues and is capitalised as pre-operative expenses and IDC. For a ₹13 crore term loan at approximately 10% interest over an 18-month construction period, IDC alone can amount to ₹1.5–1.9 crore, adding directly to the capitalised project cost.
Under phased investment, Phase I might involve ₹12 crore deployed over 12 months. IDC on the Phase I term loan (say ₹8 crore at 10%) accumulates for a shorter period – roughly ₹0.7–0.8 crore. Revenue starts earlier, and Phase I cash flows may partially offset interest costs during Phase II construction. However, if Phase II is delayed or its financing takes longer than planned, cumulative IDC across both phases can exceed the single-stage IDC figure.
Phased investment enables cash flow preservation, retaining liquidity for operations during the critical early period. Phased capital investment supports incremental revenue generation as phases become operational – a material advantage for promoters with capacity constraints on equity.
Winner: Phased capital investment – on initial IDC and early cash flow relief. However, the advantage erodes if Phase II implementation is delayed, or if cumulative IDC across phases exceeds the single-stage alternative. The full investment model wins on total IDC certainty.
Decisive factor 2: equity funding, dilution and capital deployment
For promoters raising equity – whether from personal funds, family capital or external investors – the investment strategy has direct implications on how much capital must be arranged and when.
Under phased investment, the initial equity requirement is lower. For a ₹12 crore Phase I with 65:35 debt-equity, the promoter needs approximately ₹4.2 crore upfront rather than ₹7 crore for the full ₹20 crore project. This preserves cash for working capital and provides a financial cushion. If Phase I performs well, retained earnings may partially fund Phase II equity, reducing external funding needs.
The risk: if Phase I underperforms, the promoter may need to raise Phase II equity at a weaker valuation, resulting in greater dilution of shareholding and ownership than originally anticipated. External investors may demand more favourable terms for later-stage funding if early financial performance is below projections.
Under full project investment, the promoter commits higher equity upfront – a deeper initial outlay – but negotiates capital structure, valuation and investor terms once, with full clarity on the capital plan. There is no uncertainty about future equity rounds or additional dilution.
The equity funding drawdown schedule should be carefully aligned with project milestones under either model, ensuring that promoter funds are not deployed idle while awaiting construction progress.
Winner: Phased capital investment – on initial equity outlay and capital preservation. Full project investment wins on long-term simplicity, single-round negotiation with investors, and certainty of promoter shareholding. The right choice depends on the promoter’s liquidity position and risk appetite for future funding rounds.
Decisive factor 3: DSCR, bankability and loan structuring
The Debt Service Coverage Ratio (DSCR) – the ratio of net operating cash flow to annual debt service (principal + interest) – is the primary metric Indian banks use to assess whether a manufacturing project can comfortably repay its term loan. Most banks require an average DSCR of 1.25× to 1.35× for manufacturing term loans, with no individual year falling below approximately 1.15×. Conservative public sector banks may expect average DSCR of 1.50× or higher for new projects.
Under phased capital investment, the initial term loan is smaller, and early-year debt service obligations are lower. This often produces comfortable DSCR in Years 2–4, giving bankers confidence in Phase I viability. However, when Phase II borrowing is added, the combined debt service rises sharply. If Phase I revenue growth has not kept pace, DSCR can dip below bank covenant thresholds – triggering reclassification risk or demands for additional security.
Banks may sanction Phase I and Phase II as separate loans, each requiring independent appraisal, fresh security and updated CMA data. The risk is real: funding for Phase II is not guaranteed simply because Phase I was sanctioned. Market conditions, updated bank norms (including the RBI’s 2025 project finance directions), and Phase I project performance all influence whether the second tranche materialises.
Under full project investment, the larger loan demands stronger initial DSCR projections and more robust collateral. However, once operations commence at full capacity, the DSCR profile tends to strengthen more quickly – fixed costs are spread over higher output, and there is no second debt tranche to absorb.
Winner: Full project investment – for established promoters with strong balance sheet support, confirmed demand and the ability to demonstrate robust DSCR from Year 2 onwards. Phased investment is often more practical for smaller MSME promoters who cannot arrange the full debt quantum initially, but it introduces re-financing risk for later phases.
Decisive factor 4: economies of scale, unit costs and long-term profitability
Operational efficiency and unit production cost are where the financial performance differences between the two models become most visible over the project lifecycle.
Full project investment enables the plant to operate at its designed throughput from commissioning. Fixed overheads – supervision, maintenance, utilities, depreciation of common infrastructure – are spread across higher production volumes, driving down per-unit costs and improving EBITDA margins. Bulk procurement of raw materials and consolidated vendor contracts further reduce input costs. Capital planning enhances productivity and profitability through long-term investments of this nature.
Consider a simple illustration: if fixed overheads are ₹2 crore per annum and the plant produces 10,000 units at full capacity, the fixed cost per unit is ₹2,000. At 50% capacity (typical of a Phase I operation running below ultimate design), the same fixed cost per unit rises to ₹4,000 – doubling the overhead burden and compressing margins.
Under phased investment, initial phases may operate at higher per-unit costs because common infrastructure (often sized for eventual full capacity) is underutilised. Revenue growth from Phase I operations must be sufficient to sustain the business while the promoter plans and funds Phase II.
When demand ultimately grows to full capacity, the full investment model typically delivers superior NPV and project IRR. However, if demand remains subdued for extended periods, the full investment model suffers from heavy fixed costs dragging financial performance – a risk that phased investment avoids by limiting initial exposure.
Winner: Full project investment – on long-term unit economics, assuming demand materialises within 2–3 years of commissioning. Phased investment wins only when demand uncertainty is genuine and operating at partial capacity is a deliberate, planned strategy to manage risk.
Decisive factor 5: flexibility, execution risk and cost escalation
Manufacturing projects span 5–10 year investment horizons. Flexibility and risk management matter enormously over these timescales.
Phased capital investment provides a “real option” to halt or pivot the project if needed. If Phase I reveals that the product mix needs adjustment, that technology has evolved, or that regulatory requirements have changed, the promoter can redesign Phase II accordingly. Phased investment allows greater adaptability based on early project performance feedback. This flexibility is particularly valuable in industries where technology or market conditions shift rapidly.
However, phased execution introduces its own risks. Repeated mobilisation and demobilisation of external contractors increases pre-operative costs. Construction input cost escalation – recent data shows aluminium, copper and fabricated metalwork rising 10–44% year-on-year, with labour hours costs climbing 5–25% annually – means Phase II machinery and civil works may cost substantially more than originally estimated. Complex project logistics can complicate phased investment due to active multi-cycle management across the project lifecycle.
Full project investment offers one-time mobilisation, locked-in contracts and prices, and a single learning curve for engineering and project management teams. Execution speed can be optimised with full project investment by minimising delays. The trade-off: less flexibility to change plant configuration later without large write-offs or significant investment in modifications.
Cost overruns and contingency planning must be addressed rigorously in both models, but the escalation exposure is structurally higher in phased execution.
Winner: Phased capital investment – on flexibility and adaptability. Full project investment wins on cost certainty, execution efficiency and avoiding escalation risk. The balance depends on how confident the promoter is in the original project design and market assumptions.
Manufacturing project illustration: ₹20 crore investment – phased vs full CAPEX
This illustrative example compares both investment structures for a mid-sized Indian manufacturing unit (engineering components or packaged food). All numbers are assumptions for analytical purposes, not industry benchmarks.
Common assumptions
- Total base project size: ₹20 crore (excluding working capital); land purchased upfront in both cases
- Evaluation period: 10 years from initial investment
- Debt-equity ratio: 65:35 (term loan ₹13 crore, promoter equity ₹7 crore under full investment)
- Term loan interest rate: ~10% p.a., floating
- Moratorium: 1 year during construction; repayment over 9 years post-moratorium
- Discount rate for NPV: 15%
- Variable cost: ~55% of sales; fixed overheads: ₹1.8 crore p.a. at full scale
- Tax rate: 25%
Scenario A: Full project investment
- Entire ₹20 crore deployed over 18 months (Year 1 to mid-Year 2)
- Commercial operations begin start of Year 2
- Capacity utilisation: Year 2 – 50%, Year 3 – 70%, Year 4 onwards – 85%
- Promoter equity: ₹7 crore; term loan: ₹13 crore
Scenario B: Phased capital investment
- Phase I: ₹12 crore over 12 months; production starts beginning of Year 2 at 60% of ultimate capacity
- Phase II: ₹8 crore base + ~10% cost escalation (₹8.8 crore actual), deployed during Years 3–4; full capacity from Year 5
- Phase I equity: ₹4.2 crore; Phase I term loan: ₹7.8 crore
- Phase II equity: ~₹3.1 crore; Phase II term loan: ₹5.7 crore
- Additional Phase II costs: ₹0.4 crore for contractor remobilisation, temporary utilities and duplicate commissioning
Table 1: Capital expenditure and funding schedule
| Year | Scenario A – CAPEX (₹ Cr) | Scenario A – Equity / Debt | Scenario B – CAPEX (₹ Cr) | Scenario B – Equity / Debt |
|---|---|---|---|---|
| Year 1 | 14.0 | ₹4.9 equity / ₹9.1 debt drawn | 12.0 (Phase I) | ₹4.2 equity / ₹7.8 debt |
| Year 2 | 6.0 | ₹2.1 equity / ₹3.9 debt drawn | – | – |
| Year 3 | – | – | 5.0 (Phase II begins) | ₹1.8 equity / ₹3.2 debt |
| Year 4 | – | – | 4.2 (Phase II completes) | ₹1.3 equity / ₹2.5 debt + ₹0.4 additional |
| Total | 20.0 | ₹7.0 / ₹13.0 | 21.2 (incl. escalation) | ₹7.3 / ₹13.5 + ₹0.4 |
Note: Scenario B total project cost rises to approximately ₹21.2 crore due to ~10% cost escalation on Phase II equipment and civil works, plus ₹0.4 crore in duplicated mobilisation – a difference of ₹1.2 crore over Scenario A. This is consistent with historical data showing construction input escalation of 5–10% per annum for labour, structural steel and imported components.
Table 2: Operating and cash flow snapshot (indicative)
| Metric | Year 2 (A) | Year 2 (B) | Year 4 (A) | Year 4 (B) | Year 6 (A) | Year 6 (B) |
|---|---|---|---|---|---|---|
| Capacity utilisation | 50% | 60% (of Phase I) | 85% | 70% (Phase II ramping) | 85% | 85% |
| Sales (₹ Cr) | 8.0 | 5.5 | 14.5 | 12.0 | 15.0 | 15.5 |
| EBITDA (₹ Cr) | 1.8 | 1.4 | 4.7 | 3.6 | 5.0 | 5.1 |
| Term loan repayment (₹ Cr) | 0 (moratorium) | 0 (moratorium) | 1.44 | 1.1 + 0.5 (Phase II starts) | 1.44 | 1.1 + 0.63 |
| Interest (₹ Cr) | 1.3 | 0.78 | 0.95 | 0.55 + 0.52 | 0.65 | 0.35 + 0.38 |
| Net project cash flow (₹ Cr) | 0.5 | 0.62 | 2.3 | 1.4 | 2.9 | 2.7 |
| DSCR | N/A (moratorium) | N/A (moratorium) | 1.97 | 1.47 | 2.45 | 2.05 |
Interpretation
- IDC: Scenario A accumulates approximately ₹1.7 crore in IDC over 18 months. Scenario B’s Phase I IDC is approximately ₹0.7 crore, but Phase II adds ₹0.5 crore – cumulative IDC is ₹1.2 crore, lower in this case but rising if Phase II is delayed.
- DSCR: Scenario A shows tighter DSCR in Year 2 but improves rapidly. Scenario B maintains better DSCR initially but faces pressure when Phase II debt service begins in Years 4–5.
- Indicative project IRR: Scenario A – approximately 18–20%; Scenario B – approximately 16–18%. The difference arises from earlier full-capacity revenue in Scenario A, partially offset by higher initial IDC.
- Equity IRR: Scenario B may show marginally higher equity IRR in the first 5 years due to lower initial equity deployed, but over the full 10-year horizon, Scenario A’s equity IRR typically catches up or exceeds, assuming demand holds.
Under downside demand scenarios (capacity utilisation capped at 60%), Scenario B limits capital at risk – phased capital investment mitigates financial exposure and allows for project reevaluation before committing Phase II funds. Under strong demand scenarios, Scenario A’s earlier break-even and lower total cost deliver clearly superior returns.
Impact on equity funding requirements in both models
Promoters often assume that phased CAPEX automatically reduces total equity required. This is not always correct.
Under full project investment, the promoter arranges the entire equity component – ₹7 crore in our example – upfront. The capital structure is negotiated once with investors and banks. Total equity is known, dilution is clear, and there are no future surprises.
Under phased investment, the initial promoter cheque is smaller (₹4.2 crore for Phase I). However, the aggregate equity across both phases rises to approximately ₹7.3 crore due to cost escalation. If Phase I cash flows are insufficient to fund Phase II equity from retained earnings, the promoter must raise additional external capital – potentially at a less favourable valuation, increasing dilution.
The timing of equity infusions should be carefully aligned with capital deployment milestones and cash runway requirements to avoid idle funds earning no return while construction progresses. Investor capital deployment and fund utilisation controls become particularly important in phased models, where investors need assurance that Phase I funds are deployed as planned and that governance frameworks are in place for Phase II capital calls.
A professionally prepared DPR should clearly map equity drawdown schedules under both strategies to prevent unexpected dilution later, ensuring that all capital decisions are based on informed decisions rather than assumptions.
Impact on bank loans, IDC and DSCR profile
Indian banks appraise manufacturing projects primarily through the lens of project cost, means of finance, security coverage and DSCR adequacy within CMA data projections.
Under full project investment:
- The term loan is larger (₹13 crore in our example), requiring stronger collateral and higher promoter confidence.
- A longer moratorium (up to 24 months for greenfield units, as permitted by institutions such as KSIDC) may be necessary.
- IDC is higher – approximately ₹1.5–1.9 crore – because the entire debt is drawn before revenue commences.
- DSCR must be projected robustly across the full repayment tenure; banks expect the income statement to demonstrate adequate operating surplus from Year 2 onwards.
Under phased capital investment:
- Phase I term loan is smaller (₹7.8 crore), producing comfortable initial DSCR.
- Phase II financing depends on Phase I project performance, updated bank norms and fresh appraisal. This introduces re-financing risk – the assumption that future bank funding will be available on acceptable terms is not guaranteed.
- Separate loan sanctions may carry different interest rates, tenures and collateral conditions.
| Metric | Full Project Investment | Phased Capital Investment |
|---|---|---|
| Term loan at initial sanction | ₹13.0 crore | ₹7.8 crore (Phase I only) |
| Approximate IDC | ₹1.7 crore | ₹0.7 crore (Phase I) + ₹0.5 crore (Phase II) |
| DSCR range, Years 2–4 | 1.30–1.97× | 1.50–2.10× (Phase I only); drops to 1.30–1.47× when Phase II debt added |
| DSCR range, Years 5–7 | 2.10–2.50× | 1.80–2.20× (combined) |
Finance teams preparing term loan proposals should structure CMA data differently under each approach – presenting consolidated DSCR projections that account for the full project horizon, not just individual phase profitability.
Working capital planning under phased vs full project investment
Working capital – inventory, receivables, and the operating cycle – must be analysed alongside CAPEX decisions, not treated as an afterthought.
Full project investment means higher installed capacity and faster ramp-up, resulting in larger inventory holdings, higher receivables and therefore larger working capital limits from Day 1 of operations. The promoter must fund margin money for working capital alongside term loan equity – a significant cash drain in the first fiscal year of operations.
Phased investment starts with lower working capital demand due to smaller production scale. However, total working capital at ultimate capacity will be similar or slightly higher (due to inflated raw materials costs and higher input prices in later years). A common error in DPR preparation is under-planning Phase II working capital when preparing the Phase I report.
Illustrative operating cycle comparison:
- Phase I operations (60% capacity): Inventory – 30 days, Receivables – 45 days, Payables – 30 days. Net working capital cycle: ~45 days. Funding requirement: ~₹1.2 crore.
- Full-scale operations (85% capacity): Inventory – 30 days, Receivables – 45 days, Payables – 30 days. Net working capital cycle: ~45 days. Funding requirement: ~₹2.8 crore.
- Phase II ramp-up year: Working capital requirement jumps from ₹1.2 crore to ₹2.4 crore within 12 months – the incremental ₹1.2 crore must be funded from internal accruals or additional bank limits.
Effective capital planning reduces financial risk and increases operational efficiency only when working capital projections are integrated into the overall financial model from the outset.
Project IRR, equity IRR, NPV and payback: how returns differ
Understanding how returns differ between the two models requires clarity on four metrics:
- Project IRR – return on total capital invested (debt + equity), measuring the project’s inherent profitability.
- Equity IRR – return only on equity cash flows after debt servicing, reflecting what the promoter actually earns.
- NPV – present value of free cash flows at a chosen discount rate (15% in our illustration).
- Payback period – time taken to recover initial capital outlay from net cash inflows.
Using our ₹20 crore illustration:
| Metric | Full Project Investment | Phased Capital Investment |
|---|---|---|
| Indicative project IRR | 18–20% | 16–18% |
| Indicative equity IRR | 22–25% | 20–24% |
| NPV at 15% discount rate | Higher (earlier full-capacity cash flows) | Moderately lower (delayed full-capacity) |
| Simple payback period | ~4.5 years | ~5.5 years |
Earlier positive cash flows from phased investment can improve equity IRR in the initial years, even if total project IRR is slightly lower. However, lower initial investment does not automatically guarantee higher IRR – if later phases are delayed, over-budget or underutilised, phased capital investment can incur higher overall costs due to financing and project delays, dragging down lifetime returns.
A cash-flow-to-capital-expenditures ratio above 1 indicates financial health, and this ratio should be tracked under both scenarios across the evaluation period. Investment decisions should consider net present value, ROI, and operational requirements – not just simple payback calculations. ROI measures the return on investment relative to its cost, and internal rate of return (IRR) indicates the profitability of potential investments, but both must be computed over a consistent 10-year horizon for meaningful comparison.
Financial risks specific to phased capital investment
Phased investment is not “risk-free.” It introduces several unique financial exposures that promoters frequently underestimate:
- Machinery price escalation and foreign exchange risk: Equipment costs between phases can rise 8–15% or more, particularly for import-heavy or metal-intensive components. Supply chain disruptions and currency volatility compound this risk.
- Repeated mobilisation and demobilisation: Bringing back external contractors, re-engaging technical consultants and re-establishing site infrastructure adds labour hours and project management overhead – often ₹30–50 lakh or more for mid-sized projects.
- Infrastructure duplication: If common infrastructure (utilities, effluent systems, compressed air) was not sized for full capacity during Phase I, augmenting it later involves redesign, construction disruption and additional cost. Proactive risk management can prevent costly setbacks, but only if infrastructure sizing is addressed upfront.
- Uncertainty of future bank finance: Phase II loan sanction depends on Phase I performance, updated bank norms and collateral. 80% of capital projects exceed their budget, and banks may tighten terms if Phase I shows cost overruns.
- Market share erosion: If competitors invest fully and scale faster, the phased promoter may lose customer contracts or market positioning before Phase II is operational. Choosing between the two investment approaches involves balancing risk exposure and project flexibility.
- Operational disruption: Expansion construction inside a running plant can reduce existing capacity utilisation, affect product quality and create safety hazards – all affecting project performance.
Financial risks specific to full project investment
Full project investment also carries material risk if demand and pricing assumptions do not hold:
- Large upfront capital lock-in: Full investment can strain a company’s liquidity due to high initial capital requirements. Once committed, capital spending on fixed assets cannot be easily reversed.
- Prolonged pre-revenue period: A longer construction phase (18–30 months) means no revenue while interest, insurance and fixed overheads accrue. 20% of capital projects take longer than planned, and schedule delays are a top reason capital projects fail – directly increasing IDC.
- Demand risk: If the market does not absorb planned capacity, the plant operates at low utilisation for extended periods, depressing margins and weakening DSCR. Poor schedule management is a top reason for project failure.
- DSCR covenant pressure: If ramp-up is slower than projected, the promoter may breach bank covenants, triggering demands for additional security or accelerated repayment.
- Higher working capital exposure: Full-scale operations from Day 1 require larger inventory of raw materials, higher receivables and greater exposure to credit cycles and input price volatility.
- Project execution risk: If delays push the Commercial Operation Date, IDC and pre-operative expenses can significantly erode project returns, reducing NPV below the hurdle rate.
These potential risks must be reflected in scenario analysis – downside cases on sales volume, selling price and implementation timeline – within the project financial model. Risk management frameworks are crucial during project execution regardless of the chosen model.
When should a manufacturing promoter choose phased capital investment?
Phased investment is usually more appropriate under these specific conditions:
- Demand uncertainty in new or untested markets – e.g., a new FMCG product, a niche engineering component, or entry into an unfamiliar geography. Phased investment is preferable when dealing with uncertain market conditions or demand. The promoter can test the market with Phase I production requirements before scaling.
- Limited immediate equity or promoter capital – when the promoter’s balance sheet cannot support full equity contribution without straining liquidity for operations and working capital.
- Modular or easily scalable production technologies – production lines that can be added without major disruption to existing capacity. Examples include cold storage with modular chambers, solar module assembly expandable in blocks, or packaging lines added to an existing food processing facility.
- Evolving regulatory or policy environment – when compliance requirements, environmental norms or subsidy structures are changing, making it prudent not to commit full CAPEX until clarity emerges. Prioritizing investments based on critical needs is essential in capital planning.
- “Prove the concept” strategy – establishing customer relationships, proving product quality and building supply chain reliability before large-scale expansion. Strong governance improves project success rates significantly when managing multiple projects across phases.
When is full project investment more suitable?
Full investment is appropriate where scale itself is a source of competitive advantage and business growth depends on immediate capacity availability:
- Confirmed long-term offtake agreements or purchase commitments – when key customers have committed volumes that justify full capacity from Day 1. CapEx decisions reflect strategic intent for long-term growth.
- Industries with strong economies of scale and high fixed infrastructure – integrated steel processing, cement grinding, large dairy plants, or large projects where common infrastructure (boilers, effluent treatment, cold chain) cannot be efficiently split across phases.
- Processes where partial implementation is technically inefficient – continuous process industries (e.g., chemical manufacturing, glass production) where splitting the production line across two phases creates engineering complexity without proportionate savings.
- Well-established products with stable demand – commodities or products with proven domestic or export markets where the business strategy centres on cost leadership through scale.
- Favourable financing conditions – when term loan rates are competitive, promoter equity is available, and locking in equipment prices and contractor rates at current levels provides a clear cost advantage. Companies using digital tools see up to 15% savings in CAPEX, further strengthening the case for consolidated procurement.
For example, a cement grinding unit requiring a ₹45 crore investment in a single integrated kiln and grinding system cannot be meaningfully phased – partial implementation would result in an inoperable facility with no revenue until the full system is commissioned.
Role of a Detailed Project Report (DPR) and feasibility study in choosing between models
The DPR is the primary decision tool for comparing phased CAPEX vs full CAPEX in a structured, financially rigorous manner. A standardized evaluation process helps prioritize capital projects effectively, and the DPR provides this structure.
A professionally prepared DPR – such as those developed by Project Report Bank under CA Manish Gugliya – should include the following analytical components for both investment alternatives:
- Technical feasibility and capacity planning: Defining phase-wise vs full installed capacity, machinery configuration, utilities sizing and production requirements under each structure.
- Detailed CAPEX budgeting: Scheduling capital expenditure planning and deployment under each option, with contingency provisions.
- Means of finance planning: Equity, term loan, subsidies, internal accruals – with drawdown schedules and fund utilisation plans mapped to construction milestones.
- Working capital projections: Aligned to ramp-up under each structure, including margin money requirements.
- 10-year financial projections: Profit & loss, balance sheet, cash flow statement and DSCR analysis for both cases, providing visibility into long-term financial performance.
- IRR, NPV, payback period and ratio analysis: Including project IRR vs equity IRR for phased and full investment, computed over identical evaluation periods using consistent assumptions.
- Scenario and sensitivity analysis: Testing key variables – demand, selling price, CAPEX escalation, implementation delay – using historical data and predictive analytics to stress-test both models.
Banks and investors prefer DPRs that transparently compare alternatives rather than presenting only the promoter’s preferred structure. Using historical data and predictive analytics improves capital planning decisions and demonstrates analytical rigour. Capital planning aligns projects with strategic goals and objectives – and the DPR is where this alignment is documented and tested.
Practical decision-making checklist for promoters
Before committing to machinery orders or bank loans, work through this checklist:
- Have you modelled at least two alternatives – phased and full investment – over a 10-year horizon using consistent financial modeling assumptions?
- Is your market demand forecast for full capacity supported by data (orders, contracts, industry reports) – not just optimism?
- Can you clearly arrange the required equity (including promoter contribution of 25–33% of project cost) for full CAPEX without straining liquidity?
- What is your minimum acceptable DSCR for banks, and how does each model perform against it across all repayment years?
- How sensitive are project IRR and NPV to delays and cost escalation under each structure? Have you run scenario analysis on both?
- Have you fully accounted for additional IDC, mobilisation costs, and infrastructure duplication in later phases?
- Is your technology modular enough to support efficient phased commissioning, or does partial implementation create technical inefficiency?
- Have you discussed both options with potential customers, bankers and key investors to gauge their comfort and reduce risk?
- Does your capital plan account for working capital funding needs at each stage – not just the term loan and equity?
- Have you identified who the project owner is for each phase, and are governance tools in place for multi-phase execution and compliance?
Frequently asked questions on phased capital investment vs full project investment
Is phased capital investment always better for manufacturing projects?
No. Phased investment helps when capital is constrained or demand is uncertain, but it is not universally superior. In industries with strong economies of scale, high fixed infrastructure or continuous process requirements, phased implementation can increase total cost, reduce operational efficiency and delay break-even. The decision requires financial modeling specific to the project, not a blanket assumption.
Does phased investment reduce total project cost?
While phased investment reduces initial outlay, total project cost is frequently higher due to machinery price escalation (typically 5–10% per annum for construction inputs), repeated mobilisation of external contractors, and additional pre-operative expenses. Only a comparative DPR and 10-year financial model can quantify whether lifetime cost is lower or higher for a specific project. 80% of capital projects run over budget – this risk applies to both models but is compounded in phased execution.
How does phased investment affect equity funding and promoter dilution?
Staged equity contributions ease the initial burden but may result in additional equity rounds at different valuations, potentially increasing promoter dilution. If Phase I underperforms, the promoter’s negotiating position weakens for Phase II funding. A carefully designed equity drawdown and valuation strategy is essential to protect promoter shareholding.
What happens to DSCR when manufacturing capacity is expanded in phases?
Initial DSCR may appear comfortable in Phase I due to smaller debt. However, additional borrowing for Phase II can reduce DSCR significantly unless operating profits have scaled proportionally. Finance teams should model DSCR for the combined project over the entire repayment horizon – not just phase-wise – to provide visibility to bankers and avoid covenant breaches.
Is full project investment more profitable in the long term?
Full investment can be more profitable when demand is strong and stable, scale economics are significant, and the plant ramps up quickly. Net present value (NPV) assesses the profitability of an investment over its full life, and full investment typically delivers higher NPV when capacity is utilised above 75% within 2–3 years. However, if utilisations remain modest due to weak demand, the heavy fixed cost structure depresses profitability and strains the income statement.
Can banks in India finance manufacturing projects implemented in phases?
Yes – banks regularly finance phased projects, but they require a clear overall project concept, separate DPRs or addendums for each phase, adequate security and promoter contribution for each loan tranche, and demonstrated DSCR comfort. Phase II sanction is not automatic – it depends on Phase I performance, updated bank risk appetite and compliance with current norms. Project Report Bank can structure proposals accordingly, though no advisor can guarantee loan sanctions.
How should project IRR be compared between phased and full investment alternatives?
The same evaluation period, tax assumptions and discount rate must be used for both alternatives. Cash flows must include CAPEX, IDC, working capital changes and residual asset values. Both project IRR and equity IRR should be computed – relying on a single metric can be misleading. A consistent 10-year financial model is the minimum standard for meaningful comparison.
Should a feasibility study always evaluate both phased and full project investment structures?
For projects above ₹5–10 crore, comparing at least two investment structures is strongly advisable. This is a significant investment where the difference between phased and full CAPEX can materially affect project success, bankability and returns. Exceptions exist where technology or regulatory requirements effectively force single-stage implementation – but even then, documenting why phasing was ruled out strengthens the DPR’s credibility with bankers and investors.
Conclusion: choosing the right investment structure for your manufacturing project
The decision between phased capital investment and full project investment is not a matter of one approach being inherently better. It hinges on market certainty, production technology, economies of scale, financing capacity, strategic objectives and the promoter’s risk appetite. Successful capital planning requires evaluating both structures through rigorous financial analysis – not relying on intuition about initial cost savings.
Full project investment typically delivers stronger long-term unit economics, faster payback and higher project IRR when demand is reasonably assured and the promoter can arrange adequate equity and debt. It suits industries where scale drives competitive advantage and where common infrastructure cannot be efficiently split across phases.
Phased capital investment is the more prudent path when demand is unproven, technology is evolving, promoter capital is limited, or the production process is modular enough to support incremental commissioning. It preserves flexibility and limits downside exposure – but at the cost of higher total CAPEX, potential escalation and re-financing risk.
In either case, a rigorous DPR, comprehensive financial model and thorough sensitivity analysis are essential. Relying only on initial cost comparisons without modelling 10-year cash flows, DSCR trajectories and return metrics leads to suboptimal capital decisions.
For customised DPRs, CMA data, financial projections and feasibility studies comparing phased vs full investment for your specific manufacturing project, consult CA Manish Gugliya, FCA, DISA (ICAI), at ProjectReportBank.com. Well-structured, bank-ready and investor-ready documentation is the foundation of informed, financially sound investment decisions.