Key Takeaways
- This article explains how to build realistic soybean oil processing plant financial projections, CMA Data and DSCR analysis for bank finance in India, with focus on medium and large plants (500–5,000 TPD).
- Crushing margins in soybean processing are thin and volatile; realistic assumptions on soybean procurement price, oil and meal recovery, capacity utilisation and seasonal working capital matter more than headline turnover projections.
- Banks evaluate cash flow, DSCR, working capital adequacy and downside scenarios, not just projected profits; a bankable DPR must present internally consistent financial statements across all schedules.
- The article is written from the perspective of a practising Chartered Accountant advising promoters on bankable Detailed Project Reports and loan proposals through Project Report Bank.
- Readers will find a structured framework they can use with their consultant to build a complete financial model, CMA Data and project report for their soybean oil processing plant.
Introduction: From Technically Feasible Plant to Bankable Financial Model
Many soybean solvent extraction and oil processing plant projects in India are technically sound but fail at bank appraisal because the financial projections do not hold up under scrutiny. The machinery quotations may be reasonable, the location may be in a soybean-growing belt, and the process flow may be standard. Yet the proposal gets returned with queries on margins, working capital, DSCR or sensitivity.
Banks today expect integrated financial projections covering project cost, revenues from crude soybean oil, soybean meal and by-products, operating costs, working capital cycle, term loan repayment, DSCR calculations and sensitivity analysis. A summary Excel sheet or a generic PDF project report is not adequate for a ₹30–70 crore industrial investment.
This article provides a structured outline for soybean oil processing plant financial projections relevant to Indian promoters and investors. The focus is on soybean as a major edible oil feedstock, with specific relevance to processing hubs in Madhya Pradesh, Maharashtra, Rajasthan and Gujarat.
Why Financial Projections Are Critical for Soybean Oil Processing Plants
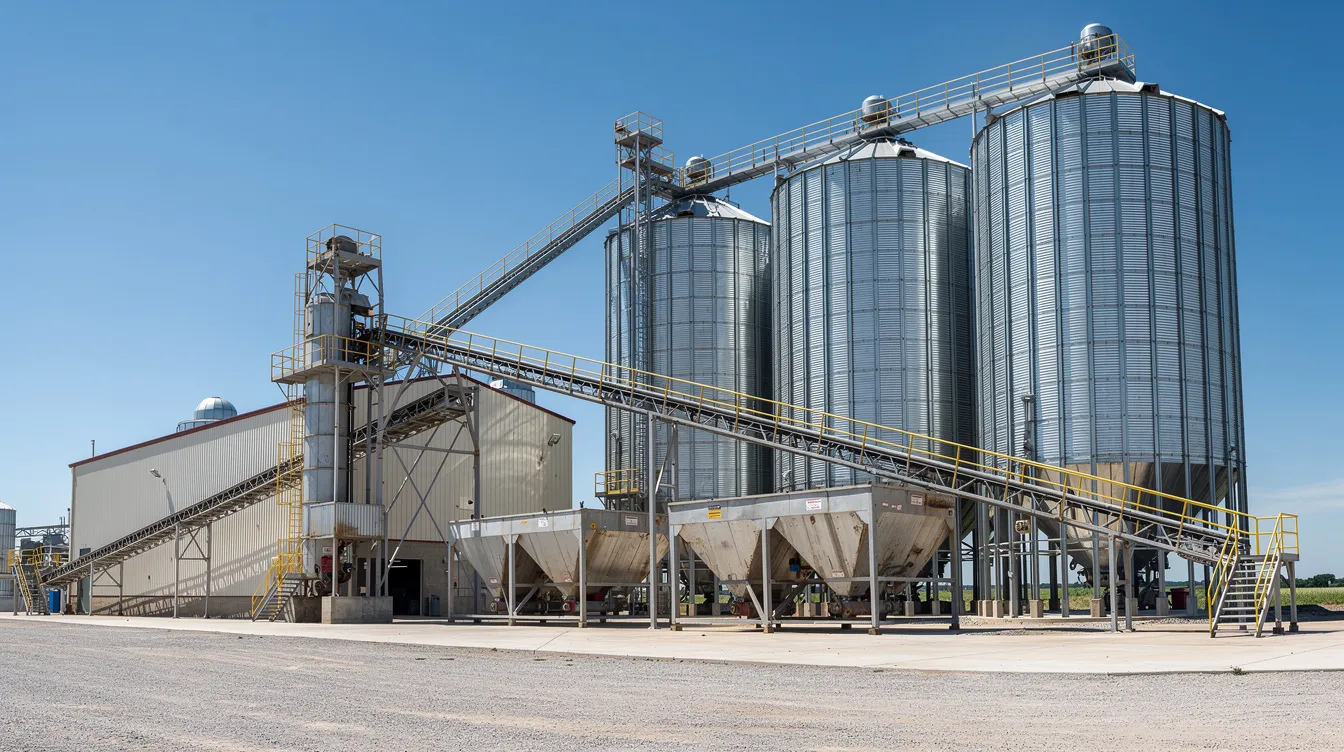
A soybean oil processing plant is both capital-intensive and working-capital-intensive. The total capital investment for a 500 TPD integrated extraction and refinery unit can range from ₹41 to ₹70 crore, including land, civil works, plant and machinery, utilities, storage tanks and pre-operative expenses. Major capital costs include land, construction, and machinery expenses, with land costs typically ranging from 10% to 20% of total investment. Beyond fixed assets, the plant needs continuous funding for soybean procurement, inventory holding and receivables financing.
Commodity price volatility makes this industry particularly challenging. Soybean seed prices in Indore markets have recently ranged around ₹60,000–66,000 per tonne, while crude soybean oil trades near ₹137,000–139,000 per tonne and soymeal around ₹47,500–56,500 per tonne. Small shifts in these prices can turn a positive crush margin negative within weeks. In September 2026, market data showed that a combination of seed price decline and steeper meal price drop pushed net crush margins into negative territory at approximately minus ₹790 per tonne.
The soybean oil industry operates within a large and growing global market. The global soybean oil market was 63.34 million tons in 2025 and is projected to reach 73.73 million tons by 2034, growing at a CAGR of 1.7% from 2026 to 2034. Soybean oil is increasingly used in biodiesel production alongside traditional edible oil and industrial lubricants applications. In India, the food processing sector grew at an average annual rate of 6.55% in 2023-24, and urbanization and population growth continue to drive soybean oil demand.
Variations in plant scale and configuration also change the financial risk profile. An extraction-only plant sells crude oil at lower realisations; an integrated extraction, refining and packaging operation commands higher prices but requires additional capital for refining equipment, filling and packaging machines, and quality control infrastructure. Turnover and nominal profit projections alone are insufficient; banks assess cash flow, DSCR, liquidity and resilience under adverse scenarios before sanctioning loans.
Key Assumptions for Soybean Oil Plant Financial Projections
A financial model is only as good as its assumptions. Every assumption must be internally consistent across production, revenue, costs and funding schedules. The choice of processing technology affects both capital investment and recurring operating costs; soybean oil extraction methods include mechanical pressing and solvent extraction, each yielding different oil recovery rates and capital requirements.
| Financial Assumption | Modelling Basis |
|---|---|
| Installed capacity | TPD (e.g. 500, 1,000, 2,000, 5,000) |
| Annual operating days | 300–330 project-specific |
| Capacity utilisation ramp-up | Year 1: 60%, Year 2: 80%, Year 3+: 85–90% |
| Soybean procurement price | ₹/MT (illustrative: ₹62,000) |
| Crude soybean oil recovery | 17–19% of seed weight |
| Soybean meal (DOC) recovery | 78–80% of seed weight |
| Crude oil selling price | ₹/MT (illustrative: ₹140,000) |
| Soybean meal selling price | ₹/MT (illustrative: ₹55,000) |
| Processing cost per MT seed | ₹5,000–6,500 (power, steam, solvent, labour) |
| Power consumption | 25–40 kWh per MT seed |
| Steam consumption | 250–350 kg per MT seed |
| Working capital cycle | Inventory, receivable and payable days |
| Interest rate on term loan | Illustrative: 12–14% p.a. |
| Term loan tenure | 8–10 years including moratorium |
Soybean oil extraction requires expellers or solvent extraction systems. Solvent extraction recovers about 95% of available oil, reducing residual oil in cake to 0.5–1%, while mechanical pressing recovers roughly 70–80% with residual oil of 4–6%. These technical parameters should align with the soybean processing plant machinery and technology selection for the proposed plant. For a professional DPR, assumptions will be tailored to the client’s location, plant capacity and chosen technology rather than copied from generic industry averages.
Production, Capacity Utilisation and Plant Scale Planning
Production volume is the backbone of all financial projections and must be derived from realistic plant scale and utilisation. Financial projections for a soybean oil processing plant depend on daily processing capacity. A small scale soybean oil plant processes 5 to 20 tons per day, medium scale plants process 50 to 100 tons of soybeans daily, and large scale plants can process over 200 tons of soybeans daily. At industrial scale, a soybean oil processing plant can produce 100,000 to 300,000 MT annually.
Annual soybean processing volume = Installed Capacity (TPD) × Operating Days × Capacity Utilisation (%).
| Plant Capacity (TPD) | Operating Days | Year 1 (60%) | Year 2 (80%) | Year 3+ (85%) |
|---|---|---|---|---|
| 500 | 330 | 99,000 MT | 132,000 MT | 140,250 MT |
| 1,000 | 330 | 198,000 MT | 264,000 MT | 280,500 MT |
| 2,000 | 330 | 396,000 MT | 528,000 MT | 561,000 MT |
| 5,000 | 330 | 990,000 MT | 1,320,000 MT | 1,402,500 MT |
Phased ramp-up is normal. Many Indian oilseed units have historically operated at 30–40% utilisation; modern large plants aim to reach 80–90% over three years. Achieving rapid ramp-up to nominal capacity is essential for a positive Internal Rate of Return. Capacity planning should be aligned with a separate technical study such as soybean crushing plant capacity planning from 500 to 5,000 TPD and the plant’s infrastructure requirements.
Revenue Modelling: Soybean Oil, Meal and By-Products
Revenue in a soybean oil processing project comes from the dual-output model: crude or refined soybean oil and soybean meal (de-oiled cake or DOC), with hulls and minor by-products contributing a small share. The pricing mechanism for each product differs; oil prices are influenced by import parity of vegetable oils such as palm oil, while meal prices respond to domestic and export demand for animal feed.
The mass balance per metric tonne of soybean seed, at typical solvent extraction efficiency:
- Oil recovery: 18% (180 kg)
- Soybean meal (DOC): 78% (780 kg)
- Hulls and process losses: 4% (40 kg)
This connects directly to the concepts discussed in soybean oil and meal recovery, yield and profitability. Production efficiency impacts oil recovery and overall revenue generation in processing. Profitability in soybean processing relies on the crush spread, which is the difference between the value of oil and meal produced and the cost of soybeans. Soybean meal typically accounts for over 70% of total plant revenues by volume contribution, though oil carries higher value per kilogram. Soybean meal is a major protein source in the animal feed industry, and market demand for both soybean oil and meal influences the financial viability of processing projects.
Illustrative Revenue for 1,000 TPD Plant, Year 3 (85% utilisation, 280,500 MT processed):
| Product | Yield (%) | Annual Quantity (MT) | Price (₹/MT) | Revenue (₹ Crore) |
|---|---|---|---|---|
| Crude soybean oil | 18% | 50,490 | 140,000 | 706.86 |
| Soybean meal (DOC) | 78% | 218,790 | 55,000 | 1,203.35 |
| Hulls | 3% | 8,415 | 8,000 | 6.73 |
| Total | 1,916.94 |
The revenue from sale of oil and meal must not double-count any process stream. If a plant chooses to sell oil after refining (which includes degumming, neutralization, bleaching, and deodorization stages), the selling price assumption increases but so do processing costs and additional investment in refining equipment.
Operating Cost, EBITDA and Profit & Loss Projections (5–7 Years)
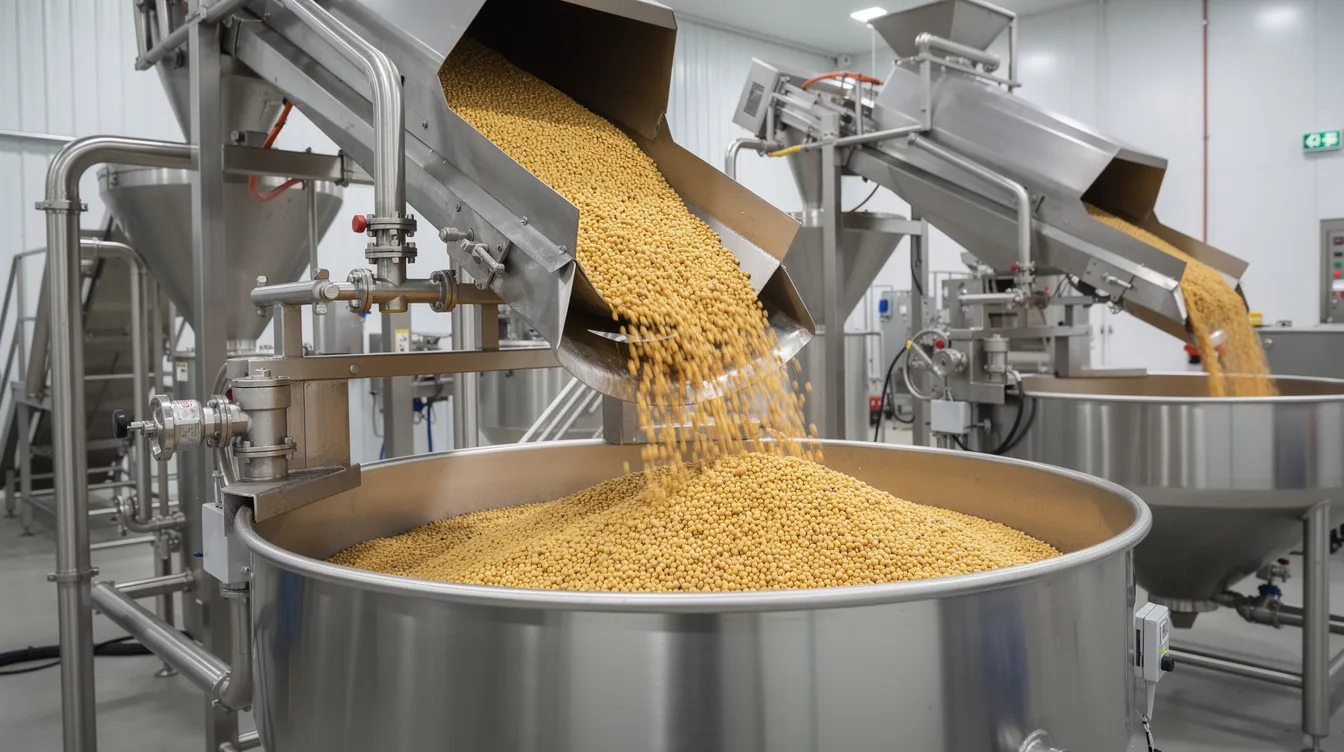
Operating costs for soybean oil processing are primarily driven by raw materials. Soybean raw material costs account for 85–90% of OpEx. The remaining direct and indirect costs include power and electricity, boiler fuel and steam, hexane and solvent consumption (losses typically 1–1.5 litres per tonne of seed), labour and salaries, repairs and maintenance, factory administration, insurance and quality control. Operating costs also include utilities, labor, and maintenance expenses that must be estimated per MT and scaled by annual throughput.
The crushing margin per MT of seed processed, using illustrative prices:
Revenue per MT seed = (0.18 × ₹140,000) + (0.78 × ₹55,000) + (0.03 × ₹8,000) = ₹25,200 + ₹42,900 + ₹240 = ₹68,340
Less: Seed cost (₹62,000) + Processing cost (₹6,000) = ₹68,000
Gross crush margin = ₹340 per MT
Gross profit margins for soybean oil processing range from 10–15% when measured on value-added basis, but the absolute margin per tonne is thin. Minimizing energy consumption and improving processing efficiency can enhance profitability. The first-year operating cost is projected to be substantial due to lower capacity utilisation spreading fixed costs over fewer tonnes.
Illustrative 5-Year Projected P&L (1,000 TPD Plant, ₹ Crore)
| Item | Year 1 | Year 2 | Year 3 | Year 4 | Year 5 |
|---|---|---|---|---|---|
| Revenue | 1,353 | 1,804 | 1,917 | 1,917 | 1,917 |
| Raw Material | 1,228 | 1,637 | 1,739 | 1,739 | 1,739 |
| Processing Cost | 59 | 79 | 84 | 84 | 84 |
| EBITDA | 66 | 88 | 94 | 94 | 94 |
| Depreciation | 8 | 8 | 8 | 8 | 8 |
| Interest | 7 | 6 | 5 | 4 | 3 |
| PBT | 51 | 74 | 81 | 82 | 83 |
| Tax (25%) | 13 | 19 | 20 | 21 | 21 |
| PAT | 38 | 55 | 61 | 61 | 62 |
All figures illustrative and rounded. Depreciation based on assumed ₹55 crore fixed assets on WDV basis.
Projected Balance Sheet, Cash Flow and Working Capital Cycle
A credible financial model links the P&L with a projected Balance Sheet and Cash Flow statement for at least 5–7 years. The Balance Sheet must reflect fixed assets (land, building, soybean oil processing plant and machinery, utilities), term loans with reducing balances, equity including retained earnings, current assets (inventory of raw soybeans, work-in-progress, crude oil and soybean meal, receivables, cash) and current liabilities (trade creditors, short-term borrowings).
The working capital cycle in this industry is driven by inventory days for raw soybean (often 30–90 days depending on season), finished goods (oil and meal, 15–30 days), receivable days for oil and meal buyers (30–60 days), and credit period from suppliers (15–30 days). Working capital requirements are driven by inventory, receivables, and operational cash needs. Working capital should cover at least two to three months of raw material costs.
Illustrative Working Capital Gap (Year 3, 1,000 TPD Plant)
| Component | Days | Value (₹ Crore) |
|---|---|---|
| Raw soybean inventory | 45 | 214 |
| Finished goods (oil + meal) | 20 | 105 |
| Receivables | 30 | 158 |
| Less: Trade creditors | 15 | (71) |
| Working Capital Gap | 406 |
The actual funded portion depends on bank drawing power norms and promoter margin (typically 25% on stocks and book debts). Seasonal peak requirements can be 40–60% higher than average, as discussed in soybean procurement, seasonal inventory and working capital management.
CMA Data Preparation for Soybean Processing Plant Bank Finance
CMA Data (Credit Monitoring Arrangement Data) is the structured set of financial statements and projections that Indian banks require for term loan and working capital limit assessment. The major CMA schedules include existing and projected operating statements, projected Balance Sheet, current asset and liability schedules, working capital assessment, fund flow and key financial ratios.
Income and expenditure projections from the DPR must translate directly into CMA formats. Every number in the CMA annexures should reconcile with the DPR and the underlying Excel model. CMA Data is a planning and appraisal tool, not a guarantee of performance; banks apply their own assessment rules for margins, drawing power and maximum permissible bank finance. Project Report Bank assists promoters in preparing plant-specific CMA Data preparation for bank finance for soybean oil and other processing projects.
Working Capital Assessment and Seasonal Funding for Soybean Crushing Plants
Soybean-based edible oil plants in India face strong seasonality because the crop is harvested mainly during the Kharif season (October–December). Plants must procure and store large quantities for year-round crushing, creating peak inventory funding requirements between October and January.
Raw material procurement strategies are crucial for maintaining margins in soybean processing. The working capital assessment follows a step-by-step process: calculate the value of raw seed inventory at current procurement cost, add work-in-process valuation, finished oil and meal stock at cost, receivables at selling price, then subtract trade creditors and advances. The resulting gap is the total working capital requirement.
Bank-funded portion = Working Capital Gap × (1 − Promoter Margin %)
For a 1,000 TPD plant, if the average working capital gap is ₹406 crore and the promoter margin is 25%, the bank-funded limit would be approximately ₹305 crore. During peak procurement months, the actual requirement can exceed this average by 40–60%, requiring either enhanced seasonal limits or careful procurement planning. Working capital facilities typically include cash credit secured against stocks and receivables, letters of credit for procurement, and non-fund limits.
DSCR, Loan Repayment Capacity and Term Loan Structuring
The Debt Service Coverage Ratio measures whether the project generates sufficient cash to meet scheduled debt obligations:
DSCR = (Net Profit After Tax + Depreciation + Interest on Term Loan) ÷ (Principal Repayment + Interest on Term Loan)
Banks examine annual DSCR, average DSCR over the loan tenure, and minimum DSCR in any single year. Central Bank of India’s cluster scheme for edible oil-mill units stipulates an average DSCR of at least 1.25 for appraisal.
Illustrative 5-Year DSCR (1,000 TPD Plant, Term Loan ₹40 Crore)
| Year | Cash Available (₹ Cr) | Principal (₹ Cr) | Interest (₹ Cr) | Total Debt Service (₹ Cr) | DSCR |
|---|---|---|---|---|---|
| 1 | 53 | 0 (moratorium) | 5.2 | 5.2 | 10.19 |
| 2 | 69 | 5.0 | 4.6 | 9.6 | 7.19 |
| 3 | 74 | 5.7 | 3.9 | 9.6 | 7.71 |
| 4 | 73 | 5.7 | 3.2 | 8.9 | 8.20 |
| 5 | 73 | 5.7 | 2.5 | 8.2 | 8.90 |
| Average | 8.44 |
Note: The high DSCR in this illustration reflects a relatively small term loan relative to total project scale. In projects with higher leverage, DSCR would be lower and closer to threshold values.
Typical term loan structures for Indian edible oil projects include a construction period of 12–18 months with capitalised interest during construction, a moratorium of 6–18 months on principal after commissioning, and repayment over 7–9 years. Even profitable plants may show weak DSCR if working capital is under-funded or if crushing margins are overly optimistic in projections.
Project Cost, Means of Finance and Investment Planning
Promoters must arrive at a realistic project cost estimate before finalising financial projections. The total project cost includes land and site development, factory building and storage, core soybean oil processing plant (preparation, extraction, desolventising, refining as applicable), utilities (boiler, power, water supply and treatment), soybean crushing plant land, building and utilities requirements, storage tanks for raw soybeans, crude oil and refined oil, laboratory equipment for quality control, vehicles, preliminary and pre-operative expenses including interest during construction, contingencies (5–10%) and working capital margin. Licensing and registration costs are essential for setting up a processing plant and must be included in pre-operative expenses. Key certifications required for edible oil manufacturing and key regulatory procedures for environmental and factory approvals add to this cost.
Illustrative Project Cost & Means of Finance (500 TPD Plant)
| Component | ₹ Crore |
|---|---|
| Land & site development | 4.50 |
| Building & civil works | 8.00 |
| Plant & machinery | 18.00 |
| Utilities & infrastructure | 3.50 |
| Pre-operative expenses (incl. IDC) | 2.50 |
| Contingency (7%) | 2.56 |
| Working capital margin | 6.00 |
| Total Project Cost | 45.06 |
| Means of Finance | ₹ Crore |
|---|---|
| Promoter equity (30%) | 13.52 |
| Term loan (70%) | 31.54 |
| Total | 45.06 |
The debt-equity ratio affects interest burden, DSCR and project risk. Banks typically expect a promoter contribution of 25–30% supported by verifiable net worth. For detailed cost benchmarks across plant scale alternatives, refer to soybean crushing plant setup cost and investment.
Bank Finance Requirements and Bankable DPR for Soybean Oil Processing Plants
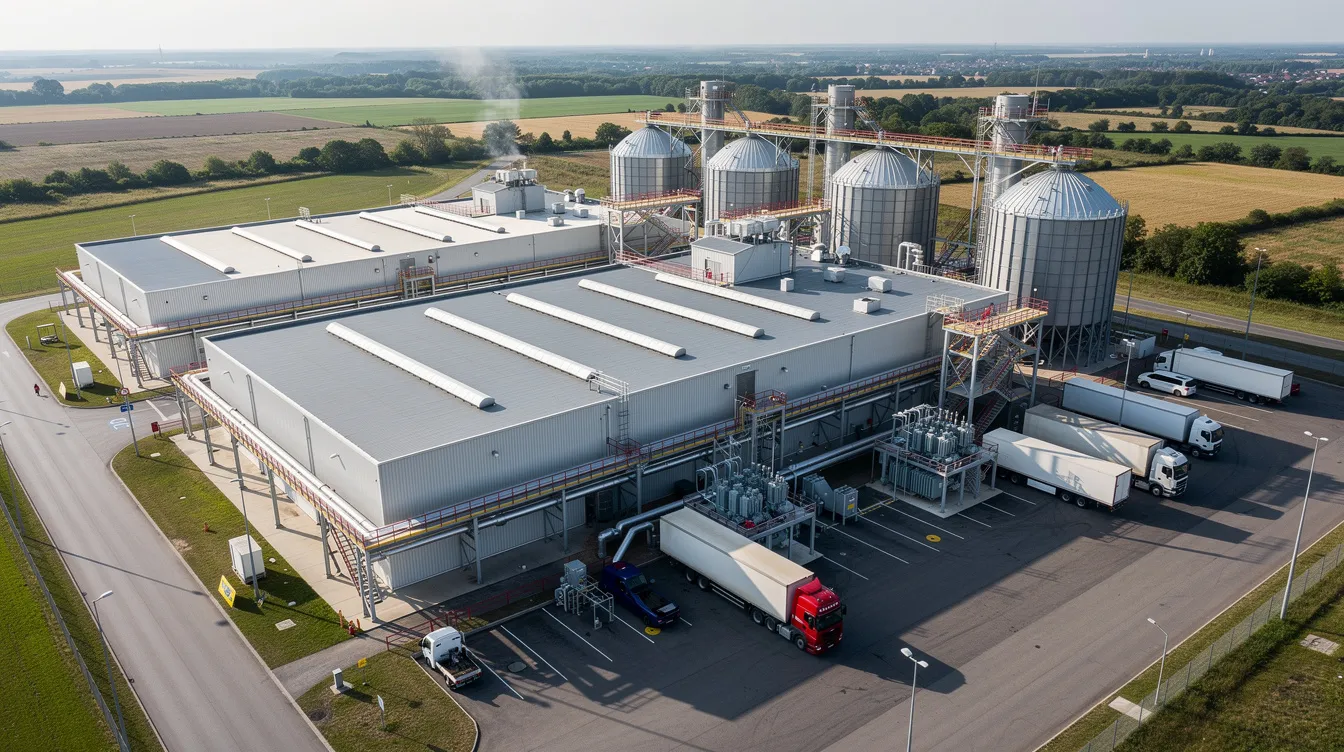
Indian banks require a consistent documentation package before considering term loan and working capital limits for industrial oil processing projects. A bankable detailed project report should cover: a comprehensive market overview and demand assessment for edible oil and soybean meal, description of the oil processing plant setup and technology, plant capacity and location, raw material requirements and catchment area, schematic flow of processing methods and various unit operations involved, management and promoter profile, project cost and means of finance, income and expenditure projections, DSCR and financial ratios, risk factors and mitigations.
Documentation also includes land records, environmental clearances, machinery quotations with specifications addressing machinery and technology requirements, KYC and audited financial statements of promoters, and details of proposed security. Project Report Bank provides professional Bank Finance DPR and Loan Proposal Assistance designed to meet Indian bank appraisal expectations. Sanction decisions remain with the bank, but a clear and consistent DPR reduces queries during appraisal.
Financial Feasibility, IRR, ROI, Break-Even and Sensitivity Analysis
Beyond DSCR, investors and lenders evaluate project IRR, equity IRR, net present value, payback period and break-even capacity utilisation. A plant’s financial feasibility requires assessing operational expenses and product yields together. In one published DPR for a 33.34 TPD plant, the break-even point was approximately 41% capacity utilisation, confirming that initial years with low throughput can still cover fixed costs if the plant operates above this threshold.
Sensitivity analysis is essential to prepare for price fluctuations in raw materials and market outputs. An illustrative sensitivity matrix for DSCR and EBITDA:
| Scenario | EBITDA Impact | DSCR Impact |
|---|---|---|
| Seed price +10% (₹62,000 → ₹68,200) | -₹17.4 Cr | Falls below threshold |
| Oil price -5% (₹140,000 → ₹133,000) | -₹3.5 Cr | Moderate decline |
| Meal price -10% (₹55,000 → ₹49,500) | -₹12.0 Cr | Material decline |
| Capacity utilisation Year 1: 50% vs 60% | -₹6.6 Cr | Stressed in Year 1 |
| Oil recovery 17% vs 18% | -₹3.9 Cr | Moderate decline |
This demonstrates that raw material price and meal demand carry the highest leverage on margins and repayment capacity. Market segmentation between oil buyers, meal exporters and feed manufacturers creates different price trends and risk factors for each revenue stream.
Common Projection and CMA Mistakes That Trigger Bank Queries
Many edible oil proposals receive repeated bank queries because of avoidable inconsistencies. The most common errors:
- Assuming soybean procurement prices below prevailing market or MSP trends
- Projecting 90–100% capacity utilisation from the first year of operations
- Overestimating oil recovery beyond technically achievable norms for the chosen equipment
- Ignoring refinery losses when projecting refined oil output
- Underestimating power, steam and hexane costs per tonne
- Omitting pre-operative expenses and interest during construction from project cost
- Mismatched numbers between DPR, CMA Data and Excel model
- Not accounting for seasonal inventory peaks that require funding above average working capital limits
- Absence of sensitivity analysis or downside scenario testing
- Treating variable costs as fixed when scaling production projections
Corrective steps include cross-checking recovery assumptions with equipment suppliers, reconciling all financial statements before submission, and ensuring the business model in the DPR matches the CMA Data schedules.
Expert Financial Advisory Perspective
I approach soybean oil processing plant financial modelling by first understanding the specific technical configuration: is it an extraction-only unit or does it include refining and packaging? What is the intended plant capacity and what technology is proposed? The answers to these questions set the production assumptions, and from there, I build the financial projections.
My practice links technical parameters (daily capacity, oil recovery rates, unit operations involved in extraction and refining, steam and power consumption) with financial assumptions (commodity prices, operating expenses, funding terms) into one integrated spreadsheet. This generates consistent P&L, Balance Sheet, Cash Flow, DSCR and ROI outputs. Every assumption is documented, and every projection can be traced back to its source.
I place emphasis on location-specific price trends, conservative stress-testing and transparent documentation of every variable. Through Project Report Bank, I offer professional financial projections and financial modelling services to project promoters, MSMEs and investors across India. The model is customised, but it remains a projection and not a guarantee of profitability or bank sanction. Transparent discussion with promoters about risk factors is part of the advisory process.
Professional DPR, CMA Data and Bank Finance Assistance by Project Report Bank
Project Report Bank supports soybean processing plant promoters from concept stage through bankable documentation. Services relevant to soybean oil production projects include customised Detailed Project Reports, bank finance DPR and loan proposal preparation, CMA Data for term loan and working capital, integrated 5–7 year financial projections covering profit projections and expenditure projections, DSCR and repayment analysis, working capital assessment, and query-handling support during appraisal.
If you are planning a medium or large soybean solvent extraction or oil processing plant and need structured financial analysis for project funding and bank finance, you can discuss your requirement directly.
Discuss your soybean processing plant DPR & bank finance requirement on WhatsApp
Website: https://projectreportbank.com/
Frequently Asked Questions
The following FAQs address practical queries on financial projections, CMA and bank finance for soybean oil processing projects that may not be fully covered in the main discussion.
How detailed should financial projections be for a soybean oil plant loan proposal?
Banks prefer at least 5–7 years of year-wise projections with clearly visible assumptions, product-wise revenues, cost break-up, DSCR, break-even analysis and working capital assessment. Summary-only numbers without supporting assumptions are not sufficient for projects involving capital investments of ₹30 crore or more. The detailed report should show how revenue is derived from annual production, how costs per MT translate to total operating cost, and how cash flow supports debt service in each year.
Can financial projections for a soybean oil processing plant be revised after bank queries?
Projections can be refined when genuine changes occur, such as updated machinery quotations, revised interest rates or capacity modifications. They should not be changed arbitrarily to match a target DSCR. Every revision must be documented and consistent across DPR, CMA Data and the financial model. Banks notice when only one ratio changes without corresponding adjustments in production, cost or funding assumptions.
Do banks insist on industry benchmarks for oil recovery and crushing margins?
While banks do not always publish formal benchmarks, experienced appraisers cross-check recovery and margin assumptions against typical ranges for similar soybean oil processing plants. Projections assuming oil recovery above 19% or crushing margins above industry trends for extended periods will draw queries. Assumptions should align with realistic technical norms from equipment suppliers and independent references on processing methods.
Is audited historical data required for a new greenfield soybean oil plant?
For a new company, banks review audited financials, net-worth proofs and income tax returns of the promoters and any existing group entities, along with projected statements for the new plant. For existing oil processing companies expanding capacity, historical P&L and Balance Sheet trends form critical inputs. The promoter’s track record in managing human resource requirements, procurement and operations in related industries adds credibility.
What is the role of subsidies or incentives in soybean oil plant financial projections?
Capital subsidies, interest subvention or state incentives can improve overall project returns and investment opportunities, but they should be treated conservatively. Unless eligibility, scheme continuity and disbursement timelines are reasonably confirmed, the base-case financial analysis should demonstrate viability without subsidy. Banks appraise repayment capacity on pre-subsidy cash flows, and any subsidy received later improves the project economics rather than being a precondition for it. Key success in financial modelling lies in building projections that stand on their own commercial logic.
Conclusion: Building Bankable Financial Projections for Soybean Oil Processing Plants
The financial success of a soybean oil processing plant depends on realistic modelling of crushing margins, seasonal working capital and debt servicing capacity. Soybean oil processing is a thin-margin, high-volume business where small assumption errors compound into material cash flow gaps. A plant that processes 280,000 MT of soybeans annually with a margin error of just ₹500 per MT faces a ₹14 crore annual gap between projected and actual results.
Integrated financial projections, CMA Data and DSCR analysis must all align with each other and with the technical design of the oil processing plant for the DPR to be credible with banks and investors. The financial analysis must address revenue, costs, and profitability metrics in a manner that reflects actual industry trends and price trends rather than aspirational targets.
Promoters planning soybean oil processing projects should invest professional effort upfront to get their financial model right before committing large capital expenditure on land, building and soybean processing machinery. A well-prepared financial model serves not just as a bank submission document but as a decision-making tool for the promoter. Project Report Bank, led by a practising Chartered Accountant, provides structured advisory support to entrepreneurs and businesses planning soybean oil and other edible oil processing projects across India.
About the Author
CA Manish Gugliya, FCA, DISA (ICAI), is a practising Chartered Accountant since 2006 and founder of Manish Gugliya & Company. Through ProjectReportBank.com, he provides professional assistance in Detailed Project Reports, CMA Data, financial projections, project feasibility, project finance and bank loan proposals for industrial and business projects across India.