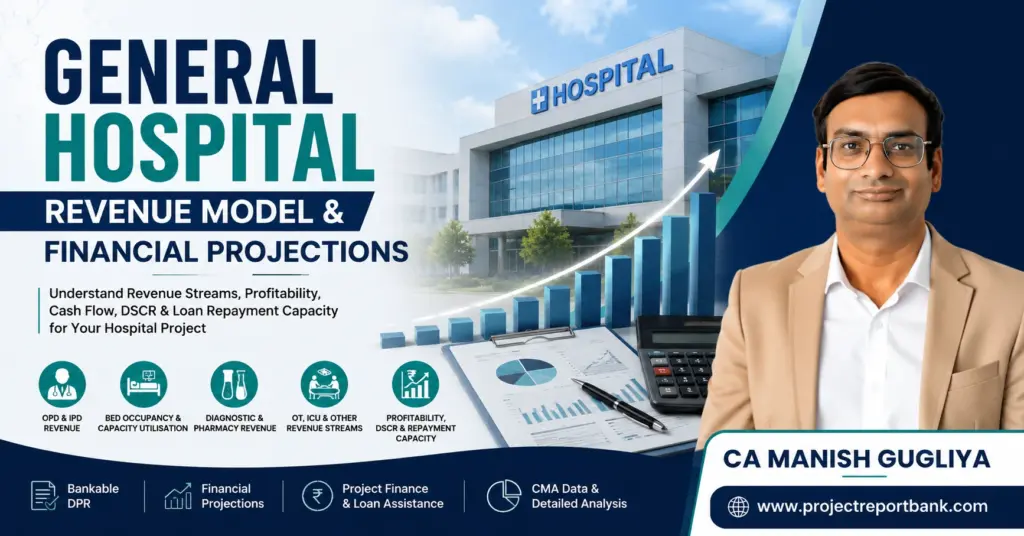
Key Takeaways
- A general hospital revenue model connects bed capacity, OPD/IPD volumes, tariffs, and utilisation to realistic revenue, profitability, and cash flow projections – not just beds × room rent × 365 days.
- A bankable general hospital DPR must convert operational drivers (occupancy, procedures, diagnostics, pharmacy) into structured hospital financial projections spanning 5–7 years.
- For hospital project reports for bank loan – whether 10, 20, 30, or 50 bed hospitals – assumptions on bed occupancy rate, average revenue per occupied bed, and ICU/OT usage matter far more than simple multiplication.
- DSCR, break-even analysis, and loan repayment capacity depend directly on the quality and conservativeness of the hospital revenue model.
- This article is written from the perspective of CA Manish Gugliya (ProjectReportBank.com), focusing on practical, India-specific hospital project finance and financial planning.
Explore General Hospital DPR Guides
Explore our complete series on General & Small Hospital project planning, cost, financial projections, repayment capacity and bank finance.
Introduction: Why a Practical General Hospital Revenue Model Matters
General hospitals operate under a complex financial ecosystem balancing various services, and estimating their revenue requires far more than arithmetic. Most hospital revenues come from patient services, including inpatient and outpatient care, but the actual revenue model must capture OPD consultations, IPD admissions, ICU charges, operation theatre billing, diagnostics, pharmacy, emergency services, and several other hospital income sources.
Financial management in hospitals involves maintaining a balance between revenue, operating costs, and capital requirements. In India, a general hospital DPR and general hospital financial projections are used for bank loan appraisal, investment decisions, and internal planning – and they must reflect how patient care is actually delivered and billed. Healthcare financial planning must align with operational and strategic goals, not just spreadsheet formulas.
The core chain I use throughout hospital project reports is: Capacity → Utilisation → Patient Volume → Average Realisation → Revenue. This article walks you through that process, written as CA Manish Gugliya – a Chartered Accountant experienced in hospital DPRs, CMA data, and project finance. For a detailed discussion on project cost and funding structure, refer to the separate guide on General Hospital Project Cost & Means of Finance.
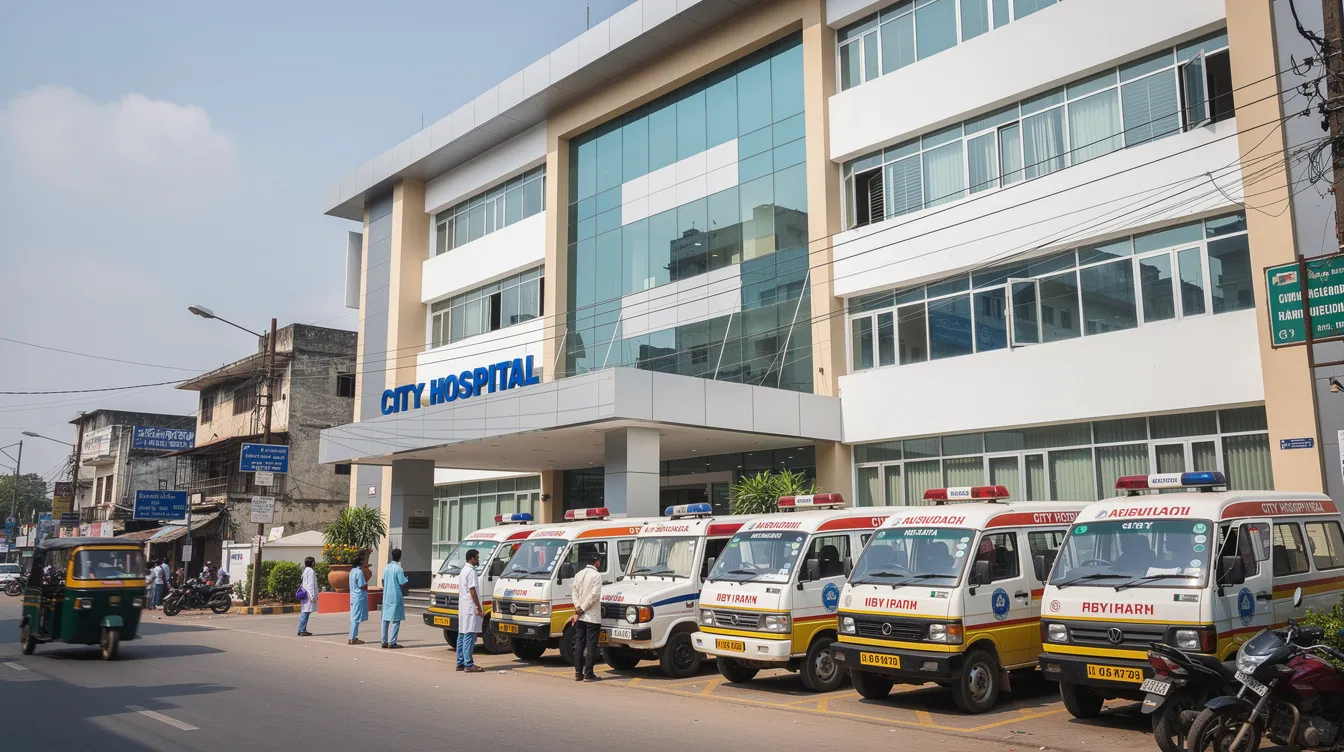
Understanding the General Hospital Revenue Model Concept
A hospital financial model is the structured method of converting clinical capacity – beds, OTs, ICUs, diagnostic machines – and patient flows into projected revenue, profitability, and cash flow. The stepwise logic is straightforward: installed capacity leads to expected utilisation, which determines patient volumes, which combined with average billing per patient or bed-day produces total revenue.
Hospital revenue calculation must be driver-based. Each major revenue head should tie back to operational assumptions – OPD footfall, admissions rate, average length of stay, case mix. Revenue streams include inpatient services, outpatient services, and specialized procedures, and each must be modelled separately. A credible hospital financial model integrates these revenue lines with operating expenses, projected P&L, cash flow, balance sheet, and key ratios such as EBITDA margin, DSCR, and break-even point.
Major Revenue Streams of a General Hospital
A hospital’s financial success relies on balancing high-margin specialized procedures with consistent outpatient revenue. Hospitals often subsidize low-margin services using revenue from high-margin services. Here is how the typical revenue mix looks for an Indian general hospital:
| Revenue Stream | Typical Share | Key Billing Components |
|---|---|---|
| IPD (Bed Charges + Services) | 55–70% | Room rent, nursing, service charges |
| OPD Consultations | 10–20% | Consultation fees, follow-ups |
| ICU | 5–10% | Monitoring, ventilator, critical care |
| OT / Procedures | 8–15% | Surgery packages, consumables |
| Diagnostics | 5–12% | Pathology, radiology, imaging |
| Pharmacy | 5–15% | Medicines, consumables margin |
| Emergency / Casualty | 3–8% | Emergency consults, observation |
| Other (Ambulance, Packages) | 1–5% | Health check-ups, ambulance services |
In India, IPD contributes roughly 71–72% of the aggregate hospital delivery revenue market, with OPD accounting for the remainder. Understanding each stream separately avoids double counting and supports proper hospital profitability analysis.
OPD Revenue – Consultations and Visits
Outpatient services have become one of the fastest-growing segments for hospitals globally. OPD serves as the main entry point for patients and a critical feeder for IPD admissions.
Key inputs include number of consulting doctors, average patients per doctor per day, working days, and average consultation fee. The formula is:
Annual OPD Revenue = Average OPD Patients per Day × Average Consultation Revenue × OPD Working Days
For example: 80 patients/day × ₹400 × 300 days = ₹96 lakhs annually. This is illustrative only. From a bank’s perspective, assuming realistic ramp-up in OPD volumes over the first 3–4 years is more credible than starting at peak numbers.
IPD Revenue – Bed Charges and Inpatient Services
Inpatient services generate revenue from patients admitted for overnight stays and usually form the backbone of any hospital revenue model. The hospitals must consider the type and severity of patients, which influences revenue per admission – a concept measured by the average case mix index indicating severity and resource intensity.
Key formulas:
Occupied Bed Days = Number of Beds × 365 × Occupancy Rate
Annual IPD Revenue = Occupied Bed Days × Average Revenue per Occupied Bed Day
Illustration: 30 beds × 365 × 50% occupancy × ₹3,000/day = ₹1.64 crore. These figures are purely illustrative. IPD volumes also drive associated pharmacy, diagnostics, and procedure revenues.
ICU Revenue – High Acuity Care
ICU beds typically have lower occupancy initially but much higher daily billing – often ₹8,000–₹20,000 per occupied bed day compared to ₹3,000–₹5,000 for ward beds. ICU revenue should be modelled separately with its own bed count and occupancy assumptions. Specialized services and surgeries are often high-margin for hospitals, and ICU care falls squarely in that category.
Operation Theatre and Procedure Revenue
OT revenue comes from planned surgeries, emergency surgeries, and day-care procedures. Key drivers include number of OTs, available hours, utilisation rate, and average surgery billing.
Annual OT Revenue = Number of Surgeries per Year × Average Billing per Surgery
The number of surgeries should logically follow from IPD admissions and emergency case-mix – not be assumed independently. Showing phased OT utilisation ramp-up (say 25% in Year 1 rising gradually) is more credible for lenders.
Diagnostic Revenue (Pathology, Radiology and Others)
Ancillary services contribute revenue from diagnostic testing and pharmacy services. Diagnostics include pathology, X-ray, ultrasound, ECG, and where relevant, CT/MRI. Revenue comes from two segments: internal hospital patients and external walk-in referrals. Adding CT/MRI changes both project cost and revenue assumptions, which must align. For equipment planning, refer to the guide on small hospital equipment list and cost.
Pharmacy Revenue – Turnover vs Margin
A common mistake I observe in hospital projections is treating entire pharmacy sales as net income. Pharmacy may show high turnover, but only the gross margin (typically 25–30% after purchase cost) flows into hospital EBITDA:
Pharmacy Gross Profit = Pharmacy Turnover × Average Gross Margin %
This distinction is essential for accurate DSCR calculation and hospital profitability analysis.
Emergency and Casualty Revenue
Emergency departments often operate as financial loss leaders but admit high-value patients who then contribute to IPD, ICU, OT, and diagnostic revenue. In semi-urban Indian locations, the casualty department can be a significant driver of hospital occupancy and brand image. Government programs reimburse hospitals via fixed payment systems regardless of cost, which further impacts emergency revenue realisation.
Other Hospital Revenue Sources
Revenue from ancillary services includes cafeteria and ambulance services, preventive health check-up packages, physiotherapy, dialysis units, and corporate or TPA contracts. While smaller in the overall hospital financial projections, these services improve margins and patient stickiness.
Key Revenue Drivers in a Hospital Financial Model
A hospital’s revenue is influenced by patient volume, regulatory pressures, and cost structures. Revenue performance can be affected by external factors like demographics and competition. Effective billing and revenue cycle management are essential for hospital financial performance. Historical trend analysis helps forecast patient volumes effectively.
| Key Driver | Primary Impact Area |
|---|---|
| Bed count and mix | IPD, ICU revenue |
| Bed occupancy rate | IPD, ICU, pharmacy, diagnostics |
| OPD footfall | OPD revenue, IPD conversion |
| Average length of stay | Occupied bed days |
| ARPOB | IPD and ICU revenue per bed |
| Speciality and case mix | ARPOB, OT revenue |
| Payer mix (cash/TPA/insurance) | Realisation, receivables |
| Doctor availability | OPD, surgical volumes |
| Location and catchment | All revenue streams |
Payer mix is a critical factor in hospital revenue, influencing reimbursement rates. A 34% underpayment for inpatient behavioral health services is common in certain global contexts – Indian hospitals face analogous challenges with government scheme tariffs. For small hospital revenue models (10–50 beds), occupancy and ARPOB together largely determine sustainability.
Bed Occupancy – Central Assumption in a General Hospital Revenue Model
Bed occupancy rate is arguably the single most impactful assumption in general hospital financial projections. Average bed occupancy in Indian district hospitals is approximately 57%, with many private start-ups achieving even lower figures initially.
A typical ramp-up pattern:
- Year 1: 35–45% occupancy as hospital establishes reputation
- Year 2: 50–60% with growing referral network
- Year 3–4: 65–75% approaching stabilisation
A shift from 40% to 60% occupancy increases occupied bed days by 50% – dramatically lifting revenue, EBITDA, and DSCR while fixed costs remain largely unchanged. Banks routinely test sensitivity of projections to lower-than-expected occupancy.
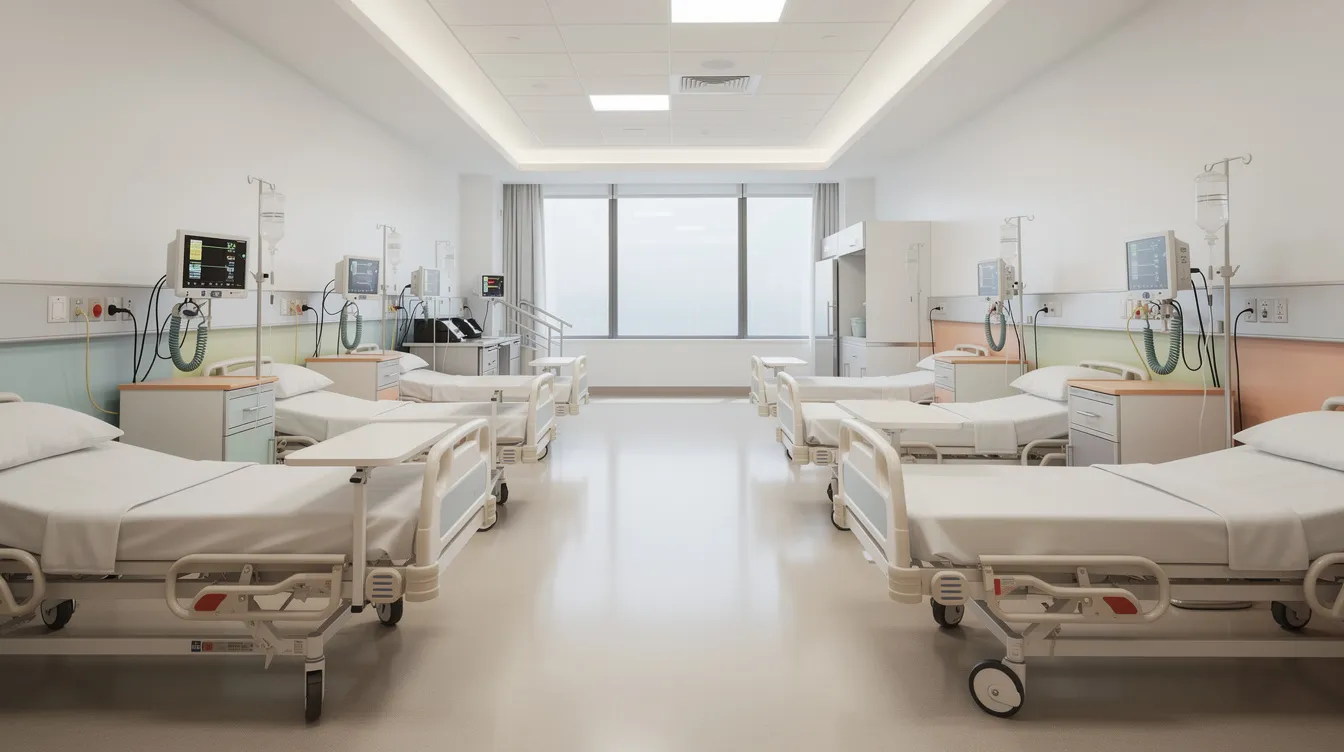
How to Calculate Hospital Revenue – Illustrative 30-Bed Hospital Model
Here is a simplified revenue build-up for a hypothetical 30-bed general hospital in a Tier-2 city:
| Assumption | Value |
|---|---|
| Total beds | 30 (including 4 ICU) |
| Year 1 occupancy (ward) | 45% |
| Year 1 occupancy (ICU) | 35% |
| OPD patients/day | 70 |
| Avg. consultation fee | ₹450 |
| Avg. IPD revenue/bed-day | ₹3,500 |
| Avg. ICU revenue/bed-day | ₹10,000 |
| Surgeries/month | 15 |
| Avg. surgery billing | ₹25,000 |
| Diagnostic revenue/patient | ₹600 (OPD), ₹1,500 (IPD) |
| Pharmacy gross margin | 25% on turnover |
Year 1 Illustrative Revenue Build-Up:
| Revenue Head | Calculation | Amount (₹ Lakhs) |
|---|---|---|
| OPD Revenue | 70 × ₹450 × 300 days | 94.5 |
| IPD Revenue | 26 beds × 365 × 45% × ₹3,500 | 149.6 |
| ICU Revenue | 4 beds × 365 × 35% × ₹10,000 | 51.1 |
| OT Revenue | 15 × 12 × ₹25,000 | 45.0 |
| Diagnostics | Estimated | 38.0 |
| Pharmacy Gross Profit | Estimated margin | 22.0 |
| Emergency & Other | Estimated | 18.0 |
| Total Estimated Revenue | ~₹4.18 Cr |
These figures are illustrative and should not be treated as standard revenue benchmarks. Every hospital project must be customised to its specific circumstances.
This is exactly the driver-based approach used in hospital DPR financial projections prepared for banks, where automated budgeting tools built in Microsoft Excel can save finance teams hundreds of hours annually in creating and updating models.
Revenue Modelling for 10, 20, 30 and 50 Bed Hospitals
The hospital financial model cannot be linearly scaled by bed count. Here is how the approach differs:
| Parameter | 10 Beds | 20 Beds | 30 Beds | 50 Beds |
|---|---|---|---|---|
| ICU beds | 0–2 | 2–4 | 4–6 | 6–10 |
| OTs | 1 | 1–2 | 2–3 | 3–4 |
| Diagnostics depth | Basic | Moderate | Full | Advanced |
| Staffing complexity | Low | Moderate | Moderate-High | High |
| Working capital need | Lower | Moderate | Higher | Significant |
For 20-bed and 30-bed hospital revenue models, banks still expect realistic ramp-up assumptions and clear linkage between patient volumes and revenue heads. The small hospital setup cost in India varies significantly across these capacities.
Preparing 5–7 Year Hospital Financial Projections
A general hospital DPR converts operational revenue assumptions into full financial projections. Early years focus on ramp-up; later years reflect stabilisation and moderate growth.
Projected Revenue Build-Up
Revenue grows through increasing occupancy, improved OT utilisation, and limited tariff revision – not arbitrary percentage jumps. Rolling forecasts allow updates based on real-time data as the hospital matures. Health system revenues increased by 12.5% from 2021 to 2022 globally, but individual hospital growth depends entirely on local demand and operations.
Operating Expenses and Hospital Cost Structure
Labor costs account for 60% of a hospital’s budget globally, and Indian hospitals face similar proportions when including doctor fees, nursing staff, technicians, and administrative expenses. Healthcare organizations may face a shortage of 200,000 to 450,000 nurses by 2025, which pressures salary costs. U.S. hospitals faced over $42.5 billion in cost surges from 2021 to 2023, and operating expenses rose by 17.2% from 2021 to 2022 – Indian hospitals experienced comparable inflationary pressures. PwC forecasts an 8% rise in medical costs for 2025.
Major cost heads include doctors’ fees, nursing and paramedical salaries, medicines, consumables, pathology reagents, oxygen, electricity, housekeeping, biomedical waste disposal, repairs, insurance, marketing, and software. Predictive analytics can optimize staffing levels in healthcare, and zero-based budgeting can reduce costs by 20%–40%. Expenses should be categorised into fixed, semi-variable, and variable for proper break-even and sensitivity analysis. Compliance costs are particularly burdensome for smaller healthcare providers.
EBITDA and Operating Profitability
EBITDA = Revenue − Operating Expenses (before interest, tax, depreciation)
Higher occupancy improves EBITDA by spreading fixed costs over more revenue. For established multi-speciality hospitals, EBITDA margins typically range 10–20%.
Depreciation, Interest and Net Profit
Technological investments and capital expenditures require significant financial resources. Hospitals carry substantial depreciation from building, medical equipment, and furniture. Interest expense depends on term loan structure discussed in the General Hospital Project Cost & Means of Finance guide. Profit after tax may remain modest in early years even when EBITDA is positive.
Projected Profit & Loss Account for a General Hospital
A simplified projected hospital P&L for a stabilised year:
| Line Item | Amount (₹ Lakhs) |
|---|---|
| Total Hospital Revenue | 650 |
| Less: Operating Expenses | 540 |
| EBITDA | 110 |
| Less: Depreciation | 35 |
| EBIT | 75 |
| Less: Interest | 28 |
| Profit Before Tax | 47 |
| Tax | 12 |
| Profit After Tax | 35 |
Illustrative only – a 30-bed hospital in Year 4.
Projected Cash Flow and Hospital Loan Repayment Capacity
Accounting profit and cash flow are different. A hospital may show accounting loss in early years but still meet term-loan instalments if cash accrual (PAT + depreciation) is sufficient. Bad debt from uninsured or underinsured patients directly impacts net revenue realization and cash flow. The key components of a hospital cash flow projection include operating cash flow, capital expenditure, term-loan repayment, interest, taxes, and working capital movement.
Projected Balance Sheet and Working Capital in Hospital Projects
The projected balance sheet ties together fixed assets, current assets (inventory, accounts receivable, cash), and liabilities (term loan, working capital limits, creditors). Hospital working capital requirement covers medicine inventory, salaries, utility expenses, TPA/insurance receivables (often delayed 60–90 days), and minimum cash balance for operations. Working capital grows as turnover increases and must be factored into project cost from the start.
Break-Even Analysis and Occupancy Threshold
Break-Even Sales = Fixed Costs ÷ Contribution Margin Ratio
For a small hospital, break-even occupancy might fall in the 50–60% range depending on ARPOB and cost structure. Translating break-even from a sales figure to occupancy percentage helps promoters plan marketing, referral tie-ups, and service expansion practically.
DSCR and Hospital Loan Repayment Analysis
DSCR = Net Cash Accrual Available for Debt Service ÷ (Principal Repayment + Interest)
Banks typically expect average DSCR of 1.2–1.3 or higher over the loan tenor. Under a base-case projection with 70% occupancy, DSCR may be comfortable at 1.5; under a low-occupancy scenario (55%), it could drop below 1.2 – making the loan proposal risky. Hospital project finance appraisal places strong emphasis on DSCR trends across the entire repayment period.
Sensitivity Analysis – Testing the Hospital Financial Model
| Scenario | Impact on EBITDA | Impact on DSCR |
|---|---|---|
| Occupancy 15% lower | Drops 25–35% | Falls below comfort |
| OPD 20% lower | Drops 8–12% | Moderate reduction |
| Staff costs 10% higher | Drops 10–15% | Noticeable pressure |
| Revenue 10% below plan | Drops 15–20% | Significant risk |
| Commissioning delayed 6 months | Negative EBITDA Year 1 | Severe impact |
Banks routinely review such sensitivity tables before sanctioning term loans for hospital projects. This kind of cost analysis and scenario testing strengthens DPR credibility.
How Banks and Lenders Evaluate Hospital Revenue Projections
From a lender’s perspective, bank credit appraisals look beyond revenue numbers to evaluate promoter experience, location and catchment analysis, bed capacity assumptions, tariff benchmarks against comparable hospitals, project cost and debt-equity structure, profitability, cash accrual, DSCR, and working capital adequacy. Overly aggressive projections reduce credibility. A balanced, data-backed hospital revenue model supported by realistic occupancy and tariff assumptions significantly improves chances of bank loan approval.
Common Mistakes in General Hospital Financial Projections
In my experience reviewing hospital project reports, the most frequent errors include:
- Assuming 70%+ occupancy from Year 1
- Projecting revenue as flat percentage growth without patient-volume basis
- Double counting revenue (packages and individual services separately)
- Confusing pharmacy turnover with pharmacy margin
- Underestimating staff costs and maintenance expenses
- Ignoring working capital and TPA payment delays
- Preparing identical projections for every hospital regardless of location or capacity
Copy-paste financial models from unrelated projects are quickly detected by bank analysts and weaken the DPR’s credibility. Each hospital project must reflect its specific resources, demand, and competitive reality.
Information Required to Prepare a Robust General Hospital Revenue Model
Before engaging a professional for hospital financial projections, promoters should prepare: proposed location and catchment details, land/building plan, total built-up area, bed capacity and bed mix, ICU/OT details, planned clinical departments, diagnostic modalities, major equipment list, staffing plan, proposed tariffs, expected OPD/IPD volumes, TPA/corporate tie-ups, total project cost estimate, means of finance, working capital requirement, and implementation schedule.
Conclusion – Aligning Medical Vision with Financial Reality
A hospital can be clinically excellent yet face financial stress if its revenue model, staffing, tariffs, project cost, working capital, and financing structure are not properly aligned. The healthcare sector demands that promoters and healthcare leaders treat financial projections with the same rigour as clinical planning. Realistic, driver-based hospital revenue models are essential for a bankable DPR, sustainable operations, and long-term success in this business.
At ProjectReportBank.com, CA Manish Gugliya prepares customised general hospital DPRs, small hospital financial projections, CMA data, DSCR analysis, and bank-loan oriented financial models for Indian hospital projects. If you are planning a general hospital and need support with project finance, revenue modelling, or DPR preparation, reach out to ProjectReportBank.com for professional, practice-tested advisory.
Frequently Asked Questions
How does a general hospital generate revenue in India?
Revenue comes from a combination of OPD consultations, IPD bed charges, ICU monitoring, OT and procedure billing, diagnostics (pathology and radiology), pharmacy margin, emergency services, and ancillary services like ambulance and health check packages. The exact mix depends on bed capacity, specialities, location, and patient profile. For most small general hospitals, IPD and ICU/OT services contribute the largest share of income.
What is a realistic occupancy assumption for a new general hospital project?
There is no single correct percentage. Realistic assumptions depend on location, competition, promoter reputation, and referral network. New hospitals typically ramp up over 3–4 years, starting with modest occupancy in Year 1 and rising gradually. Banks prefer conservative, evidence-backed assumptions rather than aggressive numbers.
Can the same financial model be used for 10, 20, 30 and 50 bed hospitals?
While the structure of the hospital financial model can be similar, assumptions for capacity, occupancy, service mix, staffing, and cost structure must be customised. Blindly scaling revenue and costs by bed count ignores differences in ICU/OT setup, diagnostics depth, fixed-cost absorption, and market demand, leading to misleading financial projections.
How do hospital DPR financial projections help in getting a bank loan?
Banks rely on DPR-based projections to judge whether projected revenue, EBITDA, and cash accrual can comfortably service the proposed term loan and working capital limits. Well-prepared projections demonstrate the promoter’s understanding of hospital operations, reduce perceived risk, and improve the chances of timely loan sanction.
What professional help is advisable for preparing a general hospital revenue model?
Promoters and doctors should work with professionals experienced in both healthcare operations and project finance – such as a Chartered Accountant familiar with hospital DPRs, bank appraisal norms, and forecasting methods. At ProjectReportBank.com, CA Manish Gugliya prepares customised revenue models and financial projections that align clinical plans with financial feasibility and lender expectations, acting as a trusted consultant and stakeholder in your hospital project’s success.
Explore All General Hospital DPR Guides
Continue exploring our complete series on General & Small Hospital project planning, setup cost, equipment, financial projections, repayment capacity and bank finance.