Key Takeaways
A UHT milk plant revenue model is fundamentally built on saleable litres multiplied by realistic net sales realisation per litre. Installed capacity and MRP printed on cartons are starting points, not endpoints. Many promoters overestimate revenue by assuming full capacity utilisation from Day 1 and treating MRP as the price they will actually receive. In practice, net revenue is what remains after deducting distributor margins, retailer margins, trade discounts, freight, returns, and damages.
The UHT milk business model depends on a balanced product mix of white milk variants and value-added products, an appropriate range of pack sizes, and a well-considered sales-channel mix spanning retail, institutional, private-label, and selective export customers. Each combination of product, pack size, and channel delivers a different contribution margin and working-capital profile.
UHT milk plant profitability in India is driven primarily by raw milk procurement cost, aseptic packaging material cost, capacity utilisation levels, product-wise contribution margins, and working-capital discipline. A bankable detailed project report must include product-wise and channel-wise revenue assumptions, contribution analysis, and sensitivity testing against changes in milk price, packaging cost, and utilisation. This article is written from the practical DPR and financial-analysis perspective of CA Manish Gugliya (FCA, DISA ICAI) for entrepreneurs planning a UHT milk processing plant in India.
Introduction: Why Revenue Model & Product Mix Matter More Than Capacity
When promoters approach me for a UHT milk project report, the conversation almost always begins with machinery tonnage, plant layout, and total capital investment. These are important, but they do not determine how much revenue the plant will actually generate. Revenue in a UHT milk manufacturing business depends on how many litres you sell, at what net price, through which channels, in which pack sizes, and with what product portfolio. A plant rated at 50,000 litres per day that operates at 40% utilisation and sells predominantly through low-margin institutional contracts will generate vastly different revenue from a plant of the same capacity running at 70% utilisation with a balanced mix of branded retail and flavoured milk products.
The UHT milk plant revenue model is the financial engine of the entire business plan. It connects processing capacity to market reality. In the global market, UHT milk consumption reached approximately 130.97 billion litres in 2025, with projections indicating growth to 205.42 billion litres by 2034 at a CAGR of around 5.10%. Within India, the UHT milk market reached roughly 1,468 million litres in 2025 and is expected to expand to approximately 4,148 million litres by 2034, driven by urbanisation, increasing demand for long shelf life products, and the fact that UHT milk eliminates the need for expensive cold-chain transport during distribution. This makes UHT milk particularly advantageous in regions lacking widespread refrigerated facilities.
In my experience of preparing project reports, a well-designed product mix balances simplicity in operations with diversification for higher margins. Promoters interested in understanding initial investment can refer to our guide on UHT milk processing plant setup cost in India, while those evaluating equipment can review UHT milk plant machinery and equipment cost. This article concentrates specifically on the revenue model and product-mix planning that determine whether your plant becomes financially viable.
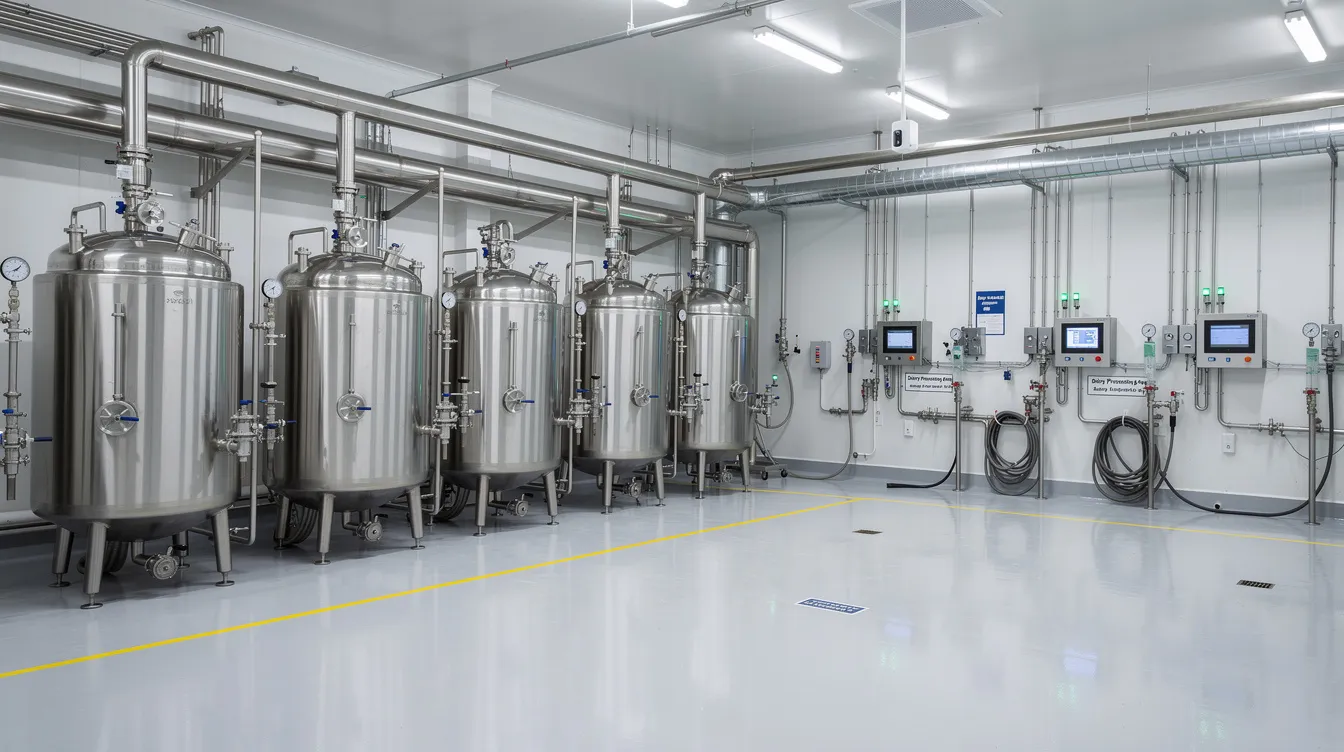
What Is the Revenue Model of a UHT Milk Plant?
The basic revenue equation for any UHT milk processing plant is straightforward:
Revenue = Saleable production volume × Average net sales realisation per litre
However, each component of this equation involves multiple layers that must be carefully estimated.
- Installed milk processing capacity defines the upper limit. A plant rated at 30,000 litres per day cannot sell 40,000 litres. But it also rarely sells 30,000 litres, especially in initial years.
- Operating days per year matter. Most plants plan for 300–330 operating days after accounting for maintenance shutdowns, festivals, and seasonal procurement gaps.
- Expected capacity utilisation determines actual production. A new plant may realistically start at 40–50% utilisation and take three to five years to reach 75–85%, depending on milk procurement stability and market development.
On the production side, not all raw milk entering the plant emerges as saleable UHT milk. Standardisation adjusts fat and SNF levels, and losses during UHT processing (typically 0.5–1%) and aseptic packaging (1–2%) reduce saleable output. These process-related deductions must be factored into any credible financial projection. For a detailed understanding of how these stages work, refer to the UHT milk manufacturing process and flow chart.
The expanded revenue equation accounts for product-wise allocation (what percentage goes to toned, full-cream, flavoured, or other variants), pack-size mix (200 ml, 500 ml, 1 litre), gross selling price per SKU, and then subtracts trade margins, discounts, promotional schemes, freight, returns, and damages to arrive at net sales realisation. The difference between gross invoice value (typically calculated near MRP) and the net revenue retained by the manufacturer can be 15–25% or more. Any UHT milk plant revenue model presented in a DPR should spell out these elements transparently so that lenders can assess the reasonableness of projected income.
Main Revenue Streams in a UHT Milk Plant Business Model
UHT milk manufacturing revenue typically flows from multiple streams, and a robust business model should not rely on a single channel. Dependence on one buyer or one sales channel exposes the project to concentration risk that banks view unfavourably.
The core UHT milk plant income sources include:
- Branded retail sales (general trade, modern retail, e-commerce)
- Institutional and HORECA sales (hotels, restaurants, caterers, hospitals)
- Private-label and contract manufacturing
- Export revenue
- Revenue from value-added UHT milk products (flavoured, fortified, lactose-free, organic)
- By-product revenue (cream, buttermilk, or other recoverable dairy components from standardisation)
Each stream differs in volume potential, price realisation, marketing cost, and credit period. The following sections examine each in detail.
Branded Retail Sales: Core of UHT Dairy Plant Revenue
Branded retail sales through distributors, supermarkets, grocery stores, modern retail chains, and e-commerce platforms typically form the largest revenue stream for an established UHT dairy plant. Building a consumer brand offers the highest long-term price realisation per litre but demands sustained investment in advertising, trade promotions, and distribution infrastructure. Urban retail chains are increasing procurement of UHT milk products, making this channel increasingly attractive for new entrants.
Within branded retail, toned and standardised UHT milk usually drive volume, while full-cream, double-toned, skimmed, and flavoured milk variants contribute to portfolio breadth and margin improvement. Plain white UHT milk often operates on tight competitive margins due to price sensitivity and competition from established cooperatives and regional brands. The real margin uplift in retail comes from value-added products like flavoured milk and fortified variants.
From a DPR perspective, branded retail typically involves distributor credit periods of 7–21 days, retailer margins of 8–12%, and distributor margins of 3–5%. Trade schemes and discounts can further reduce net realisation by 2–5%. Promoters should note that branded retail is SKU-intensive, which increases packaging-material inventory and working-capital requirements. A mature UHT milk plant may allocate 50–60% of its volume to branded retail channels.
Institutional and HORECA Revenue
The institutional and HORECA segment – hotels, restaurants, cafés, caterers, hospitals, schools, and defence establishments – provides regular, predictable volumes that help stabilise plant operations. UHT plants can secure stable cash flow by supplying commercial buyers with consistent weekly or monthly orders. This segment typically uses standardised and toned UHT milk in larger pack sizes (1 litre and above), sometimes full-cream for specific culinary applications.
Institutional pricing is usually more competitive, with lower margins per litre than retail. However, the advantages include higher off-take per buyer, minimal promotional spends, and improved capacity utilisation. The challenges include longer credit cycles (often 30–60 days), rate contracts with periodic renegotiation, and price sensitivity. These factors must be reflected honestly in UHT milk project profitability projections.
Private-Label and Contract Manufacturing Revenue
Private-label UHT milk manufacturing for large retail chains, established dairy brands, or regional marketers is a practical way of improving capacity utilisation, particularly for a greenfield plant still building its own brand. Under this model, the plant earns a conversion or ex-factory price per litre with minimal marketing expenditure but accepts lower margins and dependence on a few major buyers.
Private-label volumes can stabilise operations in the early years while the promoter gradually develops distribution for their own brand. From a lender’s perspective, long-term contracts, confirmed off-take agreements, or documented relationships with private-label clients strengthen the UHT milk plant financial analysis in a bankable DPR. However, over-reliance on private-label revenue without a parallel brand-building strategy can limit long-term profitability.
Export Revenue from UHT Milk and Value-Added Products
India’s dairy export is steadily increasing, targeting multiple countries, and UHT milk’s longer shelf life compared to conventional milk enables broader distribution across geographies. However, promoters should not project significant export revenue without established buyer relationships and a clear understanding of destination-country regulations, packaging norms, and quality standards. Our guide on UHT milk quality control and shelf-life testing covers the quality parameters that export markets typically demand.
Commercial implications of exports include foreign-exchange risk, additional documentation and regulatory compliance, and higher logistics costs. Banks treat export revenue cautiously in UHT milk plant financial projections unless backed by firm contracts or letters of intent from established buyers.
Revenue from Value-Added UHT Milk Products
Flavoured UHT products and functional beverages command higher profit margins than plain white milk. Product diversification into flavoured or fortified milks enhances profitability by allowing the plant to capture premium-seeking urban consumers. In India, flavoured UHT milk has been among the fastest-growing segments, with some estimates suggesting growth rates of 23–24% annually.
Value-added UHT milk products typically have lower volume than white milk but can deliver better contribution per litre when formulated and priced correctly. Revenue mixes can include multiple packaging formats and value-added products to serve different consumer occasions – a 200 ml flavoured carton for on-the-go consumption, a 1-litre fortified variant for health-conscious families.
However, these products involve higher costs: speciality ingredients (sugar, flavours, stabilisers, fortificants), intensified quality control, specialised aseptic packaging, and focused marketing campaigns. In DPRs, these products should be presented as part of a profitable product mix for a UHT milk plant, not as guaranteed high-margin items. Realistic volume assumptions based on local market assessment are essential.
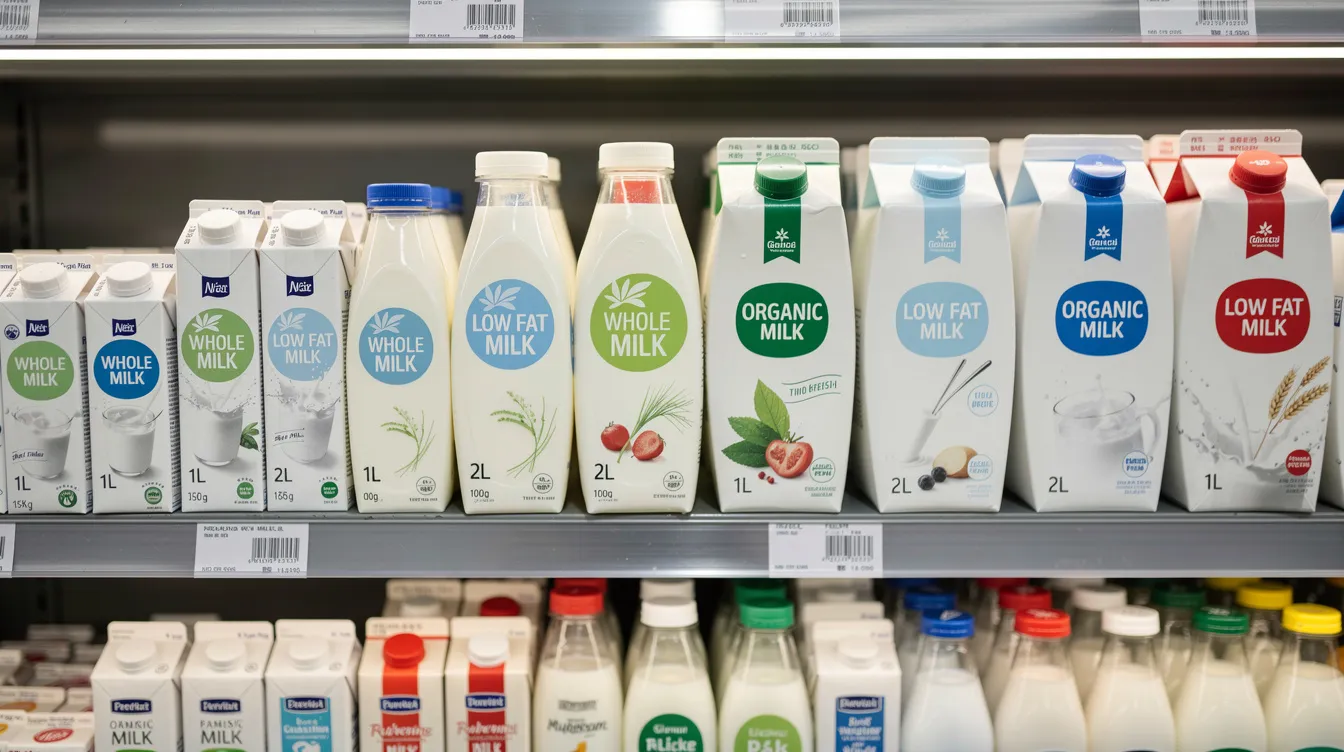
Recommended UHT Milk Product Mix for Indian Conditions
An optimal UHT milk plant product mix should align with local demand, procurement quality, brand strategy, and packaging-line capability. A UHT plant should be seen as a liquid-food processing platform, not just a milk factory, opening possibilities across multiple product categories.
- Full-cream UHT milk targets premium households and HORECA; moderate volume, higher price, available through retail and institutional channels.
- Standardised UHT milk serves the broad urban consumer base; high volume potential, moderate pricing, suitable for all channels.
- Toned UHT milk is the volume anchor in most Indian markets; high demand, mass pricing, distributed through general and modern trade.
- Double-toned UHT milk appeals to calorie-conscious consumers; moderate volume, mass pricing, mainly retail.
- Skimmed UHT milk caters to niche health-focused buyers; lower volume, moderate-to-premium pricing.
- Flavoured UHT milk (chocolate, strawberry, elaichi, etc.) targets younger demographics; growing volume, premium pricing, strong in retail and e-commerce.
- Fortified UHT milk (calcium, vitamin D, protein-enriched) addresses health-aware urban families; niche but growing, premium pricing.
- Lactose-free UHT milk serves a small but expanding niche; premium pricing, mainly urban modern retail.
- Organic or premium-positioned UHT milk (including cow milk A2 variants) targets affluent urban consumers; niche volume, high pricing, higher marketing cost.
- UHT cream can be a natural by-product of standardisation; niche volume, premium pricing, mainly HORECA and bakery.
Promoters should start with a limited, manageable range – typically 3–5 core SKUs – and expand gradually to avoid complexity, excess packaging inventory, and operational inefficiency at the initial stage of milk processing. UHT plants can also generate revenue through by-product monetisation from standardisation processes, such as selling cream or buttermilk separately. Products like UHT cream or niche milk products should only be included where the chosen line and direct versus indirect UHT milk processing technology can support them economically.
Product-Mix Comparison Table
The following table provides a qualitative comparison of major UHT milk categories across key commercial parameters to support product-mix decision-making. Values are directional rather than prescriptive.
| Product Category | Target Market | Volume Potential | Price Positioning | Marketing Requirement | Commercial Risk |
|---|---|---|---|---|---|
| Full-cream UHT milk | Premium households, HORECA | Moderate | Premium | Moderate | Moderate |
| Standardised UHT milk | Urban mass market | High | Mass-to-moderate | Moderate | Low |
| Toned UHT milk | Broad consumer base | High | Mass | Low-to-moderate | Low |
| Double-toned UHT milk | Health-conscious consumers | Moderate | Mass | Low | Low |
| Skimmed UHT milk | Diet/fitness segment | Low-to-moderate | Moderate-to-premium | Moderate | Moderate |
| Flavoured UHT milk | Youth, on-the-go consumers | Moderate-to-high | Premium | High | Moderate |
| Fortified UHT milk | Health-aware urban families | Low-to-moderate | Premium | High | Moderate-to-high |
| Lactose-free UHT milk | Lactose-intolerant consumers | Low | Premium | High | High |
| Organic/premium UHT milk | Affluent urban buyers | Low | High premium | High | High |
| UHT cream | HORECA, bakeries | Low | Premium | Low | Moderate |
This comparison helps promoters prioritise which products anchor volume and which ones enhance overall contribution per litre, forming the basis of a realistic UHT milk plant product mix.
Pack-Size Strategy and Its Impact on Revenue Realisation
Pack-size decisions significantly affect UHT milk manufacturing profit margin and market reach. Typical aseptic carton formats include 180/200 ml, 500 ml, and 1 litre for retail, with larger institutional packs where the filling line supports them.
- Smaller retail packs (180–200 ml) generally offer higher net realisation per litre because consumers pay a convenience premium. However, packaging cost per litre is substantially higher, and these packs require more machine changeovers and larger packaging-material inventory.
- The 1-litre carton is the workhorse of the Indian UHT milk market, offering a balance between consumer affordability, packaging efficiency, and distribution economics. Most volume in branded retail flows through this format.
- The 500 ml pack occupies a middle ground, useful for smaller households and trial purchases, but may not move sufficient volume to justify dedicated production runs unless demand is established.
- Institutional packs (larger than 1 litre) reduce packaging cost per litre but are used primarily for HORECA and contract supply, often at lower selling prices.
More SKUs and pack sizes mean more machine changeovers, higher packaging-material inventory, and possible line inefficiencies. Effective packaging and distribution strategies influence profitability in UHT milk processing. Proposed pack sizes must match the capability of the selected filling lines, as discussed in our guides on aseptic filling and packaging process for UHT milk and aseptic carton packaging systems for UHT milk. DPRs should contain pack-size-wise sales assumptions for each product rather than assuming all sales occur in a single format.
Sales-Channel Mix and Its Effect on Price and Cash Flow
An effective UHT milk plant revenue and cost structure depends heavily on how volumes are divided among different channels. Each channel delivers distinct economics.
| Sales Channel | Illustrative Volume Share | Relative Price Realisation | Marketing Cost | Avg. Credit Period | Key Risk |
|---|---|---|---|---|---|
| General trade | 25–35% | Moderate | Moderate | 7–15 days | Fragmented, scheme-intensive |
| Modern retail | 15–20% | Moderate-to-high | High (listing fees, schemes) | 30–45 days | Margin pressure, returns |
| E-commerce / quick commerce | 5–10% | High | High (platform commissions) | 15–30 days | Discounting, logistics cost |
| Institutional / HORECA | 15–25% | Low-to-moderate | Low | 30–60 days | Credit risk, price sensitivity |
| Private-label / contract | 10–15% | Low | Minimal | 30–45 days | Customer concentration |
| Government / cooperative | 0–5% | Low | Minimal | 45–90 days | Payment delays, tenders |
| Export | 0–5% | Variable | Moderate | LC-based or advance | Forex risk, compliance |
For many Indian UHT milk plants, a balanced mix of branded retail and institutional or private-label volumes can stabilise cash flows and equipment utilisation. Channel-mix assumptions must be explicitly stated in any UHT milk plant financial projections or UHT milk project report for bank loan appraisal.
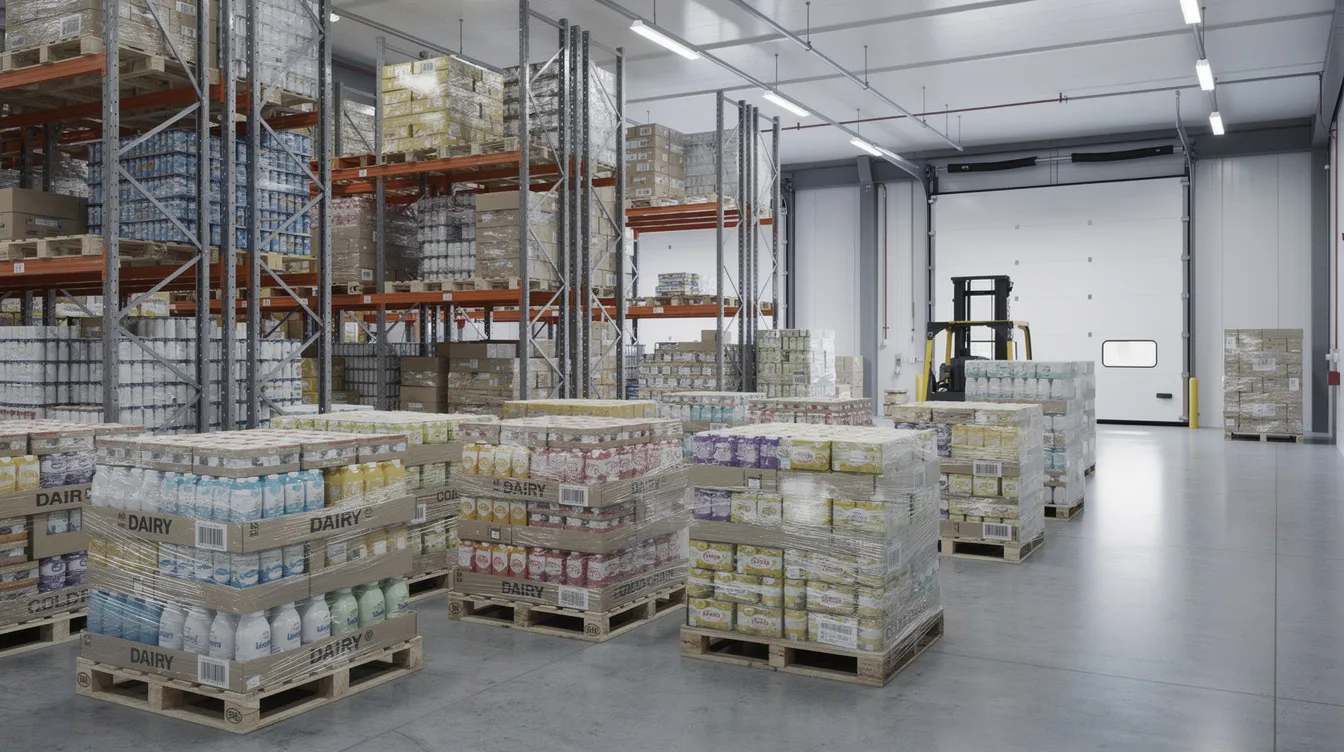
Capacity Utilisation and Revenue Ramp-Up Plan
A new UHT milk plant rarely reaches full capacity in its first year. New plant investments should focus on capacity utilisation to prevent financial losses during the ramp-up phase. Initial operating costs are projected to be significant in year one, when production volumes are low but fixed costs – salaries, depreciation, interest – are fully incurred. A UHT plant can process large volumes of milk every day to lower fixed costs per carton, but only once procurement, distribution, and brand awareness reach adequate levels.
Practical factors affecting ramp-up include milk procurement stability across seasons, onboarding of distributors and modern-trade accounts, obtaining institutional contracts, working-capital availability, and the pace of brand-building in target markets. Throughput of the aseptic filling line often becomes the bottleneck; for line-balancing considerations, refer to UHT milk plant capacity planning and line balancing.
As an indicative example (not a universal benchmark): a plant might operate at 40–45% utilisation in Year 1, 55–60% in Year 2, 65–70% in Year 3, and 75–85% from Year 4 onward. Total operational costs are expected to increase by year five as volume grows, but per-litre cost falls with scale. Lenders look for realistic utilisation assumptions supported by marketing and procurement plans, not aggressive 90–100% utilisation from the start.
Illustrative Product-Mix Model and Revenue Contribution
This section presents a purely illustrative example of how a UHT milk plant might allocate saleable capacity. This model is not a recommendation for every project.
- Toned and standardised UHT milk: 50% of saleable volume. These are high-volume, moderate-margin anchors providing stable demand and predictable cash flow.
- Full-cream UHT milk: 15% of volume. Slightly higher realisation per litre, serving premium retail and HORECA segments.
- Flavoured UHT milk: 20% of volume. Higher price positioning with better contribution per litre, though with higher ingredient and marketing costs.
- Institutional and private-label supply: 15% of volume. Lower net realisation but minimal marketing spend and better utilisation of available capacity.
Shifting the product mix towards higher-value SKUs increases revenue per litre but may constrain total volumes, raise marketing costs, and add inventory complexity. Promoters must conduct their own feasibility study and market assessment before finalising the mix. Such illustrative models are typically included in a detailed project report to showcase the logic of the proposed profitability structure.
Pricing Structure and Net Sales Realisation
Understanding the hierarchy of prices is critical for any UHT milk plant financial analysis:
- MRP is the maximum retail price printed on the pack. It is not the price the manufacturer receives.
- The distributor price is typically 80–90% of MRP, depending on the product and channel.
- Institutional selling price may range from 75–85% of MRP due to bulk volumes and absence of retail margins.
- Ex-factory realisation is what the plant retains after deducting all trade margins, promotional schemes, freight, returns, and damages.
For a typical branded retail UHT milk SKU, the journey from MRP to ex-factory realisation involves deducting retailer margin (8–12%), distributor margin (3–5%), trade schemes (2–4%), freight and handling (3–5%), and returns or damages (0.5–1%). The resulting net realisation may be 70–80% of MRP. DPRs and CMA data for UHT milk projects must use this realistic net realisation rather than simply applying MRP to projected volumes. Institutional and private-label pricing involves lower per-litre price but fewer marketing deductions.
Major Cost Drivers and Their Impact on Product-Wise Profitability
UHT milk manufacturing profit margin depends not only on selling price but equally on cost control. Raw milk accounts for 70–80% of UHT plant operating expenses, making procurement cost the single most influential variable. Sourcing raw milk direct from farmers can minimise costs and stabilise prices compared to buying through intermediaries.
Key cost heads include:
- Raw milk procurement and standardisation losses (fat/SNF adjustment)
- Speciality ingredients for flavoured, fortified, or lactose-free products
- Aseptic packaging materials, which represent a major ongoing operational expense (Tetra Pak or equivalent cartons, closures, barrier films)
- Utilities: UHT processing is energy-intensive, requiring high thermal energy for processing, along with substantial power, water, and compressed air consumption, as detailed in UHT milk plant utilities requirements
- Cleaning-in-place chemicals, quality testing, and labour
- Distribution, freight, distributor and retailer margins, and marketing expenditure
- Expected returns, damages, and expiry-related losses
Fixed-cost elements include salaries, maintenance, interest, and depreciation. UHT processing lines involve high capital expenditure for sterilisers and packaging machinery, and machinery costs are the largest portion of capital expenditure in most projects. For broader capex and finance context, refer to UHT milk plant project cost and means of finance. A higher-MRP or premium UHT milk product is not automatically the most profitable if ingredient, packaging, or marketing costs are disproportionately high.
Product-Wise Contribution and Break-Even Analysis
Contribution is defined as net sales revenue minus variable costs. This metric is vital when multiple UHT milk products share the same processing and packaging facilities.
Promoters should compare contribution per litre, contribution per pack, and contribution per machine hour across different SKUs. For example, toned UHT milk may deliver a lower contribution per litre than flavoured UHT milk, but its higher volume throughput and faster machine speed could yield a comparable or superior contribution per machine hour.
The break-even volume for the plant represents the production and sales level at which total revenues cover all costs – variable and fixed. Introducing select higher-contribution SKUs can help achieve break-even earlier, but only if the market absorbs those volumes at the assumed price. UHT milk processing plants typically achieve gross profit margins of 25–35% at steady-state operations, though this varies significantly by product mix, scale, and cost structure. A robust financial analysis for bank loans should present product-wise contribution margins and overall break-even analysis, stress-tested against changes in raw milk price, packaging cost, and selling price.
Working-Capital Implications of the Chosen Product Mix
UHT milk’s longer shelf life reduces immediate wastage risk compared to fresh liquid milk, but it does not eliminate the need for disciplined working-capital management. Losses during processing and distribution can erode margins in UHT milk production if not controlled.
A broad product and pack-size portfolio increases inventory of raw materials, packaging material, flavours, fortificants, and finished goods. Each additional SKU requires dedicated packaging stock, potentially different closure types, and separate finished-goods inventory. The cash-conversion cycle lengthens when the plant serves institutional and private-label clients with 30–60 day credit terms alongside retail distributors expecting regular trade schemes.
Product-mix planning should be aligned with realistic assessment of inventory levels, receivable days, and available working capital limits. A bankable UHT milk project report for bank loan purposes will typically include month-wise working-capital calculations reflecting the selected product and channel mix. Investing in plant efficiency and maintenance improves throughput and margins, which in turn eases working-capital pressure.
Key Profitability Drivers in a UHT Milk Manufacturing Business
The main profitability levers in a UHT milk manufacturing business are raw milk procurement price and quality (fat/SNF levels and rejection rates), milk solids recovery during standardisation, capacity utilisation, product mix, pack-size mix, and sales-channel mix. Even a small dairy plant processing 5,000–10,000 litres daily (costing INR 80 lakh to 1.5 crore in initial setup) can achieve reasonable operational efficiency if these drivers are managed well.
Packaging cost is a critical lever. Negotiating favourable long-term rates with carton suppliers, minimising changeover losses, and reducing packaging waste can meaningfully influence aseptic milk packaging profitability. Other important drivers include reduction in processing losses, optimisation of utilities and energy requirements, and disciplined maintenance practices.
No universal UHT milk manufacturing profit margin in India can be quoted. Margins must be calculated project-wise based on realistic, location-specific data. Promoters should use sensitivity scenarios within the DPR to understand how changes in key drivers affect profitability, payback period, and debt-servicing ability. Financial projections should include ROI and net present value analysis to give lenders a comprehensive view.
Risk and Sensitivity Analysis for the UHT Milk Plant Revenue Model
Lenders and investors expect to see how sensitive the UHT milk plant revenue model is to changes in crucial assumptions. The key risk factors include raw milk price volatility, packaging-material inflation, changes in realised selling price, product-mix shifts, capacity utilisation shortfalls, distributor margin pressures, and working-capital cycle disruptions.
| Variable | Change Direction | Impact on Revenue | Impact on Contribution | Impact on Cash Flow |
|---|---|---|---|---|
| Raw milk price | ↑ Increase | Neutral | ↓ Decrease | ↓ Decrease |
| Packaging cost | ↑ Increase | Neutral | ↓ Decrease | ↓ Decrease |
| Selling price / realisation | ↓ Decrease | ↓ Decrease | ↓ Decrease | ↓ Decrease |
| Capacity utilisation | ↓ Decrease | ↓ Decrease | ↓ Decrease | ↓ Decrease |
| Share of value-added products | ↑ Increase | ↑ Increase | ↑ Increase (if demand exists) | Variable |
| Distributor margins | ↑ Increase | Neutral | ↓ Decrease | ↓ Decrease |
| Production / packaging losses | ↑ Increase | ↓ Decrease | ↓ Decrease | ↓ Decrease |
| Credit period to buyers | ↑ Increase | Neutral | Neutral | ↓ Decrease |
Quality-related risks such as high returns or reduced shelf life due to process failures can severely impact margins; these are discussed in detail in our UHT milk quality control and shelf-life testing guide. Such sensitivity analysis helps promoters and bankers understand the robustness of the UHT milk manufacturing business under adverse conditions, ensuring that the project is not built on a single optimistic scenario.
Information Checklist Required to Prepare a Bankable Revenue Model
This checklist can be directly used while compiling inputs for a DPR or financial projection:
- Installed UHT milk processing capacity (litres/day) and planned operating days per year
- Aseptic filling-line speed, format capability, and changeover time
- Expected product mix by percentage allocation (toned, full-cream, flavoured, etc.)
- Proposed pack sizes for each product and their volume share
- Intended sales-channel mix (general trade, modern retail, institutional, private-label, export)
- Anticipated selling prices by product and channel, with documented basis
- Distributor and retailer margin structure, expected promotional schemes, and freight policy
- Likely credit periods for each channel and buyer category
- Expected raw milk procurement rates, typical composition (fat/SNF), and seasonal variation
- Packaging material cost per pack type (carton, closure, straw, outer packaging)
- Utility tariffs (power, steam, water, compressed air), labour cost, and maintenance estimates
- Anticipated process and packaging losses
- Capacity-utilisation schedule over 3–5 years with supporting rationale
- Marketing-budget estimates differentiated by product line
- Inventory norms and receivable-day assumptions
Role of the Revenue Model in a Bankable Detailed Project Report (DPR)
From the viewpoint of a practising Chartered Accountant, the UHT milk plant revenue model is central to the DPR and directly influences bankers’ appraisal of project viability. Lenders assess whether projected sales volumes are reasonable in relation to installed capacity, availability of raw milk in the procurement area, competitive landscape in target markets, and the promoter’s business requirements and track record.
Bankers examine product-wise pricing assumptions, distribution arrangements, gross and net margins, working-capital needs, break-even level, and the even analysis of debt-servicing capability before making a credit decision. Government programs support dairy businesses with reduced costs and approvals, but regulatory compliance is equally critical. Dairy plants in India require three essential licenses – FSSAI registration, Factories Act license, and Pollution Control Board NOC – and regulatory approvals include environmental clearances and industrial permits. UHT milk processing requires adherence to specific regulatory standards, and compliance ensures safety standards and consumer expectations are met.
Overly aggressive projections without supporting evidence (MOUs, market studies, research reports, or past track record) may weaken DPR credibility, even if the plant setup and manufacturing process technology are sound. At ProjectReportBank.com, financial projections are prepared and reviewed using reasonable assumptions, not presented as guaranteed outcomes.
Common Mistakes to Avoid in UHT Milk Plant Revenue Planning
Based on my review of numerous UHT milk project reports, these are the most frequent errors:
- Treating MRP as net sales realisation, inflating projected revenue by 15–25%
- Assuming near-100% capacity utilisation from Day 1, ignoring the reality of gradual market development
- Ignoring distributor and retailer margins, which collectively consume 10–18% of MRP
- Underestimating aseptic packaging costs, particularly when using Tetra Pak or equivalent multilayer cartons
- Launching too many SKUs initially, creating excessive packaging inventory and changeover losses
- Not accounting for line changeover time and production losses during format changes
- Using identical margins for every product when flavoured and fortified variants have different cost structures
- Overestimating demand for premium or niche UHT products in markets where consumer awareness is still developing
- Neglecting sales returns, scheme costs, and promotional expenditure in revenue calculations
- Projecting unsupported export revenue without confirmed buyers or destination-country analysis
- Using unrealistic selling-price escalation assumptions across the forecast period
- Ignoring working-capital demands of a complex product portfolio
Promoters should have their revenue model independently reviewed before finalising financial closure to avoid these pitfalls. A feasibility report or location analysis that does not account for these realities is incomplete.
Professional Perspective of CA Manish Gugliya on UHT Milk Revenue Models
In more than 20 years of preparing DPRs and financial models for dairy processing and milk processing plant projects, I have observed that the most successful projects are those where procurement capacity, processing capacity, packaging-line capability, product mix, sales channels, working capital, and loan repayment obligations are woven into one coherent revenue and cash-flow model. When any one element is disconnected – say, an ambitious product mix without matching distribution strength, or aggressive utilisation assumptions without confirmed milk supply – the entire projection becomes fragile.
In practice, projects that build a strong base in core UHT milk products (toned and standardised white milk in 1-litre and 200 ml packs) first, and then gradually expand into value-added UHT milk products once volumes and distribution are stabilised, tend to achieve long-term success and financial stability. The UHT milk industry in India is evolving rapidly, and industry trends point towards premiumisation and dairy development in tier-2 and tier-3 cities. But rapid expansion without operational readiness can strain cash flows and jeopardise the project.
Those interested in deeper insights on investment, machinery, environmental impact considerations, or unit operations for UHT milk plants can refer to our internal guides on setup cost, equipment, and process. This article should be used specifically for revenue-model and product-mix planning – arguably the most critical component of any feasibility study or business plan for a UHT milk manufacturing business.
Frequently Asked Questions (FAQs)
The following FAQs address practical doubts not fully covered in the main sections, focusing on the revenue model, product mix, and financial planning for a UHT milk plant.
What are the main revenue sources for a UHT milk plant in India?
The key sources are branded retail sales of white and flavoured UHT milk through general trade and modern retail, institutional and HORECA supplies, private-label or contract manufacturing for established brands and retail chains, selective export sales where commercially feasible, and revenue from value-added UHT milk products such as fortified, lactose-free, or organic variants. Some plants also earn from by-products like cream or whipped butter recovered during standardisation. Additionally, whey protein and other components may offer investment opportunities where the plant configuration supports dairy products beyond UHT milk.
How should a new UHT milk plant decide its initial product mix?
Promoters should start with a limited range of high-demand SKUs – typically toned or standardised UHT milk in 1-litre and 200 ml packs – validate actual sales response over the first 6–12 months, and then gradually introduce premium or niche variants. Launching a very wide portfolio on Day 1 increases packaging inventory of raw materials, changeover losses, and working-capital strain without proportional revenue benefit. Industry performance data suggests that stable demand products should form the foundation before diversifying.
Does a higher MRP always mean a higher profit margin for UHT milk?
Not necessarily. Higher-MRP products such as flavoured, fortified, or organic UHT milk involve higher ingredient costs, specialised packaging, additional quality testing, and focused marketing. The contribution per litre must be evaluated after accounting for all variable costs. In some cases, a high-volume toned UHT milk SKU with modest margins can generate more total contribution than a premium product with limited sales. The key success factor is matching the product with proven demand in your target markets.
What information should I share with my Chartered Accountant to build a robust UHT milk revenue model?
Share the following: planned processing capacity and operating days, identified target markets and sales channels, proposed product and pack-size mix with approximate percentage allocation, indicative selling prices and expected trade margins, raw milk procurement arrangements and prevailing prices, aseptic packaging and utility cost estimates, marketing budget, expected credit terms with buyers and suppliers, and any confirmed offtake commitments. This data, combined with a realistic capacity-utilisation schedule, allows preparation of credible UHT milk plant financial projections. A production process overview and details of land required and plant layout are also helpful for the broader feasibility study.
How do banks assess the revenue assumptions of a UHT milk project?
Banks evaluate whether projected volumes are achievable given the installed capacity, milk production in the procurement area, and competitive landscape. They scrutinise selling-price assumptions against prevailing market rates, verify that margins are realistic after trade deductions, assess working-capital adequacy, and check whether break-even and debt-service coverage ratios are met under base-case and stress scenarios. Revenue projections not supported by market studies, MOUs, or promoter track record are treated with caution. Financial assistance decisions depend on the overall quality and credibility of the DPR, not just on the size of the projected revenue. UHT milk plants in developing countries including India benefit from high demand for shelf-stable dairy products, but the forecast period assumptions must be grounded in evidence, not aspiration. Banks also consider whether vegetable oil or non-milk solids are used in formulations, as this affects product classification and consumer trust. Mammary glands produce milk with specific fat globules and composition, and the quality of sourced milk – whether from cow milk or buffalo milk – directly affects UHT milk production economics and final product positioning for human consumption. The middle east and other export regions may require specific documentation. A well-prepared business plan with financial assistance requirements clearly laid out improves the probability of favourable appraisal.
Conclusion: Building a Practical, Bankable UHT Milk Plant Revenue Model
A successful UHT milk plant revenue model integrates realistic saleable volumes, net price realisation, a carefully chosen product mix, efficient pack-size strategy, and disciplined cost and working-capital management into one coherent framework. Plant capacity and sophisticated machinery alone do not guarantee UHT milk plant profitability; sustainable results come from sound commercial planning, continuous monitoring of contribution margins, and responsiveness to total cost dynamics and market feedback.
Project promoters, dairy companies, and investors should treat the revenue model as a living document – revisited regularly as market conditions, industry trends, milk powder pricing, and procurement economics evolve. The revenue model is not a one-time exercise for financial closure; it is the ongoing compass for operational and strategic decisions.
If you are planning a UHT milk processing plant and need a customised project report, DPR, CMA data, or financial projections tailored to your specific plant size, product mix, and financing plan, I invite you to consult with me at ProjectReportBank.com. With over 20 years of experience in preparing bankable project reports for the dairy industry and other industrial sectors, my practice focuses on realistic, credible financial models that serve both promoters and lenders. No guarantee of loan approval or assured profits is implied – outcomes depend on execution, market conditions, and commercial discipline.