Key Takeaways
- This article provides a concrete, India-focused investor ready DPR checklist for equity funding, drawing on practical CA-led project finance experience across manufacturing and MSME projects.
- An investor-ready detailed project report (DPR) differs significantly from a bank loan DPR in its focus on scalability, equity IRR, valuation, governance and exit strategy-not just debt repayment and collateral.
- The 18 essential sections cover promoter credentials, market demand, operations, project cost, means of finance, financial projections, business valuation, risk assessment and investor exit.
- Serious equity investors scrutinise assumptions, cash flow, IRR, governance and due diligence readiness before committing capital-optimistic projections without evidence will not suffice.
- Project Report Bank, led by CA Manish Gugliya (FCA, DISA), offers professional investor-ready DPR preparation and fundraising assistance for Indian manufacturing, processing and MSME projects.
Introduction: Why Many Good Projects Still Fail to Attract Equity Investors
Many technically sound and potentially profitable projects in India struggle to attract equity funding. The business idea may be commercially sensible, the demand may exist, and the promoter may have relevant experience-yet potential investors decline or disengage during discussions.
The reason is straightforward. Investors evaluate more than an idea. They assess market demand, execution capability, unit economics, cash flow generation, governance, risk and the path to exit. A detailed project report assesses project viability, but if it is prepared only for a bank loan-focused on collateral, DSCR and repayment schedules-it rarely addresses what equity investors need. Key components of an investor-ready DPR include market analysis, financial projections, and a risk mitigation strategy, presented with clarity rather than jargon.
An investor-ready DPR should prioritise clarity over jargon to effectively convey information to potential investors. It is a structured financial roadmap that helps promoters present evidence-supported investment opportunities-covering everything from market research and technical feasibility to valuation and exit.
This article walks through 18 essential sections of an investor ready DPR for equity funding in India. Whether you are planning a new manufacturing project, expanding capacity, or seeking growth capital for an existing business, this checklist should help you understand what investors expect and where most DPRs fall short.
Section 1: Executive Summary and Investment Opportunity
An executive summary is critical as it provides a high-level overview of the project to investors. Many investment committees decide whether to read the full report based on this section alone.
A well-structured executive summary should cover:
- Business concept, product overview and project stage (idea, under construction, operational)
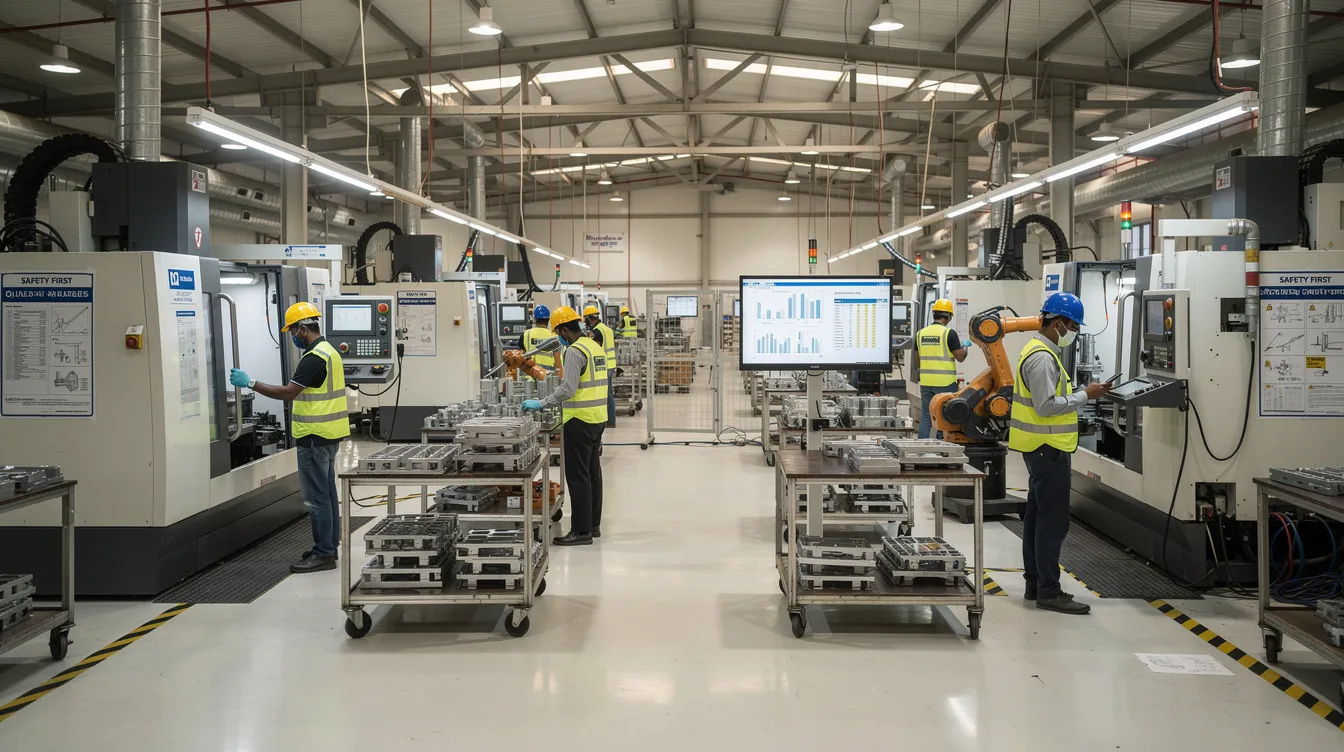
- Plant location, proposed capacity and key technology
- Total project cost and funding plan-equity sought, ticket size, broad pre-money valuation
- Use-of-funds split: CAPEX, working capital, growth expenditure
- Projected revenue by Year 5, target EBITDA margin range and break-even timeline
- Competitive advantage: market gap, demand drivers, cost advantage, policy tailwinds
- Expected outcomes for investors: return potential and broad exit routes (strategic sale, secondary sale, IPO possibility)
Avoid vague funding requests, unrealistic revenue jumps, or excessive jargon. The investment thesis should be clear enough for someone unfamiliar with your sector to understand what you are building, why it can succeed, and what returns are plausible.
For a deeper understanding of evaluation criteria, read about what equity investors look for before investing.
Section 2: Company Profile and Promoter Background
Investors back people first. In manufacturing and MSME projects, the promoter’s execution track record is often the single most important factor in the investment decision. Identifying key promoters and their expertise enhances credibility in the management section of a DPR.
This section should present:
- Legal structure (Pvt Ltd, LLP, partnership), CIN, incorporation date and registered office
- Shareholding pattern with a pre-money cap table showing promoters, family members and any existing investors
- Promoter qualifications, sector experience, prior projects and key achievements
- Management team profiles: plant head, finance in-charge, marketing lead, technical head-with brief bios
- Promoter contribution to date: land purchased, machinery advance, own funds already invested
- Corporate governance practices: board structure, statutory compliance status, business registrations, internal controls
Red flags include weak financial discipline, frequent legal disputes, unclear shareholding, unexplained related-party dealings and absence of a proper statutory audit trail. Investors will verify these during due diligence-an unclean company profile can end discussions immediately.
Section 3: Business Concept and Project Overview
Distinguish clearly between a greenfield project, capacity expansion, forward or backward integration, and technology upgrade. Each has different risk profiles and capital requirements.
Cover:
- Detailed product descriptions, specifications, end-use applications and target segments
- Project objectives: capturing a demand gap, import substitution, export-oriented growth, diversification
- Proposed capacity (tonnes per annum, units per month) and phased ramp-up over 3–5 years
- Operating model: in-house manufacturing vs contract manufacturing, B2B vs B2C, distributor-led vs direct
- Present status: land acquired, approvals applied or received, machinery quotations obtained, pilot trials completed, MOUs with buyers or suppliers
For new plants, understanding the funding landscape is important-see equity funding for new manufacturing projects in India. For brownfield projects involving debottlenecking or additional lines, equity funding for business and manufacturing expansion covers relevant considerations.
Section 4: Industry Outlook and Market Demand
This section forms the evidence base behind revenue projections. A DPR must include a detailed market analysis and industry research, yet many promoters rely on generic national reports without connecting them to their specific project. Market validation requires credible evidence that supports demand for the project being proposed in the DPR. Market analysis should confirm product-market fit and assess market size and competition.
Include:
- Industry size estimates (India and global) from government reports, industry associations and credible secondary sources
- Demand drivers: demographics, urbanisation, PLI schemes, downstream industry growth, import substitution
- Target customer profiles: OEMs, institutional buyers, export houses, with geographic focus
- Serviceable addressable market-not just total addressable market (TAM) buzzwords
- Demand-supply gap commentary: local supply constraints, logistics advantages, quality differentiators
- Pricing context: current market price range, recent trends and key sensitivity factors
- Primary validation: sample purchase orders, letters of intent, pilot orders, customer feedback
Overly optimistic CAGR assumptions drawn from national-level reports without local demand evidence are a frequent credibility risk. For more on how investors evaluate market demand, revenue traction and scalability, this resource provides practical context.
Section 5: Competitive Landscape and Market Positioning
Investors always ask: who else is doing this and why will you win? A DPR includes market analysis and operational workflow details, but the competitive section is where claims must be backed with evidence.
- Profile 3–5 competitors (organised and unorganised) with scale, geography and positioning
- Map competition by price band, quality, technology, distribution reach and customer relationships
- State your competitive advantage clearly: cost, technology, quality, location, speed, customisation
- Describe customer acquisition channels: direct sales, distributors, OEM tie-ups, tendering
- Cover barriers to entry: capital intensity, approval cycles, technology access, certifications
Never claim “no competition.” Investors treat that as a red flag. Show realistic but ambitious targets and explain why your positioning is defensible. A well-structured SWOT analysis can help frame this discussion.
Section 6: Business Model and Revenue Strategy
Investors want to understand unit economics and revenue visibility-not only total sales numbers. Investors assess business models for scalability and profitability, so this section must demonstrate how the business generates and grows revenue.
- Revenue streams: core product sales, by-products, job work, service income
- Pricing model: per-unit pricing, volume slabs, long-term contracts vs spot sales, export vs domestic
- Capacity utilisation assumptions: e.g., 50% in Year 1, 65% in Year 2, 75%+ by Year 3
- Gross contribution margins after variable costs
Illustrative Revenue Calculation (Illustrative Only)
| Parameter | Value |
|---|---|
| Installed capacity | 12,000 TPA |
| Year 3 utilisation | 75% |
| Effective production | 9,000 tonnes |
| Realisation per tonne | ₹1,20,000 |
| Projected Year 3 revenue | ₹108 crore |
Highlight customer concentration risk-what share of revenue comes from the top 5 customers. Integrated financial projections for equity investors are covered in detail in Section 12.
Section 7: Technical Feasibility and Manufacturing Operations
Investors verify whether production plans and cost assumptions are technically achievable. A detailed project report should demonstrate technical feasibility, financial viability, and legal compliance.
- Manufacturing technology: continuous vs batch, automation level, imported vs indigenous machinery
- Production process flow: raw material receipt through finished goods dispatch
- Key machinery with supplier names and quotation dates
- Installed capacity, realistic operating capacity, yield percentage, wastage rates
- Raw material sourcing: regions, supplier concentration, price volatility, contract strategies
- Utilities: power load, DG backup, water, compressed air, fuel-and cost per unit
- Quality certifications targeted: ISO, BIS, FSSAI, customer-specific audits
Technical risk is real. Investors often engage independent experts to validate machinery specifications and process flows. For a comprehensive assessment approach, consider project feasibility study services.
Section 8: Project Location, Infrastructure and Implementation
Plant location and execution timelines directly affect project risk and returns. A regulatory and compliance framework in a DPR includes required licenses, permits, and statutory approvals.
- Land details: location (state, district), size, ownership or lease status, title clarity
- Plant layout: logical material flow, safety provisions, future expansion allowance
- Infrastructure: road connectivity, port proximity, skilled labour availability
- Utilities: power connection status, water source, effluent treatment arrangements
- Statutory approvals: pollution NOC, factory licence, fire approval, building plan-and current status
- Implementation schedule: land development through commercial operation date, with quarter-wise milestones
The implementation timeline in a DPR should use tools like Gantt charts to map project milestones. Delays in commissioning increase project cost, inflate interest during construction and can significantly reduce investor IRR.
Section 9: Total Project Cost and Capital Requirements
Project cost estimation must distinguish between capital expenditure (CAPEX), preliminary and pre-operative expenses, and working capital margin. Project finance is suitable for capital-intensive undertakings, and underestimation is a common investor red flag.
Illustrative Project Cost (Illustrative Only – Not an Actual Project Cost)
| Cost Head | ₹ Crore |
|---|---|
| Land & site development | 2.00 |
| Building & civil works | 4.00 |
| Plant & machinery | 10.50 |
| Electricals & utilities | 1.50 |
| Furniture, vehicles & misc. | 0.50 |
| Preliminary & pre-operative expenses | 1.00 |
| Interest during construction | 0.75 |
| Contingency | 1.25 |
| Working capital margin | 3.50 |
| Total project cost | 25.00 |
Every line item should be backed by quotations, civil estimates or clearly stated assumptions. Arbitrary round numbers without basis weaken credibility.

Section 10: Means of Finance and Proposed Equity Funding
Investors check whether the funding plan is realistic, balanced and aligned with projected cash flows. Project finance relies on project cash flow for repayment. Project financing often involves multiple stakeholders for large projects, and zero or limited recourse financing is common in project finance structures.
Illustrative Means of Finance (Illustrative Only)
| Source | ₹ Crore | % |
|---|---|---|
| Promoter equity | 7.00 | 28% |
| External equity | 8.00 | 32% |
| Bank term loan | 10.00 | 40% |
| Total | 25.00 | 100% |
Map timing of drawdowns across the construction and ramp-up phases. Liquidity gaps during implementation are a serious risk. To understand how much equity funding a business should raise, promoters must balance dilution against growth capital needs. Over-leverage or vague “future investor” assumptions are red flags for any serious investor.
Section 11: Historical Financial Performance and Business Traction
For existing companies, this section is critical. Include audited profit and loss statements (and loss statements where applicable), balance sheet and cash flow statement for the last 3–5 years.
Key metrics investors examine:
- Revenue CAGR and EBITDA margin trends
- Working capital cycle: receivable days, inventory days, payable days
- Existing borrowings, repayment track record and loan requirement history
- Non-financial traction: active customers, order book, repeat business, capacity utilisation
For greenfield or pre-revenue projects, present alternative evidence: pilot sales, sample orders, promoter’s related-business track record, or anchor customer discussions. Investors will verify the financial health of the entity during due diligence-unaudited or inconsistent numbers destroy confidence.
Section 12: Financial Projections and Key Assumptions
Integrated financial projections are central to an investor-ready DPR. A DPR outlines business plans and financial projections, and these must be internally consistent. Financial projections include revenue, expenses, and cash flow forecasts. Financial models typically forecast 3–5 years into the future, though some projects warrant 7-year projections depending on ramp-up timelines. Investors require financial forecasts for 3-5 years.
Projections must include:
- Revenue by product line, capacity utilisation and selling prices
- Raw material costs, power, employee costs, other operating expenses
- Year-wise EBITDA, depreciation, interest, taxation and PAT
- Projected balance sheet reconciling with the funding plan and fixed-asset schedule
- Projected cash flow statement showing operating, investing and financing flows
- A bank-compliant DPR includes a projected cash flow statement; an investor DPR must go further with free cash flow analysis
The DPR should reconcile project costs, funding sources, and returns in its financial model for transparency. All key assumptions-inflation, price escalation, credit terms, inventory norms, tax rates-must be explicitly documented. Projections help demonstrate a business’s ability to repay loans and generate investor returns.
For robust model-building, professional financial projections and financial modelling services can ensure consistency.
Section 13: Profitability, Cash Flow and Working Capital
Accounting profit is not the same as cash. A detailed project report must include projected profitability statements, but investors focus equally on cash conversion.
- Projected gross margins, EBITDA margins and net profit margins over the forecast period
- Working capital cycle: receivable days, inventory days, payable days-and how they affect cash requirements
- Break-even analysis shows when a project becomes profitable; compute break-even volume and revenue, with estimated timeline
- Free cash flow: cash generated after CAPEX and working capital, relevant for dividends, debt repayment and investor returns
- MPBF (Maximum Permissible Bank Finance) determines maximum working capital loan eligibility for the debt portion
Common risks include aggressive credit terms to buyers, dependence on one or two large customers, and underestimation of seasonal inventory build-up. Present this section as a concise narrative with a compact summary table, not raw model printouts.
Section 14: Project IRR, Equity IRR and Investment Returns
IRR (Internal Rate of Return) is the discount rate at which the present value of future cash flows equals the initial investment. The DPR should compute both Project IRR (returns to all capital providers) and Equity IRR (returns specifically to equity investors after debt servicing).
Illustrative IRR Calculation (Illustrative Only)
| Year | Project Cash Flow (₹ Cr) | Equity Cash Flow (₹ Cr) |
|---|---|---|
| 0 | (25.00) | (15.00) |
| 1 | 2.50 | 0.80 |
| 2 | 5.00 | 2.50 |
| 3 | 7.50 | 4.80 |
| 4 | 8.50 | 5.80 |
| 5 | 9.00 + Terminal | 6.50 + Terminal |
| Project IRR | ~18-20% | |
| Equity IRR | ~22-26% |
For a detailed explanation of the difference between Project IRR and Equity IRR, this resource provides practical context.
IRR is a model output based on assumptions, not a guaranteed return. Investors stress-test these numbers under multiple scenarios. Overly high IRR figures (40–50%) with a modest risk story are a credibility red flag for sophisticated investors.
Section 15: Business Valuation and Proposed Equity Dilution
This section bridges financial projections and actual deal terms. Explain pre-money valuation (value before new investment) and post-money valuation (value after adding new capital).
Illustrative Valuation (Illustrative Only)
| Parameter | Value |
|---|---|
| Pre-money valuation | ₹40 crore |
| Proposed equity investment | ₹10 crore |
| Post-money valuation | ₹50 crore |
| Investor ownership | 20% |
Valuation is ultimately a negotiation outcome influenced by risk, growth potential, governance rights and market conditions. General manufacturing SMEs with ₹10–50 crore revenue often receive 4–6× EBITDA multiples, while specialty or export-oriented businesses may command 5–8× or higher.
Aggressive valuation expectations without evidence-backed projections and traction can deter serious investors. Unlisted companies typically face a 20–30% discount compared to listed peers.
For a structured approach, professional business valuation services in India can help establish defensible valuations.
Section 16: Funding Utilisation and Growth Milestones
Investors want clear capital allocation plans for their funds-not vague “general corporate purposes” buckets. Present a clear plan of where the money goes and what milestones it achieves.
- Use-of-funds statement: CAPEX (machinery, building), working capital, marketing, technology, contingency
- Milestone-based deployment: percentage of funds until commissioning, until 60–70% capacity stabilisation, for market expansion
- Periodic financial and operational reporting obligations
| Milestone | Timeline | Fund Allocation (₹ Cr) |
|---|---|---|
| Plant commissioning | Month 12 | 5.00 |
| 60% capacity utilisation | Month 18 | 1.50 |
| Export market entry | Month 24 | 1.00 |
| Contingency & WC buffer | Ongoing | 0.50 |
Underbudgeted marketing or inadequate working capital provisions signal poor financial planning.
Section 17: Risk Assessment and Sensitivity Analysis
A credible investor ready DPR openly acknowledges risks and shows how the project behaves under stress. Risk analysis in a DPR involves identifying operational, market, regulatory, and financial risks. A risk management strategy helps in quantifying significant risks and preparing mitigation plans.
Key risk categories: market and demand risk, execution delays, raw material price volatility, regulatory changes, customer concentration, environmental and ESG issues.
Illustrative Sensitivity Analysis (Illustrative Only)
| Scenario | Change | Impact on EBITDA | Impact on Equity IRR |
|---|---|---|---|
| Base case | – | ₹12.0 Cr | 24% |
| Volume -10% | Lower demand | ₹9.8 Cr | 19% |
| RM cost +5% | Price volatility | ₹10.5 Cr | 21% |
| 6-month delay | Commissioning | ₹11.0 Cr (Year 1 lower) | 18% |
Mitigating measures-diversified sourcing, long-term supply contracts, conservative gearing, phased capacity addition-should be discussed for each major risk. Absence of downside analysis reduces investor confidence and may slow due diligence processing time.
Section 18: Investor Exit Strategy, Governance and Due Diligence Readiness
A clear exit strategy is necessary to explain how investors can realize returns on their investment. Exit scenarios are possibilities, not promises of fixed returns.
Typical exit routes include:
- Strategic sale to a larger industrial player (domestic or multinational)
- Secondary share sale to another investor
- Promoter buyback (subject to Companies Act and contractual terms)
- IPO, where scale and compliance allow-not an assumed certainty
According to Deloitte’s PE India analysis, exit values in the industrial sector rose nearly four-fold from 2024 to 2025, indicating viable exit opportunities for strong manufacturing businesses.
A well-prepared data room enhances investor confidence. Governance readiness includes board composition, information rights, audit practices, internal controls and reporting frequency. Due diligence documents-statutory registrations, tax returns, licences, key contracts, property documents, aligned financial statements-must be organised. Missing or scattered documents can delay or derail discussions even when the core business is strong.
For investor-facing presentations, professional investor pitch deck preparation can complement the full DPR.
18-Point Investor Ready DPR Checklist Table
Use this checklist as a quick self-assessment before approaching potential investors, private equity firms, an angel investor, or strategic stakeholders.
| # | DPR Section | Key Information Required | Why Investors Review It | ☐ |
|---|---|---|---|---|
| 1 | Executive Summary | Investment thesis, funding ask, return potential | First filter for investment interest | ☐ |
| 2 | Company Profile | Promoter track record, shareholding, governance | To gauge promoter credibility and depth | ☐ |
| 3 | Business Concept | Product, capacity, project stage | To understand what is being built | ☐ |
| 4 | Industry Outlook | Market size, demand drivers, validation | To test realism of growth story | ☐ |
| 5 | Competitive Landscape | Competitors, positioning, advantages | To assess defensibility | ☐ |
| 6 | Business Model | Revenue streams, pricing, unit economics | To evaluate scalability | ☐ |
| 7 | Technical Feasibility | Process, machinery, yield, quality | To verify production assumptions | ☐ |
| 8 | Location & Implementation | Land, infrastructure, timeline | To assess execution risk | ☐ |
| 9 | Project Cost | CAPEX, pre-operative, working capital | To verify capital requirement | ☐ |
| 10 | Means of Finance | Equity, debt, promoter contribution | To check funding balance | ☐ |
| 11 | Historical Performance | Revenue, margins, order book | To validate business traction | ☐ |
| 12 | Financial Projections | P&L, balance sheet, cash flow | To model investment returns | ☐ |
| 13 | Profitability & WC | Margins, break even, cash conversion | To test cash sufficiency | ☐ |
| 14 | IRR & Returns | Project IRR, equity IRR, payback | To quantify investor returns | ☐ |
| 15 | Valuation & Dilution | Pre/post money, investor stake | To negotiate deal terms | ☐ |
| 16 | Funding Utilisation | Use of funds, milestones | To track capital deployment | ☐ |
| 17 | Risk & Sensitivity | Scenarios, mitigation | To understand downside exposure | ☐ |
| 18 | Exit & Governance | Exit routes, compliance, data room | To plan investment exit | ☐ |
Bank Loan DPR vs Investor-Ready DPR: Practical Comparison
Many promoters prepare a bank loan project report and assume it is automatically investment ready. It rarely is. While both lenders and investors care about project’s viability, they assess different dimensions of risk and return. Professional DPRs help secure funding from banks and NBFCs, but an investor-focused DPR format for equity investors requires additional depth. Banks require a DPR for loan applications in India and to evaluate loan repayment capacity.
| Parameter | Bank Loan DPR | Investor-Ready DPR |
|---|---|---|
| Primary purpose | Debt repayment assessment | Wealth creation and growth |
| Main decision-maker | Credit officer / bank committee | Investment committee / investor |
| Cash flow focus | DSCR (banks require a minimum DSCR of 1.25 to 1.50) | Equity IRR, free cash flow, valuation |
| Security / collateral | Primary and collateral security required | Not typically collateral-driven |
| Business valuation | Rarely required | Central to deal terms |
| Equity dilution | Not applicable | Core negotiation point |
| Risk tolerance | Conservative; focuses on downside protection | Accepts higher risk for higher returns |
| Exit strategy | Loan tenure and repayment schedule | Strategic sale, secondary, IPO |
| Key financial metric | A DPR must include a DSCR calculation; MPBF calculation is essential | Equity IRR, EBITDA multiple, NPV |
| Due diligence depth | CMA Data, collateral verification | Operational, financial, legal, governance |
A well-structured DPR is mandatory for MSME loan applications, but equity funding DPR requirements go further-covering scalability, upside potential and governance. Both share a common foundation: a strong DPR built on defensible assumptions.
Illustrative Manufacturing Project Example – ₹25 Crore Equity Funding Case
Illustrative Only – Not an Actual Client Project or Investment Offer.
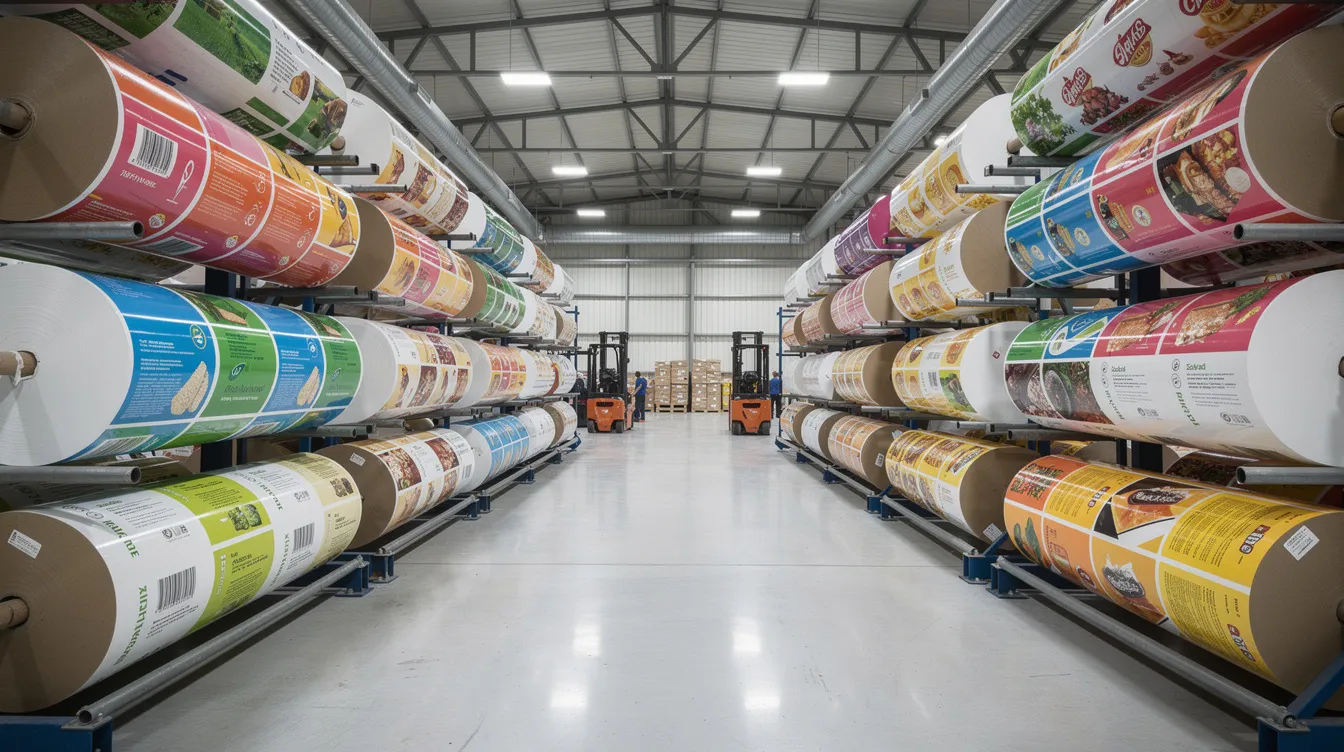
Project profile: A specialty food-packaging materials manufacturing plant in Madhya Pradesh. Proposed capacity: 8,000 TPA of printed flexible packaging for FMCG and food processing clients.
| Component | Details |
|---|---|
| Total project cost | ₹25 crore |
| Promoter equity | ₹7 crore (28%) |
| External equity sought | ₹8 crore (32%) |
| Bank term loan | ₹10 crore (40%) |
| Stabilised revenue (Year 3) | ₹55 crore |
| Target EBITDA margin | 15–17% |
| EBITDA (Year 3) | ₹8.2–9.3 crore |
| Pre-money valuation | ₹32 crore |
| Post-money valuation | ₹40 crore |
| Investor stake | 20% |
Key sensitivity factors: raw material (polymer) price volatility, dependence on 4–5 large FMCG clients, commissioning delay beyond 12 months, and export demand fluctuations. The promoter has 12 years of experience in flexible packaging and has already secured letters of intent covering approximately 40% of Year 1 planned production. DSCR of 1.25 to 1.50 is typically required for the loan component, which this project meets in the base case at 1.45×.
This type of investment ready manufacturing project typically attracts PE growth equity investment sizes between ₹50 crore and ₹400 crore for larger deals, though smaller MSME-scale equity rounds of ₹10–50 crore are also common. Industry benchmarks for EBITDA multiples in specialty manufacturing range from 5–8×.
Common Investor-Ready DPR Preparation Mistakes to Avoid
Investors see recurring patterns of weakness across DPRs. PE deal cycles have lengthened to 6–9 months in India as investors intensify diligence. Avoidable mistakes waste this time and money.
Market and strategy errors:
- Overestimated sales volume and capacity utilisation without order-book evidence
- Weak or copied market analysis with no primary validation
- Ignoring competitor realities; claiming “no competition”
Financial model issues:
- Inconsistent P&L, balance sheet and cash flow statement
- Ignoring interest during construction
- Unrealistic margin expansion without justification
- No downside scenario or sensitivity analysis
- Confusing Project IRR with Equity IRR
Valuation errors:
- Overstated valuation without comparable transactions or DCF logic
- Confusing pre-money with post-money valuation
- Not factoring in ESOPs or future dilutive rounds
Documentation gaps:
- Missing licences, tax compliance issues, unclean cap table
- Unrecorded related-party loans and informal customer arrangements
- Scattered or incomplete documents that slow investor diligence
Unlike investing in mutual funds or listed securities, equity investment in a private company requires deep documentation. A professional DPR prepared by a practising Chartered Accountant with project finance experience helps avoid these mistakes and strengthens investor conversations. The finances must tell a defensible story-not merely an attractive one. An expert team combining operational knowledge and financial modelling capability produces a far more credible document than a generic template.
Need a Professional Investor-Ready DPR for Equity Funding?
If you are a promoter planning to raise equity capital for a manufacturing, processing or MSME project in India, a well prepared DPR is your most important document. It must serve as both a clear roadmap for your business plan and a credible investment proposal for investors.
Project Report Bank, led by CA Manish Gugliya (FCA, DISA (ICAI), B.Com., M.Com.), provides customised professional Investor-Ready DPR and fundraising assistance that includes:
- Technical and commercial feasibility assessment
- Project cost and capital structure analysis
- Integrated financial projections and financial modelling
- Revenue, EBITDA and cash flow analysis
- Project IRR and equity IRR computation
- Use-of-funds analysis and milestone planning
- Business valuation considerations
- Risk assessment and sensitivity analysis
- Supporting investment presentations, where agreed
Every engagement is customised to the specific project-no generic templates. The objective is to prepare a report that the promoter can understand, confidently discuss with financial institutions or investors, and use as a decision-making tool.
CA Manish Gugliya FCA, DISA (ICAI), B.Com., M.Com. Practising Chartered Accountant | 20+ years of professional experience Website: www.projectreportbank.com
Get Professional Investor-Ready DPR and Fundraising Assistance →
FAQs on Investor Ready DPR for Equity Funding
Is an investor-ready DPR different from a bank loan DPR?
Yes. A bank loan DPR focuses on debt repayment capacity, DSCR (banks require a minimum DSCR of 1.25 for loan approval), collateral and CMA Data. An investor-ready DPR emphasises growth potential, equity IRR, business valuation, competitive advantage, governance and exit strategy. While both share a foundation of project feasibility and financial viability, the investor-focused DPR format requires deeper market analysis, unit economics and valuation logic. The emphasis shifts from security-backed lending to risk-adjusted return on equity.
Can a pre-revenue or loss-making company prepare an investor-ready DPR?
Yes, provided the DPR presents credible alternative evidence of commercial viability. For greenfield or pre-revenue projects, this includes pilot sales, sample orders, letters of intent, promoter’s track record in related businesses, and anchor customer discussions. Loss-making companies can invest in preparing an investor-ready DPR if they can demonstrate a clear path to profitability with supported assumptions. Investors evaluate the business concept and future potential, not only historical performance.
How long does it typically take to prepare a high-quality investor-ready DPR?
A professionally prepared investor-ready DPR for a manufacturing or MSME project typically requires 3–6 weeks, depending on project complexity, data availability, promoter responsiveness and the depth of financial modelling required. Rushed preparation usually leads to inconsistent projections and missing documents, which extend the overall fundraising process. Promoters should begin preparation well before approaching investors.
What documents should promoters organise alongside the DPR for investor due diligence?
Key documents include audited financial statements for 3–5 years, company incorporation certificates, shareholding records, land title deeds or lease agreements, machinery quotations, environmental clearances, factory and pollution licences, key customer and supplier contracts, tax returns, and any existing compliance certificates. Organising these in a structured data room before investor discussions demonstrates seriousness and significantly reduces diligence delays.
Should business valuation always be included in an investor-ready DPR?
Including an indicative business valuation is strongly recommended. It helps frame discussions on equity dilution, investor ownership percentage and deal terms. However, valuation in the DPR is typically presented as a considered starting point-not a fixed price. Investors will conduct their own valuation analysis using DCF, comparable multiples or transaction benchmarks. Presenting a defensible valuation range with clear logic improves credibility and helps avoid unrealistic expectations that can derail negotiations.