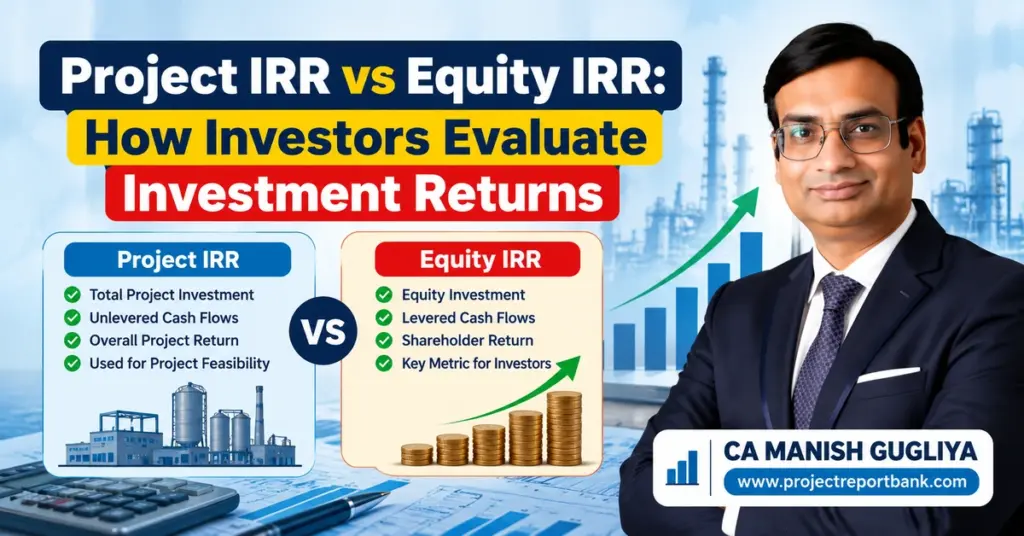
A manufacturing project may generate satisfactory returns on its total capital invested, yet the returns available to its equity investors can be substantially different. This difference between Project IRR and Equity IRR is one of the most important distinctions in project finance – and misunderstanding it leads to flawed investment decisions.
Project IRR (unlevered IRR) measures the internal rate of return on the entire project investment before considering how it is financed. Equity IRR (levered IRR) measures the return earned specifically by equity shareholders after debt servicing. A project with a 17% Project IRR might deliver a 24% Equity IRR to its promoters if leverage is favourable – or a 12% Equity IRR if debt terms are aggressive and cash flows are volatile.
Investors, banks and promoters should never rely on a single IRR figure. Both Project IRR and Equity IRR must be evaluated together to form a comprehensive view of project viability and shareholder returns. This article explains the difference between Project IRR and Equity IRR using a detailed Indian manufacturing project example, Excel formulas, practical calculation steps and linked tables prepared in the style of a professional Detailed Project Report (DPR).
Project IRR vs Equity IRR: The Short Answer for Indian Project Promoters
Project IRR answers a straightforward question: if you deploy ₹100 of total capital into a project – regardless of whether that capital comes from equity or debt – what annual rate of return does the project generate on its own economics? It uses unlevered free cash flow, meaning cash flows before interest and principal repayments, and treats the project as if it were entirely equity-funded.
Equity IRR answers a different question: what return do I, as an equity investor, earn on the money I actually put in, after the project has met all its obligations to lenders? Equity IRR uses levered cash flows – the residual cash available after operating costs, taxes, interest payments and loan principal repayments have been deducted.
The same underlying project can show very different numbers for each metric. Consider a mid-sized manufacturing unit with an initial investment of ₹20 crore, financed with 60% debt and 40% equity. If the project generates stable cash flows and the cost of debt is meaningfully below the Project IRR, the Equity IRR will typically be higher – often in the range of 22–25% against a Project IRR of 16–18%. But if margins compress or debt costs rise, the Equity IRR can fall below the Project IRR, or even turn negative. The rest of this article walks through these mechanics in detail, with a fully worked numerical example.
What Is Project IRR?
Project IRR is the internal rate of return computed on the project’s total free cash flows, ignoring the financing mix entirely. It measures how effectively the project converts its total capital employed – land, building, machinery, pre-operative expenses, working capital – into future cash flows over the investment period.
IRR is the discount rate that makes the net present value (NPV) of all project cash flows equal to zero. In other words, Project IRR is calculated by setting NPV to zero and solving for the rate that equates the present value of all cash inflows with the initial investment and subsequent outflows.
Project IRR includes all cash flows connected to the project – both negative cash flows (capital expenditure, working capital build-up) and positive cash flows (operating revenues net of costs, terminal value recovery). The key principle: financing cash flows (interest, principal repayment, dividends) are excluded.
Components of Project Cash Flows
For a typical Indian manufacturing plant, the unlevered free cash flow series includes:
- Initial capital expenditure (CAPEX): Land and site development, factory building, plant and machinery, installation, electrification, pre-operative expenses (interest during construction, consultancy, trial runs) and contingencies – usually in Year 0 or spread across construction years.
- Working capital investment: Build-up of inventories, receivables and advances during ramp-up, partially offset by trade payables. Net working capital is recovered in the terminal year.
- Operating revenues: Based on installed capacity, capacity utilisation ramp-up (e.g., 60% in Year 1, 75% in Year 2, 85% from Year 3), selling price per unit and expected inflation or price escalation.
- Operating cost: Raw materials, consumables, power and fuel, wages and salaries, repairs and maintenance, factory overheads, administrative and selling expenses.
- Maintenance CAPEX and replacements: Capital expenditure required to sustain production capacity over the project life – equipment overhaul, technology upgrades.
- Taxes: Calculated on earnings before interest (EBIT minus depreciation for tax purposes), using an assumed Indian corporate tax rate (typically 25–30% plus surcharge and cess). Interest is not deducted in the unlevered framework.
- Terminal value: Residual salvage value of fixed assets (often 5–10% of gross block), plus recovery of net working capital, plus any going-concern value if justified.
The mathematical relationship is straightforward: the NPV of the project’s unlevered free cash flow stream, discounted at the Project IRR, equals zero. IRR can be calculated pre-tax or post-tax for projects, but professional DPRs for bank finance and investors in India almost always focus on post-tax Project IRR.
How Project IRR Is Used
- Project feasibility evaluation: Does the project generate returns above its hurdle rate?
- Comparing alternative projects or technologies: Project IRR allows you to compare projects and evaluate investments across different forms of manufacturing or infrastructure, independent of financing.
- Benchmarking against WACC: Project IRR is compared with the project’s weighted average cost of capital (WACC). Investments are profitable if IRR exceeds the cost of capital. If Project IRR falls below WACC, the project adds negative value – the net present value NPV would be negative.
What Is Equity IRR?
Equity IRR measures the internal rate of return earned by equity shareholders based on their actual equity contributions and the cash they receive back – dividends, share buy-back proceeds, and terminal exit value. It reflects the return generated specifically for equity investors after the project has met all debt obligations.
Equity IRR uses levered cash flows after subtracting debt service and interest payments. This means it captures the effect of financial leverage directly. Unlike Project IRR, which assumes no debt financing in its calculations, Equity IRR includes debt in its calculations, affecting risk and returns.
How Equity Cash Flows Are Structured
- Equity contributions are recorded as negative cash flows in the years when promoters and investors inject capital – typically during the construction period, but sometimes additional equity is required during ramp-up or stress years.
- Interest expenses and principal repayments are deducted from project operating cash flows before arriving at cash available to equity. The interest deduction also provides a tax shield (reduces taxable profit), which affects the after-tax cash flow to equity.
- Shareholder distributions follow a typical pattern:
- No dividend in early years – profits are retained to support working capital and stabilise operations.
- Regular dividend payouts once the Debt Service Coverage Ratio (DSCR) is comfortable and lender covenants are satisfied.
- Partial or full exit in Year 7–10 at an agreed valuation multiple, linked to business valuation concepts.
Equity IRR is sometimes called levered IRR because it captures the amplifying (or dampening) effect of debt on equity return metrics. The timing of equity infusions and distributions strongly affects the result – earlier distributions increase Equity IRR, while delayed payouts reduce it.
Critically, Equity IRR can be both higher or lower than Project IRR. A project financed entirely by equity results in identical Project IRR and Equity IRR. But once debt enters the picture, the spread between the project’s return and the cost of debt – combined with the repayment schedule – determines whether leverage is beneficial or harmful. Equity IRR is compared with the required return on equity that investors expect for projects of comparable risk.
Equity investors and private equity funds use Equity IRR along with other financial metrics like equity multiple (total money returned divided by money invested), net present value, and financial projections for equity investors to compare different investment opportunities.
Project IRR vs Equity IRR: Key Differences at a Glance
The following table provides a side-by-side comparison for quick reference. Each row isolates a specific dimension where the two return metrics diverge.
| Dimension | Project IRR (Unlevered) | Equity IRR (Levered) |
|---|---|---|
| Definition | Internal rate of return on total project cash flows | Internal rate of return on equity cash flows only |
| Perspective | Project as a whole (all capital providers) | Equity shareholders and promoters |
| Cash flow basis | Unlevered free cash flow (before debt service) | Levered cash flows (after interest and principal) |
| Initial investment considered | Total project cost (equity + debt + other) | Only equity capital invested by promoters/investors |
| Treatment of debt | Debt is ignored entirely | Debt interest and repayment directly reduce available cash |
| Tax calculation | Tax on EBIT (no interest deduction) | Tax after interest deduction (interest tax shield included) |
| Working capital | Included – investment and recovery | Included – but distribution may be restricted by covenants |
| Terminal value | Asset salvage value + working capital recovery | Equity exit proceeds (business valuation minus outstanding debt) |
| Risk exposure | Business and operational risk only | Business risk + financial/leverage risk |
| Hurdle rate comparison | Compared with WACC | Compared with cost of equity / investor’s required rate of return |
| Primary decision-makers | Banks, lenders, project sponsors | Equity investors, PE funds, promoters |
| Main use in DPRs | Project viability, debt capacity assessment | Shareholder return assessment, fundraising decisions |
Project IRR measures overall project profitability including all cash flows and reflects the inherent operational risk of a project. Equity IRR focuses on returns available to equity investors after debt service and reflects the risk borne specifically by equity investors. Both are essential: Project IRR tells you whether the underlying economics work; Equity IRR tells you whether the equity holders are adequately compensated.
Project IRR Calculation: Formula and Practical Steps
This section explains, step by step, how to calculate IRR for a project – exactly as done in professional financial models for Indian manufacturing and infrastructure projects.
- Step 1 – Estimate total project cost: Aggregate all capital expenditure: land and building, plant and machinery, installation, electrification, pre-operative expenses, contingencies and margin money for working capital. For our reference example, this is ₹20 crore.
- Step 2 – Prepare revenue projections: Estimate year-wise revenue based on installed capacity, capacity utilisation ramp-up (60% → 75% → 85%+), selling price per unit and expected annual escalation.
- Step 3 – Estimate operating costs: Raw materials, consumables, power and fuel, wages, repairs and maintenance, factory overheads, administrative and selling expenses – projected year by year with appropriate inflation assumptions.
- Step 4 – Derive EBITDA and calculate tax: Compute operating profit (EBITDA), deduct depreciation (as per Indian Income Tax Act rates) to arrive at profit before tax. Calculate tax without deducting interest – this is the unlevered framework. Apply corporate tax at the assumed rate (e.g., 25.17% effective).
- Step 5 – Adjust for working capital changes: Net investment in working capital (increase in inventories and receivables minus increase in payables) each year. During ramp-up, working capital typically increases; at terminal year, it is recovered.
- Step 6 – Incorporate CAPEX: Initial CAPEX in Year 0 (and Year 1 for phased projects), plus maintenance or replacement CAPEX in later years.
- Step 7 – Estimate terminal cash flow: Salvage value of fixed assets (e.g., 10% of gross block) plus full recovery of net working capital in the final year.
- Step 8 – Derive annual unlevered free cash flows: For each year: EBITDA − Tax (unlevered) − CAPEX − Change in Working Capital + Terminal Value (in final year). List these as a single row from Year 0 to Year 8 or 10.
- Step 9 – Apply Excel’s IRR formula:
- For regular annual cash flows: =IRR(B2:B10)
- When exact dates or variable intervals are involved: =XIRR(B2:B10, A2:A10)
Calculating IRR often requires numerical methods or financial software because the IRR equation cannot be solved algebraically for most real-world cash flow patterns. Excel’s IRR function uses an iterative approach internally.
Professional checks: After computing the IRR, verify by calculating NPV at the resulting rate (should be approximately zero). Also compute NPV at your project’s WACC to confirm whether the project adds or destroys value. Check that the cash flow series has only one sign change – IRR can be misleading if cash flows change signs multiple times, potentially producing multiple IRRs.
Equity IRR Calculation: Formula and Practical Steps
Equity IRR is calculated after incorporating the project finance structure and mapping the actual equity cash flows over time. Equity IRR typically requires a defined financing structure for calculation.
- Step 1 – Define the debt-equity ratio: For example, 60:40 – equity of ₹8 crore and term loan of ₹12 crore.
- Step 2 – Lay out the term-loan schedule: Specify loan drawdown timing, interest rate (say 10.5% p.a.), repayment tenure (7 years), moratorium period (1 year on principal), and repayment structure (equal annual instalments or sculpted to DSCR).
- Step 3 – Calculate yearly debt service: Opening loan balance, interest expense, principal repayment and closing balance for each year.
- Step 4 – Compute taxable profit after interest: Deduct interest from project PBT to arrive at taxable income. Calculate tax – the interest deduction reduces taxable profit, creating a tax shield.
- Step 5 – Derive cash available to equity: Profit after tax + depreciation (add back non-cash) − principal repayment − increase in working capital − maintenance CAPEX. This gives the free cash flow attributable to equity.
- Step 6 – Define dividend policy and exit event: Specify when dividends begin (often only after Year 2–3 when DSCR stabilises) and whether a terminal exit occurs (e.g., equity sale at Year 8 at a valuation multiple minus outstanding debt).
- Step 7 – Map equity cash flows: List equity contributions as negative cash flows (Year 0 or phased) and all dividends/distributions/exit proceeds as positive cash flows.
- Step 8 – Calculate Equity IRR: Apply =IRR(range) or =XIRR(values, dates) on the equity cash flow series.
Important distinction: The above gives the project-level Equity IRR for all equity shareholders together. An individual investor’s actual return may differ if their entry timing, share price, dilution, preference rights or exit terms vary from other shareholders. This distinction matters significantly for private equity transactions. Equity IRR helps investors determine if the investment meets their return expectations and compare returns across different investment opportunities.
These IRR calculations are typically embedded in a full three-statement financial model – projected P&L, balance sheet and cash flow statement – ensuring internal consistency.
Project IRR vs Equity IRR: Detailed Manufacturing Project Example (India)
This is a fully worked, hypothetical example of a mid-sized manufacturing project in India. All figures are illustrative and do not represent an actual client project.
Base Scenario Assumptions
- Project type: Engineering component manufacturing unit in an industrial area
- Total project cost: ₹20.00 crore
- Land and building: ₹5.00 crore
- Plant and machinery (including installation): ₹11.50 crore
- Pre-operative expenses: ₹1.00 crore
- Contingencies: ₹0.50 crore
- Margin money for working capital: ₹2.00 crore
- Financing structure: Equity ₹8.00 crore (40%), Term Loan ₹12.00 crore (60%)
- Loan terms: Interest rate 10.5% p.a., tenure 7 years, 1-year moratorium on principal, 6 equal annual principal instalments of ₹2.00 crore from Year 2 to Year 7
- Capacity utilisation: Year 1: 60%, Year 2: 75%, Year 3 onwards: 85%
- Revenue at full capacity (100%): ₹12.00 crore per annum
- Operating cost (% of revenue): Raw materials 52%, Power & fuel 6%, Wages 8%, Other overheads 7% – total ~73%
- Corporate tax rate: 25.17% (effective, including surcharge and cess)
- Depreciation: 15% WDV on plant and machinery (for tax purposes); building 10%
- Project life evaluated: 8 years (Year 0 to Year 8)
- Terminal value: Salvage 10% of gross fixed assets (₹1.65 crore) + recovery of working capital (₹2.00 crore)
Year-Wise Project Cash Flows (Unlevered) – For Project IRR
| Year | Revenue (₹ Cr) | Operating Cost (₹ Cr) | EBITDA (₹ Cr) | Tax (Unlevered) (₹ Cr) | CAPEX / WC Change (₹ Cr) | Terminal Value (₹ Cr) | Unlevered FCF (₹ Cr) |
|---|---|---|---|---|---|---|---|
| 0 | – | – | – | – | −20.00 | – | −20.00 |
| 1 | 7.20 | 5.26 | 1.94 | 0.23 | −0.30 | – | 1.41 |
| 2 | 9.00 | 6.57 | 2.43 | 0.35 | −0.20 | – | 1.88 |
| 3 | 10.20 | 7.45 | 2.75 | 0.43 | −0.10 | – | 2.22 |
| 4 | 10.20 | 7.45 | 2.75 | 0.44 | 0.00 | – | 2.31 |
| 5 | 10.20 | 7.45 | 2.75 | 0.45 | 0.00 | – | 2.30 |
| 6 | 10.20 | 7.45 | 2.75 | 0.46 | 0.00 | – | 2.29 |
| 7 | 10.20 | 7.45 | 2.75 | 0.47 | 0.00 | – | 2.28 |
| 8 | 10.20 | 7.45 | 2.75 | 0.48 | 0.00 | 3.65 | 5.92 |
Notes: Tax (unlevered) is computed on EBIT without interest deduction. CAPEX/WC Change in Years 1–3 reflects incremental working capital during ramp-up. Slight annual variation in tax reflects declining depreciation under WDV method.
Project IRR (post-tax, unlevered): ~16.7%
Using =IRR({-20, 1.41, 1.88, 2.22, 2.31, 2.30, 2.29, 2.28, 5.92}) yields approximately 16.7%.
Year-Wise Equity Cash Flows (Levered) – For Equity IRR
| Year | Loan Opening (₹ Cr) | Interest (₹ Cr) | Principal Repaid (₹ Cr) | Loan Closing (₹ Cr) | PAT (After Interest) (₹ Cr) | Cash to Equity (₹ Cr) | Equity CF (₹ Cr) |
|---|---|---|---|---|---|---|---|
| 0 | – | – | – | 12.00 | – | – | −8.00 |
| 1 | 12.00 | 1.26 | 0.00 | 12.00 | 0.25 | 0.15 | 0.15 |
| 2 | 12.00 | 1.26 | 2.00 | 10.00 | 0.56 | 0.16 | 0.16 |
| 3 | 10.00 | 1.05 | 2.00 | 8.00 | 0.94 | 0.54 | 0.54 |
| 4 | 8.00 | 0.84 | 2.00 | 6.00 | 1.15 | 0.75 | 0.75 |
| 5 | 6.00 | 0.63 | 2.00 | 4.00 | 1.34 | 0.94 | 0.94 |
| 6 | 4.00 | 0.42 | 2.00 | 2.00 | 1.52 | 1.12 | 1.12 |
| 7 | 2.00 | 0.21 | 2.00 | 0.00 | 1.69 | 1.29 | 1.29 |
| 8 | 0.00 | 0.00 | 0.00 | 0.00 | 1.82 | 5.47 | 5.47 |
Notes: Cash to Equity = PAT + Depreciation (added back) − Principal repayment − Working capital increase. Year 8 includes terminal value (₹3.65 crore) since loan is fully repaid. Early years show low equity distributions due to moratorium interest and principal repayment beginning Year 2.
Equity IRR (post-tax, levered): ~22.3%
Using =IRR({-8.00, 0.15, 0.16, 0.54, 0.75, 0.94, 1.12, 1.29, 5.47}) yields approximately 22.3%.
Interpretation
- The Project IRR of ~16.7% exceeds typical WACC benchmarks (often 11–13% for such projects), confirming the project creates value on total capital employed.
- The Equity IRR of ~22.3% is significantly higher than the Project IRR, reflecting positive financial leverage – the project earns ~16.7% on total capital while paying only ~10.5% on the debt portion. The difference flows to equity as amplified returns.
- NPV at 13% discount rate (representative WACC) would be positive, confirming rupee-value creation.
- This type of analysis is normally presented in a bankable DPR with investor-ready financial projections alongside DSCR analysis, sensitivity tables and break-even calculations.
Why Equity IRR Is Sometimes Higher (or Lower) Than Project IRR
Positive Financial Leverage
In the example above, borrowing at 10.5% to fund a project earning 16.7% on total capital creates a 6.2 percentage-point spread. This spread, when applied to ₹12 crore of debt (60% of the project), amplifies the return on the ₹8 crore of equity. Leveraging can increase the Equity IRR if the Project IRR exceeds the cost of debt – which is precisely what happens here.
Negative Financial Leverage
Now consider a scenario where sales fall 25% below projections (capacity utilisation stays at 60–65% throughout) and raw material costs increase. The Project IRR might drop to, say, 9–10%. With debt at 10.5%, the project is now earning less than it pays on borrowed money. Interest and principal obligations remain fixed – they don’t shrink with revenues. In this case:
- Cash available to equity shrinks drastically in early years and may turn negative
- Equity IRR falls below Project IRR, potentially to 4–6% or even negative value territory
- DSCR drops below 1.0×, signalling potential default
What Determines Whether Leverage Helps or Hurts?
- Spread between Project IRR and effective cost of borrowing – the wider and more stable this spread, the greater the leverage benefit
- Debt-to-equity ratio – higher leverage amplifies both upside and downside
- Repayment schedule – aggressive repayment (short tenure, no moratorium) squeezes early-year equity cash flows
- Cash flow volatility – projects with stable, predictable expected cash flows benefit more safely from leverage
- DSCR levels – comfortable DSCR (above 1.25–1.50×) provides a buffer; thin DSCR means any revenue shortfall triggers stress
- Refinancing and prepayment options – flexibility to restructure debt can protect equity returns
In professional project finance advisory and loan structuring, leverage decisions are made after detailed DSCR and risk analysis – not simply to “boost” the Equity IRR number.
How Equity Investors Use Project IRR and Equity IRR in Practice
When private equity funds, strategic investors and serious HNIs evaluate a project finance transaction or manufacturing investment, they examine both IRR metrics within a broader framework. IRR is used to compare profitability of different investment projects, but experienced investors never rely on a single number.
What Investors Typically Assess
- Project IRR – to validate that the underlying business economics are sound. If the Project IRR is marginal, no amount of financial engineering can create sustainable equity returns.
- Equity IRR – to determine whether the expected return on their capital meets or exceeds their required rate (cost of equity). For manufacturing projects in India, equity investors often expect returns meaningfully above the cost of equity – typically seeking Equity IRR that justifies the illiquidity and operational risk of the investment.
- WACC comparison – to confirm that Project IRR exceeds the blended cost of capital and the project adds total present value.
- Net present value (NPV) – to quantify the absolute rupee-value creation, not just a percentage return. NPV at the appropriate discount rate shows how much total value the investment creates.
- DSCR – to judge debt sustainability and default risk. Lenders insist on minimum DSCR (often 1.25–1.50× for Indian term loans); investors check this to ensure distributions aren’t blocked.
- Cash flow stability – through sensitivity analysis, stress testing key variables (volume, price, input costs, interest rates) to see how robust the expected cash flows really are.
Understanding how investors evaluate businesses goes well beyond IRR – governance quality, scalability, competitive positioning and management discipline all weigh in the decision. Similarly, knowing what equity investors look for before investing helps promoters prepare realistic models and credible exit plans.
A very high Equity IRR based on optimistic assumptions or unrealistic exit valuations is a red flag for experienced investors. If your model shows a 40% Equity IRR, most institutional investors will question the assumptions rather than be impressed. Institutions typically request detailed project feasibility study documentation and auditable financial models rather than relying on a simplistic IRR snapshot.
Project IRR vs Equity IRR vs ROI vs NPV
IRR represents the average annual return expected from an investment over the investment period, but it is one of several important financial metrics. Sound investment decisions require interpreting IRR alongside ROI, NPV, payback period and DSCR – each captures a different dimension.
| Metric | What It Measures | Time Value of Money? | Key Limitation |
|---|---|---|---|
| Project IRR | Unlevered rate of return on total project cash flows | Yes | Does not show absolute rupee value; assumes reinvestment at IRR |
| Equity IRR | Levered rate of return on equity cash flows | Yes | Highly sensitive to leverage, exit assumptions and timing |
| ROI | Simple total return percentage on investment | No | Ignores timing – treats ₹1 earned today same as ₹1 earned in Year 8 |
| NPV | Absolute rupee-value creation at a chosen discount rate | Yes | Depends on discount rate selection; does not show percentage return |
| Payback Period | Time to recover initial investment | Partially (if discounted) | Ignores cash flows after payback; penalises long-gestation projects |
Limitations of IRR
- IRR assumes all intermediate cash flows are reinvested at the IRR itself – which may be unrealistic for a higher IRR project. The modified internal rate of return (MIRR) addresses this by assuming reinvestment at the firm’s cost of capital.
- IRR can be misleading when comparing multiple projects of different scales or durations. A ₹2 crore project with a 30% IRR creates less total value than a ₹50 crore project with a 20% IRR.
- Non-standard cash flow patterns (alternating positive and negative values) can produce multiple IRRs, making interpretation ambiguous.
- IRR does not reveal the absolute amount of money created. An IRR of 12% indicates a project generates a 12% annual return, but on what base? NPV answers the “how much” question.
For DPRs and investment notes, Project IRR, Equity IRR, ROI, payback period, NPV and DSCR are all used together to form a holistic view of viability. No single metric can substitute for the others.
How Debt Financing Changes Equity IRR (Leverage Sensitivity)
Using the same underlying project economics from the manufacturing example (₹20 crore total cost, ~16.7% Project IRR), the table below shows how different project finance structures affect Equity IRR.
| Financing Structure | Equity (₹ Cr) | Debt (₹ Cr) | Approximate Equity IRR | DSCR Range (Min) | Risk & Lender View |
|---|---|---|---|---|---|
| 100% Equity, 0% Debt | 20.00 | 0.00 | ~16.7% (= Project IRR) | N/A | No leverage risk; no amplification of returns |
| 30% Debt, 70% Equity | 14.00 | 6.00 | ~18.5% | ~2.5× | Conservative; comfortable for lenders; modest IRR uplift |
| 60% Debt, 40% Equity (Base Case) | 8.00 | 12.00 | ~22.3% | ~1.35× | Standard structure; acceptable to most banks; meaningful leverage benefit |
| 75% Debt, 25% Equity | 5.00 | 15.00 | ~24.5% | ~1.05–1.10× | Aggressive; DSCR near minimum; banks may demand additional collateral or reject |
Note: Project IRR remains constant at ~16.7% across all scenarios – it measures project economics independent of financing.
The pattern is clear: Equity IRR increases as leverage increases, but only up to a point. Beyond approximately 70–75% debt for this type of project:
- DSCR becomes dangerously thin – any revenue shortfall triggers covenant breach
- Higher leverage increases financial risk for equity holders and can affect returns negatively
- Banks may decline to approve the financing or demand higher interest rates, which erodes the leverage benefit
- Default risk rises, effectively transferring value from equity to risk rather than to return
Research on Indian real estate projects has documented that as debt ratios increased beyond 70–80%, Equity IRR actually declined – sometimes falling below the unlevered Project IRR – due to excessive debt service costs and heightened risk.
Understanding how much equity funding a business should raise requires balancing the promoter’s desire for higher Equity IRR against lender comfort, DSCR sustainability and the real risk of over-leverage.
What Is a “Good” Project IRR or Equity IRR in India?
There is no universally “correct” IRR percentage. What constitutes a “good” return varies substantially based on context, and applying arbitrary benchmarks without understanding the project’s risk profile is a common analytical error.
Factors That Shape Acceptable IRR Thresholds
- Industry type: A commodity manufacturing project (e.g., cement, basic chemicals) with predictable but thin margins may show a lower Project IRR (12–15%) than a branded consumer goods or niche engineering products business (18–25%).
- Greenfield vs expansion: Greenfield projects carry higher execution, market and technology risk, and investors typically demand higher Equity IRR. Expansions of profitable existing businesses may justify lower IRR targets because past performance provides a track record.
- Market and customer concentration risk: A project dependent on one or two customers (e.g., an auto component ancillary supplying a single OEM) carries concentration risk – warranting higher required returns.
- Technology and obsolescence risk: Projects in rapidly evolving sectors require higher IRR to compensate for the possibility that the technology or product may become obsolete.
- Leverage and debt reliance: A project with 75% debt needs a higher Project IRR than one financed at 50% debt to maintain comparable DSCR and equity safety margins.
- Investment horizon: Private equity investors with a 5–7 year exit horizon generally demand higher Equity IRR (18–25%+) than long-term strategic investors.
- Investor type and risk tolerance: Promoters reinvesting their own money may accept lower IRR than an institutional investor deploying third-party capital.
How to Think About It
Rather than targeting a specific number, promoters should compare:
- Project IRR against the project’s cost of capital (WACC) – if Project IRR is, say, 16% against a WACC of 12%, the project creates meaningful value. If Project IRR is only 1–2% above WACC, the margin of safety is thin.
- Equity IRR against the investor’s required rate of return – if a PE fund targets 20% net returns and the model shows 15% Equity IRR, the project does not meet their threshold regardless of absolute viability.
For context, large-scale Indian solar IPP projects have shown unlevered Project IRR of approximately 10–11% and levered Equity IRR of approximately 14–15%, reflecting the relatively stable and contracted nature of power purchase agreements. Manufacturing projects with higher operating risk typically require proportionally higher returns.
Common Mistakes in Project IRR and Equity IRR Calculations
Financial models prepared without careful discipline are prone to errors that can fundamentally distort IRR calculations. Here is a checklist of the most common mistakes:
- Mixing project and equity cash flows: Subtracting interest and principal from cash flows used for Project IRR. Project IRR uses unlevered free cash flows before debt service – always.
- Double counting the interest tax shield: Deducting interest in both the project-level tax computation and again in the equity-level calculation. The tax shield belongs only to the equity stream.
- Ignoring working capital changes: Omitting the incremental working capital build-up during ramp-up years or failing to add back working capital recovery at the terminal year. This distorts both IRR calculations.
- Underestimating maintenance CAPEX: Assuming zero replacement cost over an 8–10 year project life inflates IRRs unrealistically. Equipment deteriorates; it must be maintained or replaced.
- Overly optimistic utilisation and margins: Projecting 90%+ capacity utilisation from Year 1 or assuming expanding margins without market justification. Such information misleads investors.
- Overstating terminal value: Assuming perpetual growth or aggressive exit multiples without independent justification. Terminal value often accounts for a large share of total value – errors here have outsized impact.
- Mixing nominal and real cash flows: Using nominal (inflation-included) future cash flows but discounting them at a real rate, or vice versa. This produces fundamentally incorrect present value results.
- Comparing post-tax IRR with pre-tax hurdle rate: An apples-to-oranges error that makes a project appear more or less attractive than it actually is.
- Ignoring promoter dilution and investor rights: Computing a single Equity IRR without accounting for preference shares, liquidation preferences, anti-dilution clauses or different entry valuations across investors.
- Using IRR as the sole decision metric: A higher IRR does not automatically make a project superior. NPV, DSCR, compound annual growth rate, cash flow stability and qualitative risk factors must be assessed together.
How an Investor-Ready DPR Presents Project IRR and Equity IRR
A properly prepared Detailed Project Report (DPR) or financial model does not present IRR as a standalone headline number. It integrates IRR within a comprehensive analytical framework that banks and investors can independently verify.
Key Components of an Investor-Ready DPR
- Detailed project cost and means of finance: Equity contributions, term loan, working capital facilities, subsidies (if any) and unsecured loans – all clearly specified with sources and timing.
- Market and technical feasibility: Demand analysis, competitive landscape, technology selection, raw material sourcing and production capacity justification.
- Integrated financial projections: Projected P&L, balance sheet and cash flow statements linked to operating assumptions – typically for 7–10 years. These are the foundation for all return calculations.
- Loan amortisation schedule and DSCR analysis: Year-wise debt service, interest, principal and coverage ratios aligned with term-loan assumptions.
- Project IRR, Equity IRR and NPV calculations: Based on clearly stated, defensible assumptions. Both pre-tax and post-tax IRR may be presented, with the post-tax figures used for investment decisions.
- Break-even and payback period analysis: Volume and value break-even, discounted and undiscounted payback period.
- Sensitivity analysis: How Project IRR, Equity IRR and DSCR change when sales volume drops 10–15%, raw material costs rise 5–10%, interest rates increase by 1–2%, or capacity utilisation falls below projections.
- Risk analysis and mitigation: From both lender and investor perspectives – operational, market, regulatory, technology and financial risk.
Such a DPR helps banks and investors understand the quality of future cash flows and investment returns – but it does not guarantee funding. It provides the analytical foundation for informed decisions.
Where terminal equity values and exit multiples require independent substantiation, business valuation services may be engaged to ensure credibility.
Professional Assistance with Project IRR, Equity IRR and Financial Models
I have spent over two decades preparing financial projections, feasibility studies and investor-ready DPRs for manufacturing and service projects across India. Computing a reliable Project IRR or Equity IRR requires more than plugging numbers into an Excel formula – it requires defensible assumptions, internally consistent financial models and realistic sensitivity analysis.
At Project Report Bank, we assist businesses with:
- Preparing robust three-statement financial models with linked project and equity cash flow projections
- Computing realistic Project IRR and Equity IRR based on practical, defensible assumptions tailored to specific sectors
- Conducting scenario and sensitivity analysis to understand downside risks and leverage impact on equity return metrics
- Structuring project finance and working capital limits to balance DSCR, debt capacity and Equity IRR, aligned with professional financial projections and financial modelling services
- Carrying out project feasibility study assignments for greenfield and expansion projects
Need Project IRR, Equity IRR or Investor-Ready Financial Projections?
A reliable investment decision requires more than a headline return percentage. A properly structured financial model should demonstrate project profitability, shareholder cash flows, debt servicing, sensitivity to key assumptions and investment risks.
CA Manish Gugliya provides professional assistance with financial modelling, feasibility evaluation, project finance structuring and investor-ready Detailed Project Reports for businesses and manufacturing projects in India.
Frequently Asked Questions on Project IRR vs Equity IRR
Below are the most common questions Indian promoters and investors ask about these two return metrics.
What is the main difference between Project IRR and Equity IRR?
Project IRR uses total project cash flows (unlevered free cash flow) before any financing – treating the project as if fully funded by equity. Equity IRR uses only the cash flows specific to equity investors after debt service (interest and principal repayments). Project IRR measures overall project profitability; Equity IRR measures the return generated for equity holders.
Is Equity IRR always higher than Project IRR?
No. Equity IRR is higher only when leverage is positive – meaning the project’s return exceeds the cost of debt and cash flows are stable enough to support debt service. If the cost of debt is close to or above the Project IRR, or if repayment schedules are aggressive, Equity IRR can fall below Project IRR. In extreme cases, it can turn negative even when the Project IRR is positive.
Which IRR do private equity investors focus on?
Private equity investors focus primarily on Equity IRR because it measures the return on their invested capital. However, experienced PE investors will always review Project IRR, DSCR, NPV and sensitivity analysis to ensure the underlying project economics are sound. A high Equity IRR built on fragile project fundamentals or unrealistic exit assumptions does not attract serious capital.
How do you calculate Project IRR in Excel?
List your annual unlevered free cash flows in a single row or column (Year 0 as negative CAPEX, Years 1–N as operating free cash flows, final year including terminal value). Use =IRR(B2:B10) for regular annual intervals. If cash flow dates are irregular, use =XIRR(values_range, dates_range) for greater accuracy. Calculating IRR typically requires numerical methods or financial software – Excel handles the iterative computation internally.
How do you calculate Equity IRR in Excel?
List equity cash flows only: equity contributions as negative values (in the years invested) and all dividends, distributions and exit proceeds as positive values. Do not include debt drawdowns or principal repayments as equity cash flows – these belong to the debt schedule. Apply =IRR(range) or =XIRR(values, dates) on this equity cash flow series.
Does increasing debt always increase Equity IRR?
No. Increasing debt amplifies Equity IRR only when the project consistently earns more than the cost of debt and cash flows are stable. Beyond a certain leverage threshold, DSCR weakens, lender risk increases, interest rates may rise, and the probability of cash flow shortfalls grows. Research on Indian projects shows Equity IRR can peak and then decline – even falling below the unlevered Project IRR – when debt ratios become excessive.
Is Project IRR the same as ROI?
No. ROI is a simple percentage measuring total return on capital invested without considering the time value of money. Project IRR is a discounted cash flow metric that accounts for the timing of every cash inflow and outflow. A project with strong early cash flows will show a higher IRR than one with identical total cash but back-loaded timing, whereas ROI would treat both identically.
What happens if Project IRR is below the cost of capital?
If the Project IRR is below the project’s WACC, the project destroys value – the net present value is negative. This means the total present value of expected cash flows is less than the capital invested. The project should be reconsidered, restructured (different scale, technology, market) or abandoned. Funding such a project means the capital would earn more in alternative uses.
What is a good Equity IRR for a manufacturing project in India?
There is no single standard. The “right” Equity IRR depends on sector risk, greenfield vs expansion, leverage, investor type and investment horizon. A PE fund might target 20–25% Equity IRR for a greenfield manufacturing investment, while a promoter expanding an existing profitable business might accept 15–18%. What matters is that the Equity IRR exceeds the investor’s required rate of return and that the underlying assumptions are realistic and stress-tested.
Should an investor look at both Project IRR and Equity IRR?
Absolutely. Project IRR shows whether the project itself creates value on total capital – it isolates business quality from financing decisions. Equity IRR shows whether equity holders are adequately rewarded after debt obligations. Evaluating only Project IRR might hide poor financing terms; evaluating only Equity IRR might mask a fundamentally weak project propped up by favourable debt. Together, they provide a comprehensive view of both project viability and shareholder returns.
Conclusion: Why Both Project IRR and Equity IRR Matter
Project IRR reveals whether the project itself – its technology, market, operations and cost structure – generates sufficient returns on total capital employed. It is the acid test of project quality, independent of how promoters choose to fund it.
Equity IRR reveals whether promoters and investors are adequately rewarded for the specific risk they bear – the risk that remains after lenders have been paid. It captures the impact of leverage, debt terms, repayment schedules and the timing of distributions. It is the metric that directly answers whether the investment opportunity meets the investor’s required return.
Good investment decisions require both perspectives. They also require realistic assumptions, disciplined sensitivity analysis, and a clear-eyed assessment of what can go wrong. A financial model detective would scrutinise every assumption – utilisation rates, price escalation, operating cost inflation, terminal value, exit multiples – because IRR is only as reliable as the cash flow projections it is built on.
Serious promoters base their decisions on complete financial models, not isolated IRR numbers. If you are planning a manufacturing project, raising equity capital or evaluating a project finance transaction, the starting point is a properly structured DPR that presents Project IRR, Equity IRR, NPV, DSCR and sensitivity analysis within an internally consistent framework.
For assistance with investor-ready financial models, IRR analysis and project feasibility, reach out to CA Manish Gugliya at Project Report Bank.
Author: CA Manish Gugliya, FCA, DISA (ICAI), B.Com, M.Com. – Practising Chartered Accountant with over 20 years of experience in project finance, detailed project reports (DPRs), financial projections, feasibility studies, bank financing and investment evaluation.