
Key Takeaways
- Maida and Suji plant financial viability in India depends on rigorous ROI, IRR, NPV, payback and sensitivity analysis – not simply on machinery quotations, installed capacity or a single profit percentage.
- Wheat procurement price, product selling prices, extraction rate, product mix, capacity utilisation during ramp-up and the working capital cycle are the biggest drivers of profitability for any roller flour mill or wheat plant investment.
- A 100 TPD roller flour mill or mini flour mill can show attractive accounting profit yet still fail on DSCR, equity IRR or payback if loan structuring, cash flow timing and working capital are not modelled correctly.
- Project Report Bank, led by CA Manish Gugliya (FCA, DISA, ICAI), prepares customised Detailed Project Reports, financial models and CMA Data for Maida, Suji, Atta and wheat flour projects across India.
- This article walks through capital cost, wheat flour yield, ROI and IRR formulas, payback, break-even, scenario and sensitivity analysis with an illustrative 100 TPD Maida–Suji plant example.
Introduction: Why Maida & Suji Plant ROI, IRR and Payback Analysis Matters
Consider an Indian entrepreneur evaluating a Maida, Suji and wheat flour mill project. A machinery vendor has quoted a capacity of 100 TPD. A rough estimate suggests annual turnover exceeding ₹80 crore and an attractive margin. The numbers look promising on a single page. But are they reliable enough to commit ₹15–₹40 crore of promoter capital and bank borrowing?
Machinery capacity and a simple profit analysis are not enough to judge whether a wheat milling plant is financially viable. The financial viability of a plant producing maida and suji requires analyzing capital expenditures and operating revenues in a structured, time-phased framework. An apparently strong project can deliver weak returns if wheat procurement costs rise, Maida or Suji selling prices soften, plant utilisation remains below expectations, extraction rates differ from assumptions, interest costs increase, or working capital stretches beyond what was planned.
This is precisely why metrics such as ROI (Return on Investment), IRR (Internal Rate of Return), NPV (Net Present Value), payback period and break-even capacity utilisation need to be evaluated together – not in isolation. Each metric captures a different dimension of risk and return. Together, they form the financial backbone of any serious investment decision.
As a practising Chartered Accountant with more than 20 years of experience, my approach at Project Report Bank focuses on cash-flow-based analysis and sensitivity testing for Maida Suji plant ROI IRR payback analysis. This article is structured to help entrepreneurs, investors and project finance professionals examine feasibility before committing capital to a wheat milling project in India.
Understanding Investment Returns in a Maida & Suji Manufacturing Plant
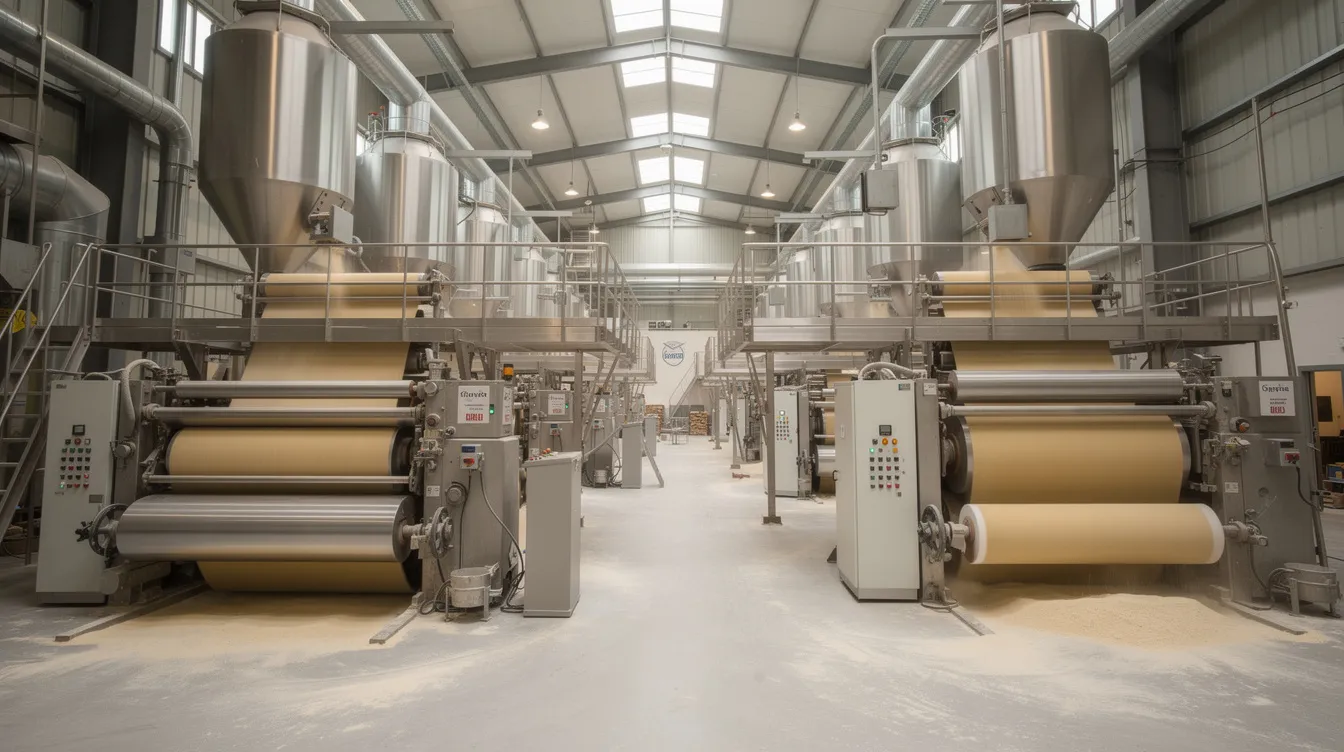
A typical roller flour mill processes wheat grains through cleaning, conditioning, roller milling, plansifting and purification to produce multiple outputs. The principle wheat products include Maida (refined flour), Suji (semolina, also used in pasta and food products), whole wheat atta, and wheat bran. The plant includes machinery like bleachers and purifiers to achieve the required separation and grade quality for each product.
Wheat – which belongs to botanical groups Triticum vulgane (bread wheat) and Triticum drum (durum wheat, used for semolina and pasta) – is cultivated across India under widely differing climatic conditions and soil types. Different wheat varieties yield different protein, starch and gluten profiles, which in turn affect extraction rates and product quality. In commerce, wheat grains belong to categories that also include other cereals like rice gram and short fine grains, but wheat remains the dominant input for flour mill operations.
In terms of production capacity, a 100 TPD roller flour mill operating 300 days annually can theoretically process 30,000 tonnes of wheat. A larger daily roller flour milling capacity of 150 MT translates to an annual wheat crushing capacity of 68,400 tons. Even a mini flour mill with a plant capacity of 40 MT per day produces meaningful volumes requiring proper financial evaluation.
Wheat processing yields typically around 50–55% atta, 20–25% maida, 10% suji, and 10–15% wheat bran, though the exact split depends on the configured milling process and equipment. In a dedicated roller flour mill optimised to produce maida, extraction can reach 54% maida, 9% suji, 8–9% atta and roughly 24–25% bran and by-products, with 2–3% process loss. These extraction rates and the corresponding product selling prices determine the weighted-average revenue per tonne of wheat processed.
Revenue therefore depends not just on wheat throughput but on the product mix. Product mix and extraction ratios can significantly boost net income and ROI in flour mills. Higher-value products like bakery-grade maida or food-grade suji command better prices than generic atta or bran.
It is important to distinguish between accounting profitability (PAT – profit after tax), operating profitability (EBITDA – earnings before interest, tax, depreciation and amortisation), cash flow generation, project-level investment returns (project IRR), equity investor returns (equity IRR) and debt repayment capacity (DSCR). Each provides a different perspective. A plant can be profitable on paper and still face cash-flow shortages. A project can show high ROI but weak IRR if cash flows are concentrated in later years.
Capital Investment and Project Cost Considerations
Wheat processing plants involve significant fixed capital cost. Beyond machinery, the investment includes land, civil works, storage silos, electrical infrastructure, utilities, packing lines, laboratory equipment, pre-operative expenses and margin money for working capital. The machinery required for a 100 TPD line includes wheat cleaning and conditioning cleaning equipment, roller mills, plansifters, purifiers, pneumatic conveyors and automated packing systems.
For context, a mini flour mill with a production capacity of 40 MT per day may have a total capital investment of Rs. 5.38 crore, with land and building costs of Rs. 2.55 crore and plant and machinery cost of Rs. 56.95 lacs. Scaling up to 100 TPD, the total project outlay (assuming owned land) typically ranges from ₹12–18 crore, with fixed investment of ₹9–13 crore and working capital margin of ₹3–5 crore. A 150 TPD plant can require ₹20–30 crore.
The distinction between fixed capital investment, total project cost and total funds requirement matters for return calculations. Margin money for working capital – often 25% of the assessed working capital requirement – forms part of the total project outlay funded by the promoter and term loan, but the full working capital cycle is financed through cash credit limits from the bank. For a detailed breakdown, see Maida & Suji Plant Project Cost & Means of Finance.
| Cost Component | Illustrative Range (₹ Crore) |
|---|---|
| Land & Site Development | 1.5 – 3.0 |
| Factory Building & Civil Works | 2.0 – 4.0 |
| Plant & Machinery (Roller Mill Line) | 2.0 – 3.5 |
| Electricals, DG Set, Utilities | 0.5 – 1.0 |
| Packing Machinery & Warehouse | 0.3 – 0.8 |
| Lab, QA, Pollution Control | 0.1 – 0.3 |
| Pre-operative & Contingency | 0.5 – 1.0 |
| Margin Money for Working Capital | 3.0 – 5.0 |
| Total Project Cost (100 TPD) | 12 – 18 |
Actual costs depend on location, automation level, technology and vendor quotations. These are illustrative, not quotations.
How the project cost is financed – the split between promoter contribution (typically 25–35%) and term loan (65–75%) – directly affects interest cost, DSCR and equity IRR. More information on Maida & Suji Manufacturing Plant Setup Cost in India is available for those evaluating specific equipment configurations.
How to Calculate ROI for a Maida & Suji Plant
ROI measures the overall net profitability relative to the total capital invested. In a Maida and Suji manufacturing plant, it answers a basic question: what percentage return does the invested capital generate annually?
The commonly used formula is:
ROI (%) = Annual Profit ÷ Investment Base × 100
However, both “Annual Profit” and “Investment Base” must be defined consistently. PAT divided by total project cost gives a different ratio than EBIT divided by capital employed (ROCE). Return on Equity (ROE) uses only the promoter’s own capital as the denominator. The average annual net profitability is calculated over a standard operating timeframe, typically after the plant has reached stabilised operations.
Consider a simplified illustration for a 100 TPD wheat plant with a total project cost of ₹15 crore:
| Item | ₹ Crore |
|---|---|
| Annual Revenue (at ~80% utilisation) | 62.0 |
| Raw Material (Wheat + Packing) | 53.0 |
| Manufacturing & Admin Expenses | 3.5 |
| EBITDA | 5.5 |
| Depreciation | 1.2 |
| Interest on Term Loan | 1.4 |
| PBT | 2.9 |
| Tax (~25%) | 0.7 |
| PAT | 2.2 |
ROI (on total project cost) = 2.2 ÷ 15.0 × 100 = ~14.7%
ROCE (EBIT ÷ Capital Employed) would differ because it uses pre-interest, post-depreciation profit divided by net assets.
Why is simple ROI alone insufficient? It ignores the timing of cash flows, the ramp-up period (where utilisation in Year 1 may be only 60%), major repair expenditure in later years, and the recovery of working capital at the end of the project’s life. At Project Report Bank, we prefer to use ROI alongside IRR, NPV and payback to present a complete picture in every detailed project report for a Maida–Suji–Atta flour mill.
Internal Rate of Return (IRR) for Maida & Suji Manufacturing Projects
IRR evaluates the profitability of projected cash flows over the entire life of the project. Unlike accounting ROI, Internal Rate of Return considers the time value of money, impacting long-term financial assessments. Specifically, IRR is the discount rate that makes the net present value of all cash flows from the plant equal to zero.
The standard NPV formula used to derive IRR is:
NPV = Σ [CFt ÷ (1 + r)^t] − Initial Investment = 0
Where CFt represents the net cash flow in period t, r is the discount rate (IRR when NPV = 0), and the summation runs across all periods of the project life.
The critical distinction for wheat milling projects is between project IRR and equity IRR. Project IRR is calculated on unlevered free cash flows – cash flows generated by the business before any financing charges or principal repayments. Equity IRR is calculated on cash flows available to the equity investor after debt service. Because of financial leverage, equity IRR is typically higher than project IRR in a base case scenario, but it is also more volatile and can turn negative if operations underperform.
Computing IRR in practice requires Excel’s IRR or XIRR functions applied to a series of annual net cash flows. A common mistake is using profits instead of cash flows – this leads to incorrect results because depreciation (a non-cash charge) and working capital movements are not reflected in profit figures.
The choice of project life matters. Core roller flour milling machinery may have an economic life of 10–12 years, and the financial model should consider residual value, working capital recovery and replacement capital expenditure over this period. Calculating the financial viability of a wheat milling plant involves structuring initial investment against projected annual net cash flows across the relevant economic life.
There is no single universal threshold for a “good” IRR in Maida Suji plants. Instead, the project IRR should be compared against the project’s hurdle rate (often the WACC), while equity IRR should be compared against the promoter’s required rate of return, considering the specific risks of agro-processing in India.
Net Present Value (NPV) and Discounted Cash Flow Analysis
NPV is arguably the most rigorous method of evaluating Maida Suji plant financial viability because it incorporates both the timing and the risk of future cash flows through the discount rate.
The discount rate for an unlevered project analysis is typically the weighted average cost of capital (WACC), which blends the cost of equity and the cost of debt (post-tax) in proportion to the project’s financing structure. For a typical wheat flour mill financed with 30% equity and 70% term loan at 12–14% interest, the WACC might fall in the 12–15% range depending on the assumed cost of equity.
Consider two Maida Suji plants with identical total PAT of ₹2.2 crore per year. Plant A generates stable cash flows from Year 1 because of pre-existing customer contracts. Plant B takes three years to ramp up and generates higher cash flows only from Year 4 onwards. Despite similar total profits over ten years, Plant A will have a higher NPV because its cash flows arrive earlier and are discounted less heavily.
The interpretation is straightforward: a positive NPV means the project is expected to generate value above the required rate of return. A zero NPV means the project just meets the hurdle rate. A negative NPV indicates value destruction, at least under the assumed discount rate and cash flow projections. Sensitivity to discount-rate assumptions should always be tested.
While lenders may prioritise DSCR and security, equity investors and promoters should focus on NPV and equity IRR when deciding between a Maida Suji project and alternative investments.
Payback Period of a Maida & Suji Plant
The payback period tells you the exact time required to recover your initial cash outlay from net cash inflows. In its simplest form, payback period equals initial total capital investment divided by annual net cash inflow.
For a 100 TPD flour mill with a total project cost of ₹18 crore and estimated annual net cash flow (PAT + depreciation − working capital changes) of approximately ₹3.5 crore:
Simple Payback ≈ 18 ÷ 3.5 ≈ 5.1 years
However, this assumes uniform cash flows. In reality, Year 1 cash flows are lower due to ramp-up, so cumulative payback should be tracked year by year:
| Year | Net Cash Flow (₹ Cr) | Cumulative (₹ Cr) |
|---|---|---|
| 0 | (18.0) | (18.0) |
| 1 | 2.0 | (16.0) |
| 2 | 2.8 | (13.2) |
| 3 | 3.5 | (9.7) |
| 4 | 3.8 | (5.9) |
| 5 | 4.0 | (1.9) |
| 6 | 4.0 | 2.1 |
In this illustration, payback occurs during Year 6. Payback period is highly sensitive to cash flow fluctuations and initial capital expenditures. Using accounting profits instead of cash flows would understate the actual recovery time.
The discounted payback period adjusts future cash flows for the time value of money (using, say, a 12–14% discount rate), and typically extends the payback by 1–2 years compared with the simple calculation. Shorter payback is preferred where raw material price volatility impacts project viability, as wheat is a seasonal commodity.
At Project Report Bank, payback is always evaluated alongside IRR, NPV and DSCR rather than used in isolation, because payback ignores all cash flows generated after the recovery point.
Break-Even Analysis and Minimum Viable Capacity Utilisation
In a Maida, Suji and Atta flour mill, fixed costs include salaries, plant overheads, insurance, depreciation and minimum power charges. Variable costs include wheat purchase, packing material, variable energy, freight and sales commission. The distinction matters because fixed costs are incurred regardless of production volume.
The contribution margin approach works as follows:
- Contribution = Revenue − Variable Costs
- Break-Even Sales = Fixed Costs ÷ Contribution Margin Ratio
- Break-Even Tonnage = Break-Even Sales ÷ Weighted Average Selling Price per Tonne
- Break-Even Capacity Utilisation = Break-Even Tonnage ÷ (Installed Capacity × Operating Days)
For reference, the break-even point for a mini flour mill project has been reported at 42% capacity utilisation – meaning the plant must operate at least at 42% of its rated capacity just to cover total costs including interest and depreciation. Capacity utilization during ramp-up is a key factor in assessing project economics.
It is important to distinguish three levels of break-even:
- Operating break-even: where EBITDA equals zero.
- Cash break-even: where net cash flow after loan instalments and interest equals zero.
- Debt-service break-even: where cash flow available for debt service (CFADS) just equals the scheduled debt service.
In a new wheat flour or mini flour mill, low first-year capacity utilisation (say 50–60%) can sharply increase per-tonne fixed cost, compress EBITDA margins and push DSCR below the lender’s comfort threshold – even when long-term projections appear profitable. Understanding break-even capacity is therefore critical when negotiating offtake arrangements, building dealer networks or planning contract manufacturing for bakery flour and packaged whole wheat flour brands.
Illustrative Financial Model for a 100 TPD Maida & Suji Plant
This section outlines an educational, illustrative financial model for a 100 TPD wheat-input roller flour mill producing Maida, Suji, Atta and bran, operating 300 days per year. All assumptions are illustrative and should be customised for any specific project.
Table 1: Technical and Operating Assumptions
| Parameter | Assumption |
|---|---|
| Installed Capacity | 100 TPD wheat input |
| Operating Days | 300 per year |
| Max Annual Wheat Input | 30,000 tonnes |
| Capacity Utilisation (Yr 1/2/3/4/5) | 60% / 70% / 80% / 85% / 90% |
| Wheat Purchase Price (landed) | ₹29,000 per tonne |
| Cleaning Loss | 2% of gross wheat |
| Maida Extraction | 54% of cleaned wheat |
| Suji Extraction | 9% |
| Atta Extraction | 8.5% |
| Bran & By-products | 24.5% |
| Process Loss | 2% |
| Maida Selling Price | ₹42,000/tonne (wholesale) |
| Suji Selling Price | ₹47,000/tonne |
| Atta Selling Price | ₹35,000/tonne |
| Bran Selling Price | ₹12,000/tonne |
Table 2: Estimated Project Investment
| Component | ₹ Crore |
|---|---|
| Land & Site Development | 2.0 |
| Building & Civil Works | 3.0 |
| Plant & Machinery | 3.0 |
| Electricals & DG | 0.7 |
| Vehicles, Lab, ETP | 0.3 |
| Pre-operative & Contingency | 0.7 |
| Working Capital Margin | 4.3 |
| Total Project Cost | 14.0 |
Table 3: Wheat Processing and Product Yield (Year 3 at 80% Utilisation)
| Item | Tonnes |
|---|---|
| Wheat Input (24,000 × 98% cleaning) | 23,520 |
| Maida (54%) | 12,701 |
| Suji (9%) | 2,117 |
| Atta (8.5%) | 1,999 |
| Bran (24.5%) | 5,762 |
| Process Loss (2%) | 470 |
| Total | 23,520 |
Note: totals reconcile. Working capital requirement for one month in a plant of this scale can reach Rs. 2.14 crore or more, depending on wheat inventory and receivable cycles.
Table 4: Annual Revenue by Product (Year 3)
| Product | Qty (T) | Price (₹/T) | Revenue (₹ Cr) |
|---|---|---|---|
| Maida | 12,701 | 42,000 | 53.3 |
| Suji | 2,117 | 47,000 | 9.9 |
| Atta | 1,999 | 35,000 | 7.0 |
| Bran | 5,762 | 12,000 | 6.9 |
| Total Revenue | 77.1 |
Table 5: Manufacturing and Operating Expenses (Year 3)
| Expense | ₹ Crore |
|---|---|
| Wheat Purchase (24,000 T × ₹29,000) | 69.6 |
| Packing Material | 1.2 |
| Power & Fuel | 1.5 |
| Labour & Staff | 0.8 |
| Repairs & Maintenance | 0.4 |
| Admin & Selling Expenses | 0.5 |
| Total Operating Cost | 74.0 |
Table 6: Profitability Summary (Year 3)
| Item | ₹ Crore |
|---|---|
| Revenue | 77.1 |
| Operating Costs | 74.0 |
| EBITDA | 3.1 |
| Depreciation | 0.9 |
| EBIT | 2.2 |
| Interest on Term Loan | 1.0 |
| PBT | 1.2 |
| Tax (~25%) | 0.3 |
| PAT | 0.9 |
EBITDA Margin ≈ 4.0%. This is characteristic of flour milling – a high-turnover, low-margin business where even small cost or price changes materially affect returns.
Table 7: Cash Flow Structure (Simplified, Year 3)
| Item | ₹ Crore |
|---|---|
| EBITDA | 3.1 |
| Less: Tax on Operations | 0.3 |
| Less: Working Capital Increase | 0.2 |
| Unlevered Project Cash Flow | 2.6 |
| Less: Interest | 1.0 |
| Less: Principal Repayment | 1.2 |
| Equity Cash Flow | 0.4 |
Table 8: Summary Indicators (Illustrative, 10-Year Model)
| Metric | Indicative Value |
|---|---|
| Average ROI (PAT/Total Investment) | 12–16% (stabilised years) |
| Project IRR (Unlevered) | 18–22% |
| Equity IRR (Levered) | 20–28% |
| NPV @ 14% WACC | Positive in base case |
| Simple Payback | 5–6 years |
| Discounted Payback | 7–8 years |
| Average DSCR | 1.15–1.30 |
All figures are illustrative. Actual outcomes depend on location, market conditions, financing and execution.
For a mini flour mill with a plant capacity of 40 MT per day – where total capital investment is Rs. 5.38 crore – the expected rate of return has been reported at 40%, with a break-even point at 42% capacity utilisation. However, such returns depend heavily on local market conditions, actual utilisation and cost control.
Planning a Maida & Suji Manufacturing Plant? A reliable investment decision requires a project-specific financial model. Contact CA Manish Gugliya at Project Report Bank through the website’s WhatsApp enquiry facility for a customised DPR, financial projections and sensitivity study based on your proposed capacity, location and financing structure.
Sensitivity Analysis of Maida & Suji Manufacturing Profitability
Sensitivity analysis examines how changes in key assumptions impact financial metrics like NPV and IRR. In a Maida and Suji plant, the most influential variables are wheat procurement price, product selling prices, capacity utilisation, extraction rates, energy costs, working capital cycle and financing costs. Each deserves careful evaluation.
Wheat procurement price is the single largest cost factor, typically constituting 85–90% of operating expenditure. A ±5% change in wheat cost per tonne can shift EBITDA margin by nearly a full percentage point. As of October 2026, the modal wholesale price for wheat across Indian mandis is approximately ₹2,615 per quintal, but landed costs vary by region, transport and quality. The wheat MSP for Rabi 2027-28 has been set at ₹2,610 per quintal, which establishes a floor for procurement. Raw material price volatility impacts project viability as wheat is a seasonal commodity, with procurement patterns, government policy and the concerned state’s civil supplies department all influencing availability.
Product selling-price sensitivity is equally critical. A 5% decline in Maida and Suji realisations reduces contribution margin disproportionately – because variable costs remain unchanged, the entire price reduction flows directly to EBITDA. Flour mills are affected by government regulations and food policies, and guidance issued regarding pricing, fortification with iron and other nutrients, or import-export restrictions can create cash flow bottlenecks.
Capacity utilisation has a structural impact. Running at 60% instead of 80% utilisation in Years 2–3 increases per-tonne fixed cost and can delay payback by 1–2 years while depressing equity IRR. Milling is power-intensive and fluctuations in electricity tariffs impact annual net operating profit, compounding the utilisation effect.
Extraction rate changes are subtle but significant. Even a 1–2 percentage point shift in Maida recovery – from 54% to 52% – at the same wheat input reduces weighted-average revenue per tonne without reducing raw material cost.
Working capital sensitivity matters because longer receivable periods (say, from 30 to 60 days for institutional buyers) increase reliance on cash credit limits and raise interest costs. Working capital assessments are crucial for financing in milling plants.
Illustrative Sensitivity Matrix: EBITDA Margin (%)
| Selling Price −5% | Selling Price Base | Selling Price +5% | |
|---|---|---|---|
| Wheat Price −5% | 4.8% | 7.5% | 10.2% |
| Wheat Price Base | 1.2% | 4.0% | 6.8% |
| Wheat Price +5% | (2.4%) | 0.5% | 3.3% |
Directional indicators only. Actual EBITDA, IRR and NPV require a fully reconciled financial model.
The matrix demonstrates that a simultaneous 5% increase in wheat price and 5% decline in selling prices can eliminate EBITDA entirely. This kind of scenario testing – not a forecast – should be embedded in every DPR before promoters finalise investment or loan amounts.
Base Case, Optimistic Case and Pessimistic Case Scenarios
Beyond single-variable sensitivity, complete scenario analysis helps investors visualise the range of possible outcomes for their Maida and Suji plant ROI and IRR. A good feasibility study should test at least a base case, an optimistic case, and a downside case.
The Base Case uses moderate wheat price assumptions, planned product mix, gradual capacity ramp-up (60% to 90% over five years), stable interest rates and normal working capital cycle – consistent with the 100 TPD example above.
The Optimistic Case assumes slightly higher capacity utilisation (reaching 90% by Year 2), better Maida and Suji realisations due to institutional tie-ups, improved extraction efficiency and tighter overhead control.
The Pessimistic Case models higher wheat procurement prices (+7–10%), weaker product selling prices (−5%), lower plant utilisation (50–60% in early years), longer receivables and marginally higher interest cost – conditions that are adverse but still technically feasible in Indian wheat milling.
| Metric | Pessimistic | Base | Optimistic |
|---|---|---|---|
| Capacity Utilisation (Yr 3) | 60% | 80% | 90% |
| Revenue (₹ Cr, Yr 3) | 58 | 77 | 87 |
| EBITDA (₹ Cr) | 0.5 | 3.1 | 5.8 |
| EBITDA Margin | 0.9% | 4.0% | 6.7% |
| PAT (₹ Cr) | Negative | 0.9 | 2.8 |
| Project IRR | <12% | 18–22% | >25% |
| Equity IRR | <8% | 20–28% | >30% |
| Simple Payback | >8 years | 5–6 years | 4–5 years |
| Average DSCR | <1.0 | 1.15–1.30 | >1.40 |
In the pessimistic case, the plant might still show marginal accounting profit but fail on equity IRR, NPV or DSCR – indicating high financial stress despite apparent profitability. This is exactly why the same plant should be evaluated under multiple scenarios before promoters finalise borrowing.
Impact of Working Capital and Loan Repayment on Project Returns
Maida, Suji and whole wheat flour projects are working-capital intensive. Flour milling typically requires substantial working capital due to the need for raw materials before sales occur. Wheat stock, packing material, finished Maida, Suji, Atta and bran inventory, and trade receivables must all be financed – often partly through cash credit and bank limits.
Seasonal wheat procurement can require higher stocks post-harvest (April–June), when purchase prices may be relatively favourable. The working capital cycle stretches when institutional buyers or modern retail chains demand 45–60 days of credit, straining cash flow even when accounting profits appear healthy.
Cash flow analysis is essential for understanding debt repayment capacity in milling projects. The DSCR is calculated as:
DSCR = Cash Flow Available for Debt Service (CFADS) ÷ (Scheduled Principal Repayment + Interest on Term Loan)
Banks typically expect a minimum DSCR of 1.10–1.25 for agro-processing term loans. A front-loaded repayment schedule over 5–7 years can depress equity IRR and make early-year DSCR weak, even in a technically sound wheat flour manufacturing project. Consistent definitions of CFADS, project cash flows and equity cash flows are crucial in any Detailed Project Report for bank term loans.
For detailed guidance on structuring financial projections and working capital assessment, see Maida & Suji Plant Financial Projections, Working Capital & DSCR.

How Product Mix Optimisation Improves Flour Mill Investment Returns
A roller flour mill’s return is not driven only by tonnes of wheat crushed but by what is sold and at what contribution margin. A flour mill can serve diverse market segments – from commodity maida sold to wholesale traders to specialised bakery flour for institutional food processors.
Each product has a different selling price, variable processing cost and market demand profile. Profitability should be evaluated product-wise on contribution per tonne. A higher selling price does not automatically mean higher contribution – incremental processing, packaging and quality-control costs must be factored in. Quality testing for parameters such as bleach figure, acetic acid reagent response and potassium iodide reaction determines whether maida meets bakery-grade or industrial-grade specifications, affecting realisation.
Shifting even a small proportion of output from generic maida to higher-value bakery flour can improve EBITDA margin if incremental costs are controlled. Similarly, wheat bran – traditionally a low-value by-product sold as cattle feed – can be channelled into value-added products. Consumer preferences are also shifting toward whole wheat atta and fortified wheat flour products, opening additional revenue streams from the same plant.
For product-specific financial analysis, refer to Bakery Flour Manufacturing Plant Project Report & DPR and Wheat Bran Processing & Value Addition Project Report.
Common Financial Modelling Mistakes in Flour Mill DPRs
Many generic wheat flour, maida and suji plant project reports contain errors that can mislead investors and banks. The most common mistakes include:
- Overestimating capacity utilisation from Year 1 – assuming 90% when 60% is more realistic for a new plant.
- Using unrealistic extraction percentages inconsistent with the proposed machinery configuration.
- Assuming constant wheat and product prices across the entire projection period.
- Ignoring store losses, quality variation and moisture adjustments during storage and processing wheat.
- Underestimating working capital – particularly receivable and inventory holding periods.
- Omitting maintenance, replacement capex and regular maintenance of machinery, which is critical to avoid technological obsolescence in milling operations.
- Using incorrect depreciation rates or methods not aligned with the Income Tax Act.
- Confusing accounting ROI with project IRR – these are fundamentally different metrics.
- Calculating IRR from PAT rather than from properly constructed cash flows.
- Double counting interest or capital expenditure between the P&L and cash-flow statement.
- Assuming favourable product-mix realisations without sales evidence or offtake contracts.
- Presenting five-year projections as complete economic life without considering residual value and working capital recovery.
Financial statements in DPR should cover 5 to 10 years projections. At Project Report Bank, the approach is to prepare customised, transparent financial models rather than using generic templates that are copied across multiple flour mill DPRs without adjusting for location, scale or market reality.
How Banks and Financial Institutions Evaluate Maida & Suji Plant Projects
Banks evaluating a Maida and Suji plant term loan look beyond projected PAT. Typical appraisal areas include promoter background and financial capacity, total project cost and means of finance, market feasibility, technical viability and the project implementation schedule. Industry project reports identify raw material availability, utility requirements, and market demand as central feasibility considerations, and banks expect these to be addressed.
Key questions bankers ask include: Are wheat price and selling-price assumptions reasonable? What is the source of market data? Are extraction rates consistent with the proposed machinery? How sensitive is DSCR to adverse movements in cost or revenue? Is the promoter margin adequate?
Properly prepared CMA Data, projected balance sheet, P&L and cash-flow statements – all aligned with DPR assumptions – are essential for wheat flour mill bank loan proposals. A Detailed Project Report covers market survey and feasibility analysis, giving lenders a structured basis for credit evaluation. While consultants like Project Report Bank assist in preparing bankable DPRs and financial projections, final loan approval always depends on each bank’s internal policy and risk assessment. For professional help with structured proposals, see Bank Finance DPR & Loan Proposal Assistance.
Practical Strategies to Improve ROI and Reduce Investment Risk
Improving returns on a Maida and Suji plant investment requires action on multiple fronts:
- Choose optimal plant capacity rather than the largest available. A phased expansion approach – starting at 100 TPD and adding capacity once market demand is validated compared to initial projections – avoids unnecessary capital lock-up.
- Improve wheat procurement efficiency by timing purchases around harvest season, maintaining strict quality control to avoid high-moisture wheat grains (which reduce extraction and increase drying cost), and using proper storage practices.
- Monitor extraction efficiency daily. Even a 1% improvement in Maida recovery, sustained over a year, can add ₹30–50 lakh to revenue with minimal incremental cost.
- Build a balanced customer portfolio – institutional buyers for volume stability, wholesalers for reach and retailers for margin. Negotiate realistic credit terms; every additional day of receivable collection locks up working capital and increases finance cost.
- Use conservative base-case assumptions and scenario analysis before finalising term-loan amount and repayment tenor. Adequate working capital buffers protect against seasonal wheat price spikes and demand fluctuations.
- Periodically review product-wise contribution margins. If bran realisation improves or bakery flour demand grows in your region, adjusting the product mix can enhance EBITDA and DSCR.
Each of these strategies feeds directly into improved ROI, IRR, NPV and DSCR, reducing the risk of default and making the wheat milling plant investment more attractive to both the promoter and the lender.
Why a Professional DPR and Financial Model Matter
A professional, customised Detailed Project Report for a Maida and Suji plant is fundamentally different from a generic project profile available in pdf format from various sources. The difference lies in the depth of financial analysis, the specificity of assumptions and the acceptability to banks and investors.
A robust financial model ties together technical capacity, capital cost, wheat procurement plan, operating expenses, financing structure, tax assumptions and realistic production ramp-up into a single integrated framework. The analytical outputs should include project cost estimate, means of finance, profitability projections, ROI/ROCE, project and equity IRR, NPV, payback, break-even analysis, DSCR and multi-variable sensitivity analysis – all internally consistent.
Project Report Bank provides CA-led advisory services including DPR preparation, financial projections, financial modelling, CMA Data, feasibility studies and investment appraisal for wheat flour, Maida, Suji, mini flour mill and diversification projects. The focus is always on defensible assumptions and transparent calculations rather than attractive-looking numbers.
If you are planning a Maida and Suji manufacturing facility, a customised DPR and financial model – aligned to your capacity, location, machinery selection and proposed product mix – is a worthwhile investment before committing to the project itself.
CA Manish Gugliya FCA, DISA (ICAI) More than 20 years of professional experience in project reports, financial projections, CMA Data, project finance and business advisory.
Financial Disclaimer: All financial projections, ratios and return estimates presented in this article are illustrative and based on assumed parameters. They do not constitute guarantees of future performance or investment returns. Actual project economics will depend on location, scale, market conditions, financing terms, regulatory environment and quality of execution. Professional advice should be obtained before making investment or financing decisions.
Frequently Asked Questions (FAQ)
The following FAQs address practical questions entrepreneurs commonly ask beyond the main explanations on ROI, IRR, NPV and payback for Maida and Suji plants.
What is a realistic time frame to complete a Maida & Suji plant and start commercial production?
Typical implementation timelines in India involve 3–4 months for approvals and land readiness, 4–8 months for civil construction and machinery delivery, and 1–2 months for erection, commissioning and trial runs for a medium-size roller flour mill. The total duration from project conceptualisation to stabilised commercial production can easily be 12–15 months, depending on land status, machinery vendors and funding tie-ups. The facility that can process 40 MT of chakki atta daily or a 100 TPD integrated line will have different timelines based on complexity and automation level.
How does a Maida & Suji plant differ financially from a pure chakki atta or whole wheat flour mill?
An integrated Maida–Suji–Atta roller flour mill requires higher capital cost due to additional equipment (purifiers, plansifters, bleachers) compared with a simpler chakki-based whole wheat atta plant. However, it offers diversified revenue streams – Maida, Suji, bakery flour and bran – compared with a single-product chakki atta operation that primarily sells whole wheat flour with consumed bran. The growth potential and product differentiation justify a different ROI and IRR assessment. The wheat is cultivated across various regions, and factor such as gluten content, protein level and starch composition influence which products can be profitably extracted from a given variety of wheat.
Can a mini flour mill still justify detailed ROI and IRR analysis?
Absolutely. Even a mini flour mill project with total capital investment of Rs. 5.38 crore and a plant capacity of 40 MT per day should be evaluated with proper ROI, IRR, payback and sensitivity analysis. Bank loans and promoter capital are still significant at this scale. While organisations such as Engineers India Research Institute provide general project profiles, Project Report Bank focuses on customised CA-led financial modelling and CMA Data tailored to the specific capacity, location and market of small and medium flour mills. With the rate of return for a mini flour mill reported at 40% and break-even at 42%, these benchmarks must be validated against project-specific assumptions before being relied upon for investment decisions.
How frequently should Maida Suji plant financial projections be updated after commissioning?
Initial DPR projections are a starting point. In practice, promoters should review actual performance versus projections quarterly or at least annually, updating assumptions for wheat prices (which are sold at fluctuating mandi rates), selling prices, capacity utilisation and working capital. Updated projections help in discussions with banks about enhancement of limits, restructuring of term loans or planning capacity expansion.
Does fortification or value-added wheat flour significantly change ROI and IRR?
Adding micronutrient fortification (such as iron and folic acid as per FSSAI guidance) or producing specialised bakery flour blends can increase selling price and market access. However, fortification also increases quality-control costs, testing requirements and marketing expenditure. The incremental ROI and IRR impact should be evaluated through a separate mini-business case within the financial model, using realistic value assumptions for the specific market segment being targeted – not assumed to be automatically positive.
Planning a Maida & Suji Manufacturing Plant?
A reliable investment decision requires more than an estimated profit percentage. Obtain a project-specific DPR, financial model, ROI and IRR analysis, working capital assessment and sensitivity study based on your proposed capacity, location, machinery and financing structure.
CA Manish Gugliya | Project Report Bank
Enquire through the website’s verified WhatsApp contact facility for professional advisory and Detailed Project Report preparation.