Key Takeaways
As a practising Chartered Accountant and project finance consultant, I have seen numerous dairy projects where large installed capacity does not translate into profitability simply because the promoter never properly assessed the break even point relative to realistic throughput, cost structure and product mix.
- Dairy plant break-even analysis determines the sales volume, revenue and capacity utilisation at which total revenue equals total costs – the point where the dairy enterprise stops incurring operating losses and starts generating profit.
- The breakeven point depends on contribution per litre (selling price minus variable cost), the dairy plant fixed cost burden, milk procurement price, product mix margins and realistic capacity utilisation – not merely on processing higher milk volumes.
- Breakeven milk price and breakeven prices for different products are central to project feasibility, bankability and decision making for any milk processing plant in India.
- In DPRs and CMA Data, lenders closely analyse break-even capacity utilisation, DSCR and sensitivity analysis before sanctioning term loans; projects with thin margins of safety face scrutiny.
- Promoters can reduce the break even point through better capacity planning, product mix optimisation, procurement efficiency, energy management and fixed-cost control.
Introduction – Why Break-Even Decides Dairy Plant Survival
Many Indian dairy processing plants – from 1 LLPD to 5 LLPD capacities – install substantial machinery and infrastructure, yet struggle with cash losses month after month. The reason is straightforward: their actual milk production throughput, contribution margins and product mix remain below the required break even point. A plant processing 2 lakh litres per day on paper means nothing if only 40% of that capacity is utilised and the contribution per litre barely covers fixed overheads.
Break even analysis is not simply about processing more milk. It is about ensuring that sales realisation minus variable costs – the contribution – is sufficient to cover the dairy plant fixed cost structure at a realistic, sustainable capacity utilisation. This distinction is essential for any dairy operation seeking project finance or evaluating long term viability.
In India, promoters approaching banks for term loans must demonstrate, through DPRs and CMA Data, that their break-even capacity is achievable within the first few years. Concepts like breakeven milk price in rupees per litre, break even point in litres per day, and breakeven prices for value-added products feed directly into practical business decisions – pricing, procurement strategy, expansion timing and marketing focus. This article serves as a practical guide from a Chartered Accountant and project finance consultant, tailored for dairy entrepreneurs, investors and lenders evaluating dairy plant profitability analysis.
What Is Dairy Plant Break-Even Analysis?
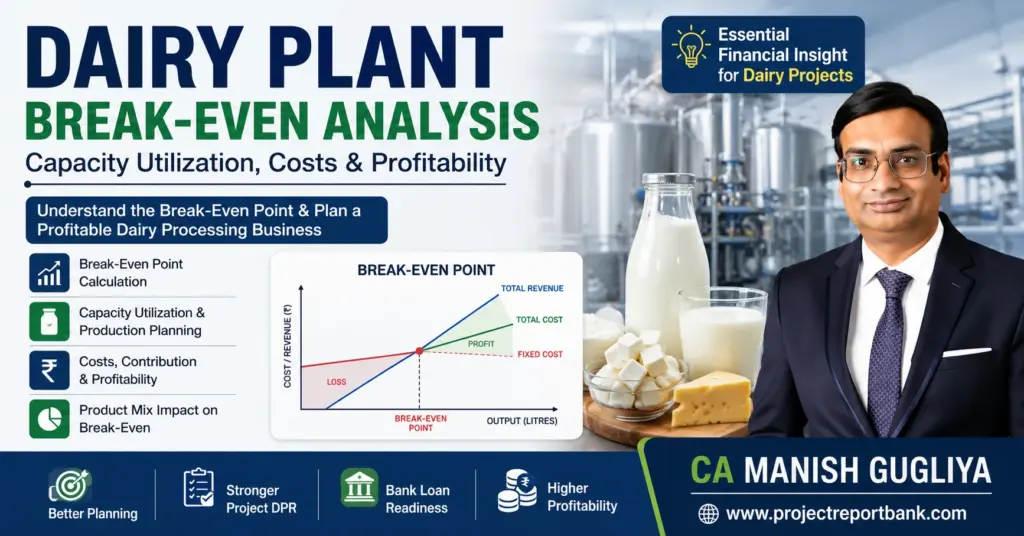
Break-even analysis in a dairy processing plant is the assessment of the sales level, milk volume and capacity utilisation at which total revenue equals total costs. At the break even point, the plant has no operating profit and no operating loss – the contribution generated just covers all operating fixed costs under the given assumptions. Break-even analysis determines the production volume needed to cover all costs and avoid losses.
There are three dimensions to understand:
- Break-even sales value (₹ per year): the total revenue required to cover all costs.
- Break-even quantity (litres or kg): the volume of milk processed or products sold to reach zero-profit.
- Break-even capacity utilisation (%): the percentage of installed or practical capacity at which the plant breaks even.
It is also important to distinguish between accounting break-even (covering all operating costs including depreciation), cash break-even (covering only cash outflows, excluding non-cash charges like depreciation) and overall project profitability (which must also cover finance cost, tax and returns to promoters). Breakeven milk price can be derived by dividing total costs by milk production volume, helping promoters compare this figure with the expected market milk price and determine whether the dairy enterprise is commercially viable.
Why Break-Even Analysis Is Critical for a Dairy Processing Plant
Dairy projects are high-volume, low-margin businesses where small changes in cost or realisation can sharply move the break even point. Raw milk and dairy products have perishable traits that impact cost calculations – you cannot stockpile unsold milk the way a manufacturer might hold steel inventory. This perishability, combined with thin margins on standard pouch milk, makes even analysis of break-even a survival exercise rather than an academic one.
Key sector-specific factors include:
- High raw milk procurement cost (often 70–90% of total cost for fluid milk)
- Daily collection, testing and chilling requirements
- Cold chain logistics and refrigeration energy consumption
- Processing losses during pasteurisation, standardisation and conversion
- Packaging material costs varying by format (pouch, cup, carton)
- Distribution margins, returns, spoilage and expiry
- Seasonal fluctuations that affect raw milk supply and procurement prices – flush season surplus versus lean season scarcity
Fixed investments in pasteurisation lines, homogenisers, milk silos, cold rooms, chilling centres and boilers create a sizeable fixed cost base that continues irrespective of daily milk production. Seasonal milk availability and milk price volatility further destabilise the break-even level. Detailed break-even analysis forms a core part of dairy processing plant feasibility and project viability assessment.
Understanding Dairy Plant Cost Structure – Fixed vs Variable
Correctly classifying fixed and variable costs is essential for accurate break-even and breakeven cost calculations. Misclassification leads to distorted contribution figures and unreliable break-even estimates in DPRs and financial projections.
Fixed Costs
Fixed costs do not change with the volume of milk processed. These include salaries of permanent staff (plant manager, quality control, administrative personnel), office overheads, insurance premiums, security expenses, AMC contracts for machinery, depreciation on civil works and equipment, licence fees and minimum demand charges for power and water utilities. Whether the plant processes 50,000 litres or 2 lakh litres on a given day, these costs remain largely constant.
For break-even analysis, some DPRs treat interest on term loans as a fixed cost component, while operating break-even may exclude finance cost entirely. The treatment depends on whether the analysis targets operating (EBITDA-level) break-even or full project-level break-even including debt service.
Variable Costs
Variable costs fluctuate directly with production volume. The largest component is raw milk procurement – cow milk averaging around ₹36–38 per litre and buffalo milk around ₹48–50 per litre in recent years. Other variable items include milk collection and testing cost, transport from BMCs, cultures and additives for curd or yoghurt, packaging material, processing consumables, production-linked power and fuel, chilling and refrigeration load, distribution freight and sales commission.
Research published in the International Journal of Economic Entomology found that variable cost share in cooperative dairy plant processing in Haryana was approximately 70–75% of total processing cost, with raw milk procurement alone accounting for over 90% of total cost for full-cream milk. Semi-variable items like maintenance and power must be prudently split when preparing CMA Data and financial projections.
Contribution Margin and Dairy Plant Economics
Contribution is defined as sales revenue minus variable cost. The contribution margin is the selling price per unit minus the variable cost per unit. For each litre or kg processed, contribution indicates how much goes towards recovery of fixed costs and, eventually, profit.
The contribution margin ratio (contribution ÷ sales) shows what proportion of each rupee of sales absorbs fixed costs. In a dairy plant, relying only on total sales or milk production volume can be misleading if the contribution margin is weak due to high milk procurement price, aggressive retail pricing or costly distribution.
Value-added dairy products like paneer, ghee, butter, flavoured milk or fermented products generally carry higher contribution margins than standard pouch milk. According to CRISIL Research, EBITDA margins for processed liquid milk are approximately 4–6%, while packaged curd reaches 10–12%, paneer 9–11% and specialty cheese 11–13%. These differences mean that product mix decisions directly influence the dairy plant break-even capacity and overall profitability.
Detailed contribution analysis for each SKU is a key step in integrated dairy plant revenue model and product mix planning.
Dairy Plant Break-Even Calculation – Formulas & Simple Illustration
Break-even can be calculated in sales value, litres, or capacity utilisation using standard cost–volume–profit formulas adapted to dairy operations.
Key formulas:
- Break-Even Sales (₹) = Fixed Costs ÷ Contribution Margin Ratio
- Break-Even Quantity (litres) = Fixed Costs ÷ Contribution per Litre
- Break-Even Capacity Utilisation (%) = Break-Even Production ÷ Practical Capacity × 100
Illustrative example (1 LLPD plant – all figures are illustrative only):
| Particulars | Assumption |
|---|---|
| Installed Capacity | 1,00,000 LPD |
| Practical Capacity (90%) | 90,000 LPD |
| Annual Operating Days | 330 |
| Annual Practical Throughput | 2,97,00,000 litres |
| Average Selling Price | ₹54 per litre |
| Variable Cost per Litre | ₹47 per litre |
| Contribution per Litre | ₹7 per litre |
| Contribution Margin Ratio | 12.96% |
| Annual Fixed Costs | ₹8.50 crore |
| Break-Even Volume | 1,21,42,857 litres/year |
| Break-Even Sales | ₹65.57 crore |
| Break-Even Capacity Utilisation | ~40.9% of practical capacity |
This means the plant must sell approximately 36,800 litres per day just to cover all fixed and variable costs – any volume above this generates operating profit. Actual break-even will differ by location, procurement model, milk composition, product mix, utilities cost and financing structure.
Practical Break-Even Example for a Hypothetical Dairy Plant
To demonstrate how all variables interact, consider a hypothetical 2 LLPD milk processing plant with a diversified product mix. The example numbers below are purely illustrative and should not be treated as a benchmark for any specific project.
| Particulars | Assumption (Illustrative) |
|---|---|
| Installed Capacity | 2,00,000 LPD |
| Practical Capacity (85%) | 1,70,000 LPD |
| Annual Operating Days | 340 |
| Annual Milk Throughput at 70% Utilisation | 4,04,60,000 litres |
| Weighted Average Selling Realisation | ₹58 per litre |
| Weighted Average Variable Cost | ₹49 per litre |
| Weighted Contribution per Litre | ₹9 per litre |
| Contribution Margin Ratio | 15.52% |
| Total Annual Fixed Costs | ₹18.00 crore |
| Break-Even Sales (₹) | ₹115.98 crore |
| Break-Even Volume | 2,00,00,000 litres/year |
| Break-Even Capacity Utilisation | ~34.6% of practical capacity |
At 70% utilisation, this plant would generate contribution of approximately ₹36.41 crore against fixed costs of ₹18 crore, yielding an operating surplus before interest and tax. However, if utilisation dropped to 40% or contribution fell due to procurement price increases, the margin of safety would shrink rapidly. Promoters should simulate such scenarios using the methodology described in dairy processing plant financial projections.
Capacity Utilisation and Dairy Plant Profitability
High fixed investments make capacity utilisation one of the strongest drivers of profitability. Capacity utilization impacts fixed costs per unit at different processing rates – the same ₹18 crore in annual fixed costs spread over 40% utilisation results in a per-litre fixed cost more than double that at 80% utilisation. Dairy processing has significant potential for economies of scale when higher throughput is achieved.
A realistic capacity ramp-up schedule is usually built into DPRs – for example, 40–50% in Year 1, 60% in Year 2, 75–80% by Year 3. Assuming 100% utilisation from day one is a common error. Practical constraints include developing the milk procurement network (sourcing from farmers, dairy cooperative society channels and non-member suppliers), building market penetration for the brand, securing distribution reach and obtaining regulatory approvals.
Studies from regions like district Etawah in Uttar Pradesh and various zones in Haryana confirm that plants processing milk from milch animals – both cow and buffalo – face vastly different per-litre economics depending on utilisation levels. Notably, to achieve 5% profitability in some farm-level analyses, milk yield must increase by approximately 21%, underscoring how volume efficiency drives returns.
Capacity decisions taken at the project stage directly influence feasibility, and promoters should carefully study dairy plant capacity planning for 1 LLPD, 2 LLPD, 5 LLPD and large plants before finalising investment.
Milk Procurement Price, Breakeven Milk Price and Sensitivity
Raw milk procurement price is generally the largest single cost component. Even a ₹1–2 per litre change can significantly alter contribution, the break even point and overall project viability. Procurement prices have risen steadily – cow milk from approximately ₹29.4/L in 2021-22 to ₹36.7/L in 2025-26, and buffalo milk from ₹39.8 to ₹49.2 over the same period.
An increase in procurement rate increases variable cost per litre, reduces contribution per litre and pushes up the break-even milk volume and break-even sales value. The concept of breakeven milk price represents the minimum selling price per litre at which the plant just covers all costs for a given cost structure and product mix. Breakeven prices vary based on production costs and profit goals – they are not static.
For comparison, breakeven prices in international markets also vary widely. Breakeven price for milk in the Czech Republic ranges from EUR 28 to EUR 38 per 100 litres, with Czech dairy farms needing 6,706 to 13,151 litres of milk yield per cow for zero profitability. In the United States, a breakeven milk price for a Minnesota dairy farm is $17.78 per hundredweight including interest, while a dairy farm must sell milk for $16.67 per hundredweight to cover costs only. Milk prices in the EU range from EUR 28 to EUR 38 per 100 litres, confirming that breakeven prices allow managers to make informed marketing decisions globally. These figures from various international journal sources highlight that breakeven analysis helps determine minimum profitability requirements regardless of geography.
Illustrative Sensitivity – Impact of Procurement Price Change:
| Procurement Price Change | Variable Cost/L | Contribution/L | Break-Even Volume (Illustrative) |
|---|---|---|---|
| Base Case (₹38/L) | ₹49 | ₹9 | 2.00 crore litres |
| +₹1/L (₹39/L) | ₹50 | ₹8 | 2.25 crore litres |
| +₹2/L (₹40/L) | ₹51 | ₹7 | 2.57 crore litres |
| +₹3/L (₹41/L) | ₹52 | ₹6 | 3.00 crore litres |
A ₹3 increase in procurement cost raises break-even volume by 50% in this illustrative scenario – a significant economic impact. Strategies to manage procurement risk include building strong dairy plant milk collection and procurement infrastructure, establishing long-term farmer relationships and efficient BMC networks.
Product Mix, Contribution and Break-Even
Most commercial dairy plants in India process multiple products – pasteurised milk, curd, dahi, paneer, ghee, butter, cream, flavoured milk and other value-added items. Dairy plants often process multiple products, each with different margins, and the overall plant break-even depends on the weighted average contribution of the entire product mix.
High-volume but lower-contribution products (like price-sensitive pouch milk) provide capacity utilisation and cash flow but thin margins. Value-added higher-contribution products (branded paneer, ghee, flavoured milk) can significantly lower the break-even sales volume. A Haryana study found profit margins of approximately 23.8% over cost for dahi, 15.2% for double-toned milk and 11.9% for ghee – confirming that product mix has a direct bearing on dairy plant profitability.
Promoters should simulate different scenarios – for instance, 70% milk + 30% value-added versus 50% milk + 50% value-added – and observe the impact on break-even. Logistics, shelf life, fat and SNF norms, packaging formats and distribution margins also vary by product, so careful costing in kg and litres is needed.
Product-Wise Contribution Analysis – Illustrative Table
The following table uses purely hypothetical figures to demonstrate how contribution varies across dairy products:
| Product | Selling Price (per unit) | Variable Cost (per unit) | Contribution (per unit) | Contribution Margin (%) |
|---|---|---|---|---|
| Pasteurised Milk (per litre) | ₹54 | ₹48 | ₹6 | 11.1% |
| Curd / Dahi (per kg) | ₹70 | ₹55 | ₹15 | 21.4% |
| Paneer (per kg) | ₹280 | ₹240 | ₹40 | 14.3% |
| Ghee (per kg) | ₹580 | ₹510 | ₹70 | 12.1% |
| Butter (per kg) | ₹420 | ₹365 | ₹55 | 13.1% |
| Flavoured Milk (per litre) | ₹90 | ₹68 | ₹22 | 24.4% |
Actual numbers depend heavily on region, procurement arrangement, fat and SNF composition, packaging sizes, distribution model (B2B versus retail) and plant efficiency. Promoters must build their own cost sheets on a project-specific basis rather than copying any estimated benchmark. Detailed product-mix planning through an integrated dairy plant revenue model and product mix framework is a powerful tool for improving dairy plant profitability analysis.
Revenue Model, Project Cost and Their Impact on Break-Even
The revenue model – procurement to processing to product mix to sales realisation – combined with the cost structure collectively determines break-even sales and dairy plant profitability. Higher-than-necessary project cost (excessive civil work, oversized machinery, redundant automation) increases depreciation and interest, raising the fixed-cost burden and the required break-even turnover.
Careful evaluation of dairy processing plant machinery and equipment cost in India and matching it with realistic capacity planning can prevent over-capitalisation. The detailed breakdown of dairy plant project cost and means of finance addresses project budgeting, while this article focuses on how those costs influence break-even. Higher debt demands higher operating surplus and margin of safety to comfortably service EMIs. A healthy Return on Assets is above 8% on average, and profit goals should cover debt service and capital replacement to support future investment and business growth.
Utilities, Operating Costs and Dairy Processing Cost per Litre
Utilities – electricity, steam, refrigeration, chilled water and effluent treatment – form an important share of dairy plant operating cost per litre. Inefficient boilers, outdated refrigeration systems or undersized utility networks can increase energy consumption per litre, raising variable costs and breakeven cost.
Improving energy efficiency, utility design and heat recovery can lower processing cost per litre and improve contribution margin. Oversized utilities add unnecessary fixed costs while undersized utilities restrict throughput and delay achieving break-even. Promoters seeking deeper technical discussion should study dairy plant utilities including power, water, steam, refrigeration and ETP considerations.
Working Capital, Liquidity and Break-Even Sustainability
Achieving P&L break-even does not automatically mean the dairy plant has adequate cash flow or working capital. Liquidity must be analysed separately. Key working capital components include daily milk procurement payments to farmers or suppliers, inventory of finished goods and packing materials, credit allowed to distributors and modern trade, and time lags in receiving sales proceeds.
An under-financed project may technically operate above break-even but still face cash crunch due to long receivable cycles, inadequate working capital limits or seasonal procurement bulges. The cash conversion cycle determines whether projected sales above break-even can be sustained without continuous external funding. Comprehensive DPRs must align operating break-even analysis with realistic dairy plant working capital requirement planning.
Break-Even vs DSCR and Loan Repayment Capacity
Operating break-even measures where revenue covers costs. DSCR (Debt Service Coverage Ratio) measures whether cash accruals can meet scheduled term-loan instalments and interest. A plant may reach operating break-even at 55–60% capacity utilisation but still fail to achieve adequate DSCR if loan instalments are heavy, the grace period is short or capital cost is high.
Banks look beyond break-even to ensure that projected cash flows at realistic capacity utilisation provide a comfortable DSCR during the entire loan tenure – typically 1.5x or higher. While break-even focuses on Revenue = Cost, DSCR focuses on Cash Accruals ÷ Debt Service. Both must be analysed together. The internal resource on dairy project DSCR and loan repayment capacity provides deeper coverage of DSCR calculations.
Break-Even Analysis within DPRs, Financial Projections and CMA Data
While preparing or reviewing DPRs for dairy plants, I integrate break-even analysis with projected P&L, balance sheet and cash-flow statements across multiple pages of projections. Projected capacity utilisation percentages, expected sales realisation, milk procurement price assumptions and product mix are fed into year-wise financial projections to compute contribution, break-even sales and profitability.
CMA Data submitted to banks incorporates these projections – often as a pdf package – and the underlying break-even assumptions must be logical and defendable during bank appraisal. A practising Chartered Accountant assists promoters in preparing, reviewing and explaining these projections; the professional role is to ensure financial coherence, not to guarantee outcomes. A break-even calculator or spreadsheet built into the projections allows quick sensitivity testing.
Detailed guidance is available through internal resources on dairy processing plant CMA Data for bank loan preparation.
Break-Even in Dairy Project Feasibility and Bank Appraisal
In feasibility studies, break-even metrics are evaluated alongside IRR, NPV, payback, ROI and DSCR. Investment feasibility can be assessed through break-even analysis in dairy operations by checking whether projected sales surpass the break even point by a sufficient margin across the project life. The break-even point indicates how far actual sales can drop before losses occur – a critical test for lenders.
Banks assess whether the proposed capacity is justified by milk availability and market demand, whether the promoter’s assumptions on milk production and sales are realistic, and whether the project can handle lean months without slipping below break-even. Break-even capacity utilisation and contribution margins are commonly stressed in sensitivity analysis during dairy project term loan assessment. Additional context on financing structures is covered in the guide on bank loan and project finance for dairy processing plants.
Margin of Safety in Dairy Plants
Margin of Safety = Actual or Projected Sales – Break-Even Sales. As a percentage: Margin of Safety (%) = (Actual Sales – Break-Even Sales) ÷ Actual Sales × 100.
A dairy plant operating only marginally above break-even – say with a 5–10% margin of safety – remains vulnerable to small adverse changes. Consider two scenarios:
- Plant A: Projected sales ₹130 crore, break-even sales ₹117 crore → margin of safety 10%. A ₹13 crore revenue shortfall wipes out the cushion entirely.
- Plant B: Projected sales ₹130 crore, break-even sales ₹91 crore → margin of safety 30%. The plant can absorb ₹39 crore in revenue decline before hitting losses.
Lenders and investors prefer projects with a healthy margin of safety over the projected period, not just a single year barely above break-even. Break-even analysis supports pricing decisions for dairy products and helps management monitor whether the business is maintaining adequate distance from the loss zone.
Sensitivity Analysis – How Changes Affect Break-Even
Dairy project break-even analysis is incomplete without sensitivity analysis. The main variables to test include:
- Milk procurement price increase
- Selling price decrease due to competition
- Fall in capacity utilisation due to raw milk shortage or market issues
- Rise in power and fuel costs
- Change in product mix between pouch milk and value-added items
- Increase in fixed overheads due to new CAPEX or salary revisions
Illustrative Sensitivity Table:
| Scenario | Change | Estimated Impact on Break-Even Utilisation |
|---|---|---|
| Base Case | – | ~35% of practical capacity |
| Procurement Cost +₹2/L | Variable cost rises | ~44% |
| Selling Price -5% | Revenue falls | ~42% |
| Utilisation drops to 50% | Lower volume | Fixed cost/L rises; margin shrinks |
| Power Cost +15% | Variable cost rises | ~37% |
| Value-Added Share +15% | Higher contribution | ~30% |
Procurement price, product realisation and capacity utilisation typically have the greatest impact. These should be closely monitored by management and discussed transparently with lenders. Sensitivity analysis connects directly to practical decision making – revising procurement strategy, adjusting product mix or reworking pricing when early-warning signals show break-even pressure. Breakeven analysis helps determine minimum profitability requirements under each scenario.
How to Reduce the Break-Even Point in a Dairy Processing Plant
The objective is not only to calculate break-even but to strategically lower it to safer, more achievable utilisation levels.
- Improve milk procurement efficiency by reducing collection losses, optimising transport routes and negotiating on a fat/SNF basis to lower effective raw material cost per litre.
- Increase capacity utilisation by strengthening the sales network, adding distribution channels and building brand presence – every additional litre sold above break-even contributes directly to profit.
- Optimise product mix towards higher-contribution value-added products like paneer, ghee, curd and flavoured milk, which can materially reduce the break-even sales volume.
- Improve energy efficiency through modern boilers, variable-frequency drives on refrigeration compressors and heat recovery systems to lower processing cost per litre.
- Control non-essential fixed overheads – avoid redundant manpower, excessive administrative expenses or over-engineered infrastructure that inflates depreciation.
- Manage working capital efficiently – reducing receivable days and optimising inventory supports sustainable operations above break-even without liquidity stress.
Promoters should periodically revisit break-even calculations as the plant scales, the product portfolio changes or new CAPEX is undertaken, rather than treating break-even as a one-time DPR calculation.
Common Break-Even Analysis Mistakes in Dairy Projects
Miscalculations in break-even can lead to under-estimated funding needs, unrealistic projections and financial stress.
Common errors include:
- Assuming unrealistically high capacity utilisation from Year 1 (some DPRs project 80–90% immediately)
- Misclassifying semi-variable costs as fully fixed or fully variable
- Ignoring product mix and using a single average margin for all products
- Overlooking processing losses, handling wastage and expiry
- Assuming constant milk procurement prices and ignoring seasonal variations
- Overestimating selling price due to optimistic branding assumptions
- Ignoring distribution margins, trade returns and retailer commissions
- Focusing only on revenue rather than contribution
- Confusing accounting break-even with cash break-even
- Equating break-even with DSCR and overall loan repayment capacity
Promoters should have their cost sheets, contribution analysis and break-even calculations independently reviewed by experienced consultants or Chartered Accountants familiar with dairy projects and agriculture economics. Correcting these mistakes early – at the DPR stage – is far easier and less costly than trying to fix them after major capital investment.
Professional Insight from CA Manish Gugliya
In my practice of preparing and reviewing DPRs for dairy plants across India, the most common pattern I observe is promoters fixating on installed capacity – “We will set up a 5 LLPD plant” – without rigorously evaluating whether the milk supply network, product sales channels and brand strength can realistically achieve the break-even capacity utilisation within the projected timeframe. The key question is not “How much can the plant produce?” but “At what sustainable capacity utilisation and contribution margin will the project comfortably cover its fixed costs, working capital needs and debt obligations?”
I evaluate consistency between capacity planning, milk procurement strategy, product mix, pricing assumptions, operating cost estimates, working capital projections, DSCR and sensitivity analysis. In one instance, a promoter’s DPR projected 75% utilisation in Year 1 for a greenfield plant in a region where the procurement network had not yet been established – the company had no member or non-member farmer agreements in place. The bank rightly returned the proposal. After revising to a conservative 40% Year 1 ramp-up with detailed procurement plans, the project was sanctioned.
I encourage promoters to treat break-even analysis as a central strategic tool – not just a target figure inserted in a DPR to satisfy lenders. Profit goals must be realistic, returns must justify the investment on a long-term basis, and the ability to withstand adverse changes must be demonstrated through credible sensitivity analysis.
Frequently Asked Questions (FAQ)
The following FAQs address common questions that arise when promoters and borrowers discuss dairy plant break-even analysis with consultants and lenders.
What is a realistic break-even capacity utilisation for a new dairy plant in India?
There is no single benchmark. Many DPRs assume a ramp-up from around 40–50% capacity utilisation in Year 1 to 70–80% over a few years. Actual break-even capacity depends on fixed-cost levels, contribution margin and financing structure. A plant with lower fixed costs and higher-margin products may break even at 30–35% utilisation, while a capital-intensive SMP or ghee-focused plant may need 50–60% or more.
How often should we recalculate our dairy plant break-even point?
Revisit break-even at least annually and whenever there are major changes in milk procurement price, milk price realisation, product mix, capacity utilisation, utility tariffs or new CAPEX. Seasonal variations in milk availability across months can also shift the break-even point during lean periods versus flush periods.
How is breakeven milk price useful in day-to-day decision making?
Comparing the current market milk price with the plant’s breakeven milk price helps management decide whether to expand output, renegotiate procurement, adjust the product mix or focus on cost-reduction measures. If the market sell price falls below the breakeven milk price for a particular product line, that line may need to be scaled down or cross-subsidised by higher-margin products.
Does reaching accounting break-even mean the bank will be comfortable with our project?
Banks look beyond accounting break-even to assess DSCR, cash flow stability, margin of safety and sensitivity to adverse scenarios. A project might be at break-even but still fail to meet repayment obligations if cash accruals are inadequate or highly volatile. Lenders prefer projects where projected data shows comfortable debt coverage even under stressed assumptions – not just zero-loss operations.
Can a dairy farm or small plant use the same break-even framework as a large plant?
The framework is the same – fixed costs, variable costs, contribution and break-even formulas apply universally. However, a smaller dairy farm or plant will have different cost structures, lower absolute fixed costs but potentially higher per-litre processing costs due to absence of economies of scale. Each study must use project-specific assumptions rather than relying on general example numbers or comparison with larger operations.
📊 Operations & Financial Planning: Utilities | Revenue Model & Product Mix | Financial Projections | Working Capital | CMA Data | DSCR & Repayment Capacity
🏦 Bank Finance, Viability & Returns: Bank Loan & Project Finance | Term Loan Assessment | Feasibility & Viability | Break-Even Analysis | ROI, IRR & Payback | Sensitivity & Risk Analysis