
Key Takeaways
Cheese plant financial projections are a structured, banker-friendly forecast of revenue, manufacturing costs, profit, cash flow and repayment capacity for a cheese manufacturing plant in India, typically prepared for projects with investment of ₹10 crore and above. These projections form the core of any Detailed Project Report (DPR) submitted for term-loan and working-capital proposals.
A complete cheese plant financial model cannot be prepared by simply applying a flat profit percentage on estimated sales. Because creating financial projections for a cheese manufacturing plant requires unique agricultural and dairy industry variables, the model must be built ground-up from technical assumptions such as milk procurement cost, cheese yield, plant capacity, product mix and capacity utilisation across projected years.
- A five-year financial model forecasts revenue, costs, and cash flow for cheese production, and most banks expect projections covering the full loan repayment period.
- Financial projections include capital investment, operating costs, and revenue forecasts, along with DSCR, break-even analysis and sensitivity testing under adverse conditions.
- Building a cheese plant financial model involves revenue modelling from individual products rather than averaging across all cheese types.
- Banks rely on these projections for sanction decisions, but all results are illustrative and depend on actual performance, promoter credentials and assumptions supplied by the promoter.
- CA Manish Gugliya, FCA and DISA (ICAI), prepares customised cheese plant project reports, DPRs, CMA Data and financial projections for bank loans through ProjectReportBank, without guaranteeing sanction.
Introduction: What Are Cheese Plant Financial Projections and Why Do They Matter?
Cheese plant financial projections are an integrated set of projected financial statements showing revenue, manufacturing costs, overheads, profit, cash flow and balance sheet for a new or expanding cheese manufacturing unit in India. They form the financial backbone of a cheese plant project report and are mandatory for any serious term-loan or working-capital proposal submitted to banks and financial institutions.
Bankers use these projections to assess four things: viability of the cheese manufacturing plant, repayment capacity of the borrower, security coverage for the proposed lending, and need-based working capital limits. Without credible income and expenditure projections, no credit committee can evaluate whether the project deserves financing.
Profitability in the cheese industry cannot be estimated by a general margin percentage. Results depend heavily on cheese types (mozzarella, processed, cheddar), milk sourcing costs, yield efficiency, plant capacity and distribution structure. The global cheese market was valued at USD 98.0 billion in 2025 and is projected to reach USD 153.08 billion by 2034, growing at a CAGR of 5.1% from 2026 to 2034. Rising disposable incomes are accelerating cheese adoption in emerging economies, with 90% of consumers consuming dairy products several times weekly and three-fourths of households regularly using milk, cheese, and butter. India’s cheese demand is growing at an estimated 20% CAGR domestically, making the investment case compelling but the financial analysis demanding.
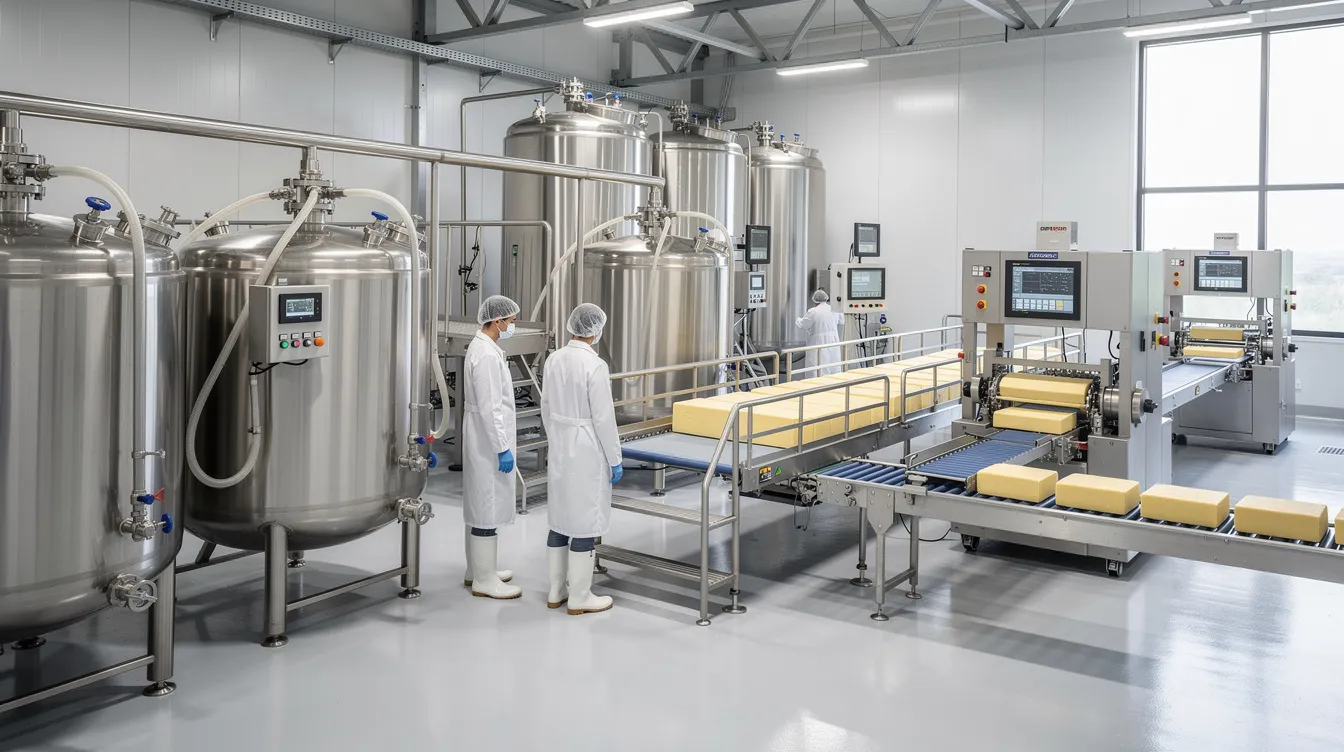
This article is written in the professional voice of CA Manish Gugliya, FCA and DISA (ICAI), a practising Chartered Accountant since 2006 with extensive experience in project reports, cheese plant DPRs, financial projections, CMA Data and bank-loan advisory across India. All examples and figures in this article are purely illustrative. Actual numbers must be customised for each cheese manufacturing plant based on reliable technical and commercial data.
What Is Included in Cheese Plant Financial Projections?
A complete cheese manufacturing plant financial model is not merely a projected profit and loss account. It is a full package of statements, schedules and ratios that banks, financial institutions and investors use to evaluate whether the project is viable, fundable and capable of servicing proposed debt. Documentation should be included for core financial projections, covering income statements and cash flow statements, along with balance sheets, working-capital assessment and ratio analysis.
The major components are listed below, along with their purpose and how they are used during bank appraisal:
| Projection Component | Purpose in Cheese Plant Financial Model | How Banks / Investors Use It |
|---|---|---|
| Project Assumptions | Documents capacity, prices, yields, costs | Verifies reasonableness of inputs |
| Production & Capacity Schedule | Year-wise output by product | Checks ramp-up realism |
| Product-Wise Sales Forecast | Revenue by cheese type and by-products | Validates top-line revenue |
| Raw-Material Consumption | Milk, additives, packaging costs | Assesses cost structure |
| Projected Profit and Loss Account | Annual income and expenditure projections | Evaluates profitability trend |
| Projected Cash Flow Statement | Cash inflows, outflows, closing balances | Tests debt-servicing ability |
| Projected Balance Sheet | Assets, liabilities, net worth position | Checks gearing and coverage |
| Working Capital Assessment | Inventory, receivables, creditors | Determines WC limits |
| Depreciation Schedule | Asset-wise wear and useful life | Validates tax and book depreciation |
| Term-Loan Repayment Schedule | Principal, interest, closing balance | Matches cash flow to repayment |
| DSCR Calculation | Debt service coverage year-wise | Core repayment-capacity indicator |
| Break-Even Analysis | Sales needed to cover all fixed costs | Assesses risk buffer |
| ROI, IRR, Payback | Overall project return metrics | Guides investment decision |
| Sensitivity Analysis | Stress-testing under adverse scenarios | Evaluates downside resilience |
| Financial Ratios | Current ratio, debt-equity, ICR, margins | Benchmark compliance check |
For a detailed discussion on total project cost and investment structure, readers may refer to our article on cheese plant project cost and means of finance.
Key Assumptions for a Cheese Manufacturing Financial Model
The accuracy of cheese plant financial projections depends entirely on the quality of technical and commercial assumptions. These should be supported by machinery quotations, market data, supplier commitments and realistic operating plans, not guesswork.
Capacity and production assumptions:
- Installed milk-processing capacity per day (e.g., 50,000 to 1,00,000 litres/day for medium plants). The cheese manufacturing plant capacity ranges from 5,000 to 10,000 MT annually for commercially viable operations. A detailed discussion on sizing is available in our article on cheese plant capacity and product mix.
- Number of operating days per year: typically 300–330 days, accounting for maintenance shutdowns and seasonal factors.
- Year-wise capacity utilisation: a realistic ramp-up pattern such as 45% in Year 1, 65% in Year 2, 75–80% in Year 3 and stabilising at 85–90% thereafter.
Product mix assumptions:
- Percentage allocation across product categories such as mozzarella cheese, processed cheese and cheddar cheese.
- Production capacity and product mix impact top-line revenue for cheese manufacturing and must be specified at the outset.
Yield and technical assumptions:
- Milk-to-cheese conversion (yield): generally, it takes roughly 10 pounds of milk to produce 1 pound of hard cheese. For mozzarella from standardised cow milk, yield is about 10–11%, and with buffalo milk it may rise to 15–18%. Process losses and by-product (whey) recovery should be estimated from the industrial cheese production process.
Commercial and financial assumptions:
- Milk procurement price (illustrative range: ₹42–₹52 per litre, varying by location and fat content)
- Product-wise ex-factory selling prices, annual price escalation, packaging sizes
- Credit period to customers (30–60 days), supplier credit days, inventory holding period
- Promoter’s contribution, term-loan amount, interest rate at prevailing bank lending rates, repayment period, moratorium
- Depreciation method and income-tax assumptions as applicable
- Labour, energy, refrigeration and distribution cost estimates
All assumptions must be documented and backed by quotations, land and building estimates, milk procurement plans and market enquiries.
Estimating Project Cost, Plant Setup and Capital Expenditure
Any cheese manufacturing plant financial projection starts from the total capital expenditure. CapEx often includes heavy processing equipment and specialised installations for dairy operations, making this the foundation of the entire financial model.
Major cost heads include:
- Land purchase or leasehold premium and site development, including land registration and boundary development
- Civil construction (processing hall, cold rooms, utilities area, admin block, effluent treatment)
- Plant and machinery (pasteurisers, cheese vats, moulding lines, slicing and packaging machines, CIP systems)
- Refrigeration and cold rooms, boiler and utility infrastructure
- Quality-control laboratory, vehicles, furniture and fixtures
- Pre-operative expenses: interest during construction, trial-run costs, establishment expenses
Machinery costs are the largest portion of capital expenditure in a cheese plant. For a detailed breakdown of equipment and costs, readers may refer to our dedicated article. For overall cheese manufacturing plant setup cost in India, a separate discussion covers CapEx components in depth.
Depreciation in the financial model flows from the final fixed-asset schedule, and CapEx timing (spread over 9–12 months) affects cash flow, interest during construction and the project-implementation schedule used in the DPR.
Production and Capacity-Utilisation Projections
Production planning links technical capacity with realistic ramp-up and is the starting point for both revenue and raw-material calculations in the cheese manufacturing plant financial model.
The basic formula is:
Projected Production (MT) = Installed Annual Capacity (MT) × Capacity Utilisation (%) × (Operating Days ÷ Design Days)
For example, a plant with 6,000 MT/year installed capacity operating at 60% utilisation would produce approximately 3,600 MT of cheese in that year.
| Year | Capacity Utilisation (%) | Approximate Production (MT) |
|---|---|---|
| Year 1 | 45% | 2,700 |
| Year 2 | 60% | 3,600 |
| Year 3 | 75% | 4,500 |
| Year 4 | 85% | 5,100 |
| Year 5 | 90% | 5,400 |
All figures above are purely illustrative for a hypothetical 6,000 MT/year cheese manufacturing plant.
Banks generally expect a gradual ramp-up rather than 100% utilisation from Day 1. First-year production is often lower due to trial production, process stabilisation and seasonal milk availability constraints. The actual pounds of cheese produced per hundredweight of milk processed must be monitored for efficiency, as yield factors directly affect cost per kilogram.
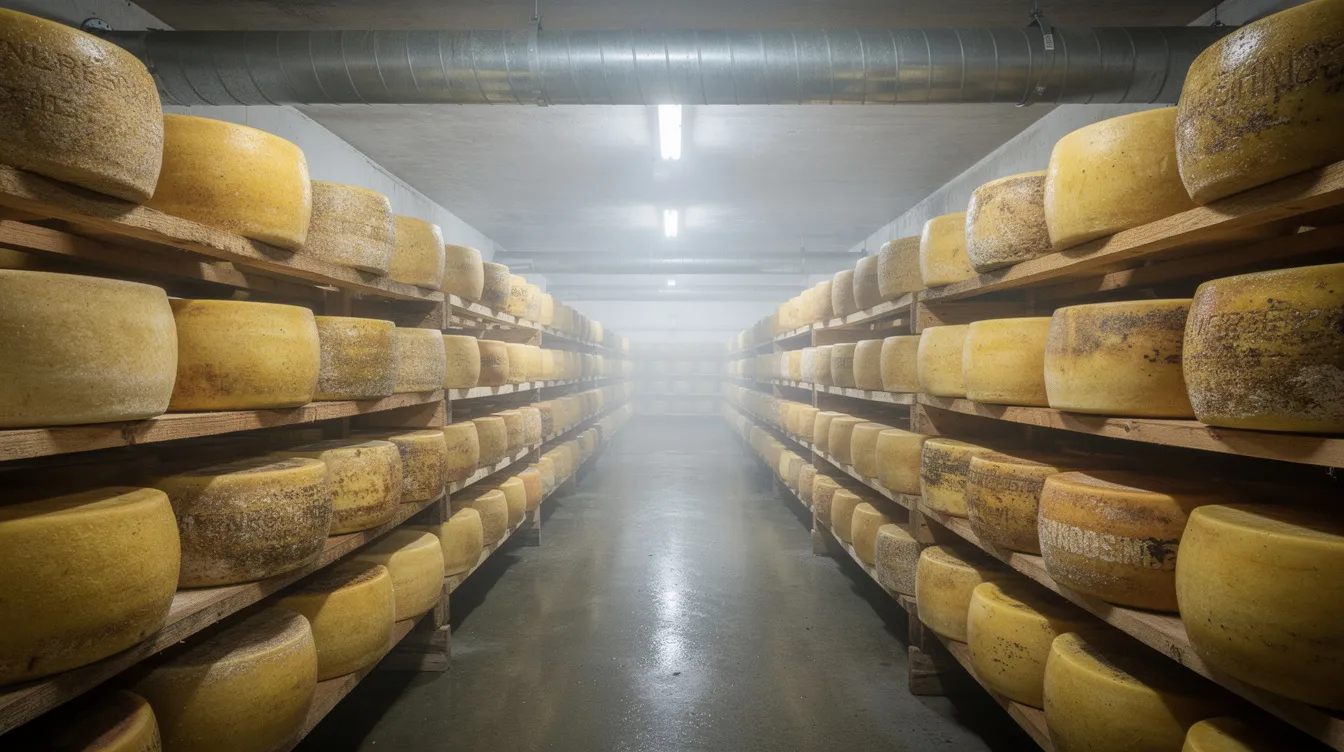
For plants producing cheddar or other aged cheeses, a portion of production remains in aging rooms at year-end, affecting inventory levels in the projected balance sheet and increasing working capital requirements.
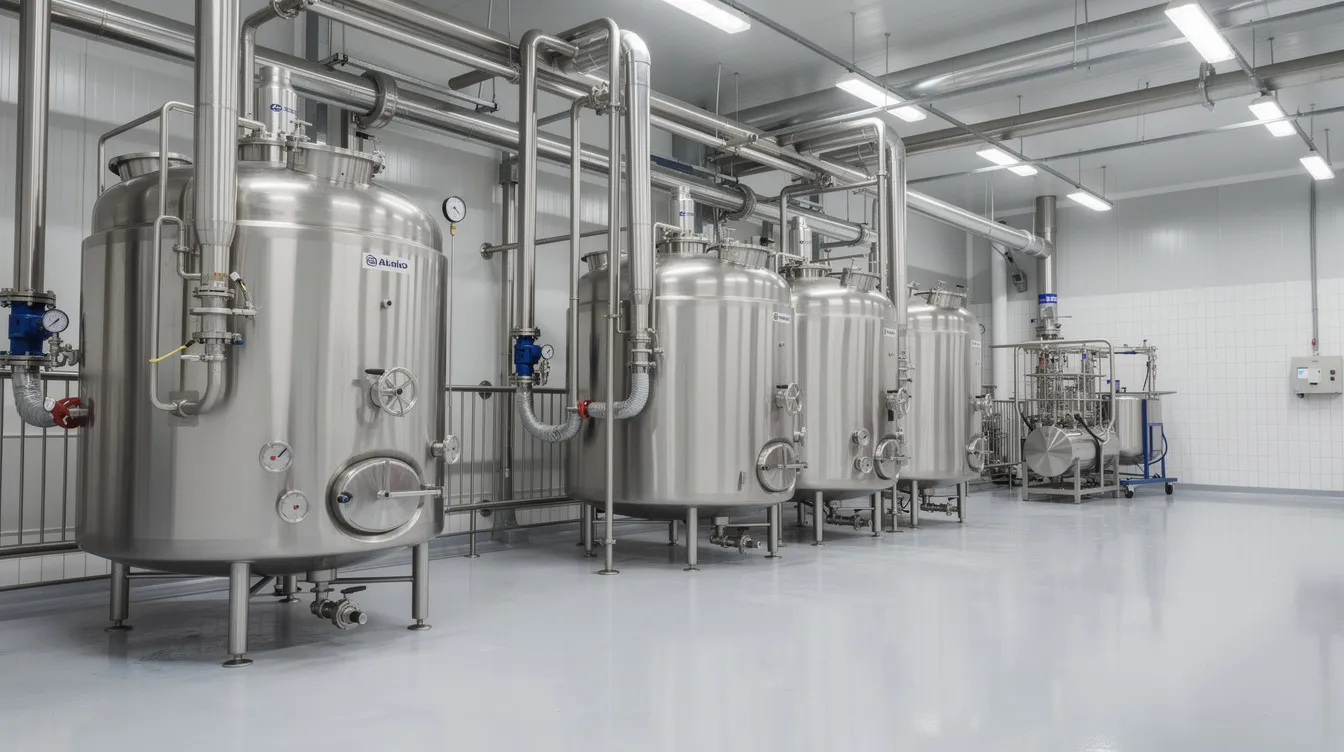
Product-Wise Sales Revenue Projections
Banks expect line-by-line revenue projections for each product category. Revenue should be projected separately for mozzarella, processed cheese, cheddar, blocks, slices, grated cheese and commercially saleable whey or other by-products.
The revenue formula is straightforward:
Sales Revenue = Saleable Production Quantity × Average Net Selling Price
Net selling price should be after trade discounts and distributor margins but before GST. A pricing analysis by product, pack size and channel helps set realistic assumptions.
| Product | Quantity (MT) | Net Selling Price (₹/kg) | Revenue (₹ Lakh) |
|---|---|---|---|
| Mozzarella Cheese | 2,000 | 480 | 9,600 |
| Processed Cheese | 1,500 | 420 | 6,300 |
| Cheddar Cheese | 700 | 520 | 3,640 |
| Whey Powder / By-Products | 800 | 140 | 1,120 |
| Total | 5,000 | 20,660 |
Illustrative Year 3 sales table for a hypothetical cheese manufacturing plant. Actual prices vary by market, pack size and channel.
Bulk foodservice packs command different pricing than retail packs, and introductory or promotional pricing may temporarily reduce realised prices. For a comprehensive discussion on revenue streams, readers may refer to our article on cheese manufacturing plant revenue model.
GST, freight and sales returns should be treated consistently. Revenue is typically shown net of returns, with freight either included in the selling price or booked as a separate expense.
Raw-Material and Manufacturing Cost Projections
Cheese manufacturing cost analysis is one of the most sensitive parts of the financial model. Milk is typically the largest single expense in cheese processing, often accounting for 50% to 70% of COGS. At the overall operating-expenses level, milk accounts for 70–80% of total operating expenses, making milk price a significant variable cost in cheese production. It is essential to model pricing and supplier contracts carefully.
Primary raw materials:
- Raw milk (cow, buffalo or mixed), skimmed milk powder where needed
- Cultures, rennet, enzymes, stabilisers, emulsifying salts, salt and permitted additives
- Packaging materials: pouches, laminates, thermoformed trays, shrink films, labels, cartons
Utility and energy costs:
Cheese processing is energy-intensive and requires significant utility resources for pasteurisation and refrigeration. Industrial electricity tariffs of ₹7–9/kWh are common, and refrigeration alone can consume 35% of total energy cost in dairy-cheese operations. Steam, water and effluent treatment add further to infrastructure costs.
Other manufacturing costs:
- Direct and indirect costs of labour (machine operators, quality-control staff, supervisors, maintenance)
- Quality-testing and lab consumables; CIP and cleaning chemicals
- Cold storage and warehousing; local logistics and distribution
- Equipment maintenance and annual maintenance contracts
Per-unit cost of production is derived as total manufacturing cost divided by saleable production quantity. This metric changes materially with capacity utilisation and milk price, which is why both should be modelled carefully in sensitivity analysis.
Projected Profit and Loss Account for Cheese Manufacturing
The projected profit and loss account summarises revenue and expenses for each year. It is the primary indicator of profitability but not the only measure of repayment capacity. The first-year operating cost for cheese manufacturing is projected to be significant due to lower capacity utilisation and fixed-cost absorption, while operating costs are projected to increase significantly by year five in absolute terms as production scales up.
| Particulars (₹ Lakh) | Year 1 | Year 2 | Year 3 | Year 4 | Year 5 |
|---|---|---|---|---|---|
| Sales Revenue | 11,880 | 15,840 | 20,660 | 23,580 | 25,200 |
| Raw Materials & Packaging | 8,320 | 10,690 | 13,430 | 15,170 | 16,130 |
| Manufacturing Expenses | 1,070 | 1,270 | 1,550 | 1,710 | 1,810 |
| Employee Cost | 480 | 530 | 580 | 640 | 700 |
| Selling & Admin Expenses | 360 | 430 | 540 | 600 | 640 |
| EBITDA | 1,650 | 2,920 | 4,560 | 5,460 | 5,920 |
| Depreciation | 620 | 580 | 540 | 510 | 480 |
| Interest (Term Loan + WC) | 640 | 570 | 490 | 400 | 310 |
| Profit Before Tax | 390 | 1,770 | 3,530 | 4,550 | 5,130 |
| Tax Provision | 100 | 450 | 890 | 1,150 | 1,300 |
| Profit After Tax | 290 | 1,320 | 2,640 | 3,400 | 3,830 |
| Cash Accrual (PAT + Dep) | 910 | 1,900 | 3,180 | 3,910 | 4,310 |
All figures are purely illustrative for a hypothetical ₹25 crore cheese manufacturing plant. Actual results depend on project-specific assumptions.
Gross profit margins for cheese manufacturing typically range between 30–40%, though actual margins depend on product mix, scale and procurement efficiency. EBITDA reflects operating surplus before financing and depreciation. Net profit is what remains after interest and tax. Cash accrual (profit after tax plus depreciation) is the figure that feeds DSCR calculations.
Healthy accounting profit does not automatically mean sufficient cash for loan repayment if large amounts are locked in inventory, receivables or phased capital expenditure. For a deeper analysis, refer to our article on cheese plant profitability analysis.
Projected Cash Flow Statement and Funding Flows
Banks pay close attention to cheese plant cash flow projections because loans are repaid out of cash, not accounting profit.
The projected cash flow statement covers three parts:
- Operating activities: EBITDA, adjusted for changes in working capital (inventory build-up, receivables, creditors), tax payments
- Investing activities: capital expenditure on plant, equipment and cold rooms; any asset sales
- Financing activities: promoter’s equity infusion, term-loan drawdown and repayments, interest payments, working capital borrowing changes
Increases in inventory-especially maturing cheese stock-and trade receivables reduce operating cash flow, even when the plant is profitable on paper. Aged cheeses require significant storage time before they can be monetised, directly impacting cash flow.
A well-structured model should show no negative cash balance in any year after considering proposed working capital limits. If cash deficits appear, either the project structure or banking limits need revision.
Projected Balance Sheet for a Cheese Manufacturing Plant
The projected balance sheet presents the financial position of the cheese manufacturing unit at the end of each year.
Assets side: Gross block of fixed assets (land, building, plant and machinery, cold rooms, vehicles), accumulated depreciation, net fixed assets, capital work in progress, inventory (raw materials, WIP, finished goods), trade receivables, cash and bank balances, and other current assets.
Liabilities and equity side: Promoter’s capital, reserves and surplus (accumulated profits), term-loan outstanding (year-wise closing balance), working capital borrowings, trade creditors and other current liabilities.
The projected balance sheet must be mathematically consistent with the P&L and cash flow. Profit after tax adds to reserves, depreciation reduces net fixed assets, and loan repayments reduce term-loan outstanding. Correctly modelling maturation and ageing inventory for cheddar-type cheeses is essential, as it appears as work-in-process in the balance sheet and directly influences working capital requirements.
Working Capital Requirement and Assessment
Cheese businesses require significant working capital due to the time lag between production costs and revenue collection. The working capital requirement for a cheese manufacturing plant is often larger than in many other food-processing businesses.
Gross working capital includes:
- Raw-material inventory (milk, SMP, additives)
- Packaging-material inventory
- Work-in-progress, including cheese under maturation in aging rooms
- Finished-goods inventory
- Trade receivables
- Minimum cash balance and advances
Deductions from working capital gap:
- Trade creditors (supplier credit for milk and packaging)
- Outstanding wages, statutory dues and other current liabilities
Different cheeses have varying cash conversion cycles, affecting working capital needs. Tracking inventory days is crucial for operations involving aged cheeses to prevent cash flow issues. Longer ageing periods and higher institutional credit periods increase both working capital and interest cost, directly affecting DSCR sensitivity.
Bankers typically expect a separate working capital assessment and CMA Data for operating limits. The cheese plant financial model should align with these formats.
Depreciation, Interest and Term-Loan Repayment Structure
Correct modelling of depreciation and interest is essential because they affect both profitability and cash flow in the cheese manufacturing plant financial model.
Depreciation is computed asset-wise based on applicable Indian tax rules and accounting policy. Typical useful life: plant and machinery ~15 years, buildings ~30 years, vehicles ~8–10 years. A fixed-asset register should support these calculations.
Interest during construction (IDC) is capitalised into project cost for loans drawn during the pre-operative period.
After commissioning, term-loan interest and principal are calculated based on the sanctioned repayment structure. A moratorium on principal repayment of 6–18 months is common for cheese plants during plant setup and stabilisation.
| Year | Opening Balance (₹ Lakh) | Principal Repaid | Interest | Total Debt Service | Closing Balance |
|---|---|---|---|---|---|
| Year 1 | 1,875 | 225 | 470 | 695 | 1,650 |
| Year 2 | 1,650 | 270 | 400 | 670 | 1,380 |
| Year 3 | 1,380 | 270 | 335 | 605 | 1,110 |
| Year 4 | 1,110 | 270 | 270 | 540 | 840 |
| Year 5 | 840 | 270 | 200 | 470 | 570 |
Hypothetical term-loan repayment schedule. Actual terms depend on lender sanction.
Working capital interest is computed on projected average utilisation of bank limits and must be accounted separately from term-loan interest in both P&L and cash flow. Actual interest rates, moratoriums and repayment structures depend on the lender’s sanction terms and overall project risk assessment.
DSCR and Loan Repayment Capacity
The Debt Service Coverage Ratio is the single most important indicator banks use to judge whether cash generated by the cheese plant is sufficient to meet interest and principal obligations.
DSCR = Cash Available for Debt Service ÷ (Term-Loan Interest + Principal Repayment Due)
Cash available for debt service typically includes cash accrual (profit after tax + depreciation) adjusted for term-loan interest already deducted.
| Year | Cash Available (₹ Lakh) | Total Debt Service (₹ Lakh) | DSCR |
|---|---|---|---|
| Year 1 | 1,380 | 695 | 1.99 |
| Year 2 | 2,300 | 670 | 3.43 |
| Year 3 | 3,515 | 605 | 5.81 |
| Year 4 | 4,180 | 540 | 7.74 |
| Year 5 | 4,510 | 470 | 9.60 |
Purely illustrative. DSCR values will vary based on project-specific assumptions.
Annual DSCR and project-average DSCR are both reviewed. Government dairy schemes generally require a minimum DSCR of 1.25x, while many banks expect 1.50x or higher. A very low DSCR indicates repayment stress, while an unrealistically high DSCR may signal overly optimistic profit projections.
DSCR should be tested under base, optimistic and adverse scenarios so lenders can assess sensitivity of repayment capacity to changes in milk price, selling price or capacity utilisation.
Break-Even Analysis for Cheese Manufacturing Plants
Break-even analysis shows the level of sales or capacity utilisation at which the cheese plant covers all operating costs but does not yet generate profit. This is especially important for capital-intensive plants with high refrigeration and cold-chain fixed costs.
Key concepts:
- Fixed costs: salaries, depreciation, minimum utilities, insurance, rent
- Variable costs: milk, packaging, variable energy, freight
- Contribution per kg = Selling price per kg – Variable cost per kg
- Contribution margin (%) = Contribution per kg ÷ Selling price per kg
Formulas:
- Break-even sales (₹) = Fixed costs ÷ Contribution margin (%)
- Break-even quantity (kg) = Fixed costs ÷ Contribution per kg
Illustrative example (hypothetical):
Assume fixed costs of ₹21.30 crore per year and a blended contribution margin of 35%. Break-even sales = ₹21.30 crore ÷ 0.35 = ₹60.86 crore. If full-capacity sales are ₹252 crore, break-even capacity utilisation is approximately 24%. The margin of safety (projected sales minus break-even sales) indicates how much revenue can decline before the plant starts making losses. Banks and investors consider a project more resilient when projected utilisation is comfortably above break even points.
ROI, IRR and Payback Period in Cheese Plant Project Appraisal
Beyond annual profitability, long-term investors evaluate overall returns on capital investments for the cheese manufacturing plant.
- Return on Investment (ROI): Average annual profit (or cash accrual) divided by total project cost. Provides a broad sense of expected ROI.
- Return on Equity (ROE): Profit attributable to promoters divided by their equity contribution.
- Internal Rate of Return (IRR): The discount rate at which net present value of expected cash inflows equals the initial investment. Higher IRR indicates better project viability.
- Payback Period: Time taken for cumulative cash accruals to recover total project cost. Its limitation is that it ignores cash flows after payback and the time value of money.
- Net present value (NPV): The sum of discounted future cash flows minus the initial investment, indicating whether the project adds value at a chosen discount rate.
No single ratio should be used in isolation. Promoters and lenders should interpret ROI, IRR, payback and DSCR together, alongside qualitative risk factors such as milk supply stability, product acceptance and key regulatory procedures.
Sensitivity and Scenario Analysis for Cheese Plant Projections
Banks now expect stress-testing of cheese plant financial projections, especially where repayment capacity depends on volatile factors. Sensitivity and scenario analysis are important for determining effects of changes in price and yield on profitability.
Three standard scenarios should be modelled:
- Base case: Most likely assumptions on prices, yields and ramp-up
- Optimistic case: Faster ramp-up, better realisations, higher yields
- Adverse case: Milk price increase of 10–15%, selling price decline of 5–10%, capacity utilisation lagging by one year
| Parameter | Base Case | Optimistic | Adverse |
|---|---|---|---|
| EBITDA Margin (Year 3) | 22.1% | 26.5% | 16.8% |
| PAT (Year 3, ₹ Lakh) | 2,640 | 3,480 | 1,520 |
| Average DSCR (5 Years) | 5.71 | 7.20 | 3.10 |
| Break-Even Utilisation | 24% | 20% | 31% |
All figures are purely illustrative and should not be treated as industry benchmarks.
Key variables to test include milk procurement price volatility, cheese selling prices based on price trends and competitive landscape, yield loss or gain, energy and refrigeration costs, interest rate changes, and project-implementation delays. Such analysis helps both promoters and lenders understand how quickly profits and DSCR deteriorate if adverse conditions materialise.
Financial Ratios Used in Bank Appraisal of Cheese Plants
Besides DSCR and IRR, banks use several financial ratios to evaluate cheese plant project reports and CMA Data.
- Current ratio (current assets ÷ current liabilities): Assesses short-term liquidity; depends on correct valuation of cheese inventory and receivables.
- Debt-equity ratio and TOL/TNW: Indicators of leverage, critical for capital-intensive cheese manufacturing plants with significant machinery and cold-room investments.
- Interest coverage ratio (EBIT ÷ Interest): Projected EBITDA must comfortably cover interest expenses across the forecast period.
- EBITDA margin and net profit margin: Indicators of operating efficiency, reflecting how well the cheese plant manages direct and indirect costs.
- Fixed asset coverage ratio: Relevant for term-loan security assessment.
- Inventory and receivables turnover: Shows how efficiently the cheese plant utilises working capital.
Acceptable benchmark values differ between banks, loan schemes and project-risk categories. Projections should be realistic rather than artificially tuned to meet any single ratio.
Common Mistakes in Cheese Plant Financial Projections
Many cheese plant DPRs face delays or rejection because projections are copied from generic dairy models or contain assumptions that bankers quickly identify as unrealistic.
Recurring mistakes include:
- Assuming 90–100% capacity utilisation from the first full year
- Ignoring trial-run and stabilisation losses during the initial months
- Using optimistic cheese yields unsupported by technical data
- Underestimating milk procurement cost volatility and price trends over the projection period
- Applying the same selling price to all cheese products without accounting for pack size, channel margins and market segmentation
- Ignoring distributor and retailer margins, competitive landscape pressures and promotional pricing
- Underestimating refrigeration, cold-chain and utility requirements, despite cheese processing being energy-intensive
- Excluding ageing inventory for cheddar-type cheeses from working capital calculations
- Omitting working capital interest entirely or treating it as negligible
- Preparing financial statements (P&L, cash flow, balance sheet) that are not interlinked
- Showing loan repayment schedules that exceed available cash accruals
- Copying projections from an unrelated dairy product or beverage project
- Treating profit projections as guaranteed results rather than assumption-based estimates
Documents and Data Required to Prepare Reliable Projections
Robust cheese plant financial projections need detailed inputs from the promoter, technical consultants and vendors. Incomplete data leads to weak or misleading models.
Technical documents:
- Proposed plant capacity and product mix with process-flow diagram
- Yield and loss estimates from the cheese production process, covering various unit operations and unit operations involved in manufacturing
- Equipment lists with power consumption, capacity and installation requirements
- Machinery quotations from credible vendors, covering machinery and technology requirements and machinery requirements in full
Project-cost inputs:
- Land documents, architectural and civil estimates covering infrastructure requirements
- Cold-room specifications, utility requirements and transportation requirements
- Vehicle and manpower requirements, including human resource requirements
Commercial inputs:
- Milk procurement plan (cooperative versus private suppliers), covering raw material requirements and milk sourcing strategy
- Marketing and distribution strategy, target segments, packaging requirements and expected selling prices
- Quality assurance plans, key certifications required and quality control checks applicable to the cheese manufacturing unit
Financial inputs:
- Planned promoter contribution and security, proposed banking arrangement for project funding
- Existing business financial statements, where applicable
- Implementation schedule (month-wise activities) and key regulatory procedures and regulatory compliance requirements
All these inputs feed into a cohesive cheese plant project report, CMA Data set and detailed financial model that provides a complete roadmap for lenders and investors with micro level information and detailed insights into project economics.
Role of a Professional DPR and Cheese Manufacturing Plant Financial Model
A professionally prepared Detailed Project Report and cheese manufacturing plant financial model align technical design, comprehensive market overview, market trends, financial structure and risk analysis in one integrated document. A good DPR lays out total project cost, means of finance, operating assumptions, capacity ramp-up, projected profitability, working capital requirement and loan repayment capacity in a format understood by bank-credit teams.
The DPR should also highlight risk factors (milk supply disruption, competition, industry trends, regulatory changes) and present sensitivity analysis to demonstrate resilience. This amounts to a complete financial reporting framework suitable for any bank loan or investment decision.
ProjectReportBank, under the professional guidance of CA Manish Gugliya, assists promoters in preparing bank-ready cheese plant project reports, DPRs, CMA Data and financial projections tailored to specific banks and loan schemes-without guaranteeing sanction. Even the best DPR does not guarantee approval. Final sanctions depend on lender policy, promoter credentials, collateral, credit history, sectoral exposure and internal risk assessment.
Engaging a professional adviser helps avoid common technical and financial errors, saving time during appraisal and improving documentation quality, leading to key success in the proposal process and unlocking investment opportunities for viable projects.
Frequently Asked Questions on Cheese Plant Financial Projections
The following FAQ section addresses common queries that promoters, consultants and bankers raise about cheese manufacturing plant financial models and bank-loan appraisal.
How many years of financial projections are generally required for a cheese manufacturing plant?
Most banks in India expect at least 5 years of projected financial statements for cheese plant term-loan proposals. For larger projects or longer-tenor loans, 7–10-year projections may be requested. Projections should cover the full repayment period so that DSCR and loan coverage can be analysed for the entire tenor.
Can financial projections be prepared before finalising cheese plant machinery?
Preliminary projections can be drafted using indicative capacity estimates, but a bank-ready cheese plant financial model should be finalised only after receiving firm machinery quotations. Equipment cost, installed capacity and energy consumption directly affect depreciation, interest during construction, fixed costs and unit production cost.
How is working capital for a cheese plant different from other food projects?
Cheese plants often have higher working-capital needs because of raw-milk procurement cycles, longer product-ageing periods and credit terms to distributors. A portion of production may remain in cold storage for a few days to several months, resulting in a larger inventory investment compared with many fresh-food businesses. Key performance indicators for cheese plants include milk yield efficiency and cost per pound produced, both of which affect the working capital cycle.
Is CMA Data the same as a cheese plant project report?
CMA Data is a structured set of historical and projected financial statements and ratio analysis used by banks for financial reporting and appraisal. A cheese plant project report or DPR also includes technical details, market analysis covering cheese market performed trends, implementation plan, pricing mechanism and risk assessment. For new cheese manufacturing projects, banks usually ask for both.
Can accurate financial projections guarantee bank loan approval for a cheese plant?
No financial projection or model can guarantee loan approval. Banks also evaluate promoter background, credit history, collateral, market risk, sector exposure and internal policies. Well-prepared cheese plant financial projections supported by a professional DPR significantly improve proposal clarity and credibility, but final sanction remains at the lending institution’s discretion.
Conclusion and Professional Advisory Note
Reliable cheese plant financial projections must integrate technical design (capacity, product mix, yields from the industrial cheese production process), detailed capital costs and capital expenditure, realistic selling-price and procurement assumptions, manufacturing and operating costs, working-capital needs and prudent loan repayment structures. The global cheese market presents strong investment opportunities, but each project must stand on its own financial merit.
Profit, cash flow, DSCR, break-even and IRR need to be evaluated together under multiple scenarios to assess whether a cheese manufacturing project in India is commercially viable and bankable. No single ratio or statement tells the complete story.
If you are planning a cheese manufacturing plant, expanding an existing dairy business into cheese production, or preparing a DPR for a bank loan, you are welcome to connect with CA Manish Gugliya through www.projectreportbank.com for customised cheese plant project reports, financial projections, CMA Data preparation and bank-finance analysis. All assistance is advisory in nature and does not guarantee loan sanction or specific financial outcomes.
Continue Exploring Our Cheese Project Guides
Explore all 17 guides covering cheese plant setup, products, financial planning, feasibility, bank loans and DPR preparation.