
Key Takeaways
- A cheese manufacturing plant in India can be a viable operation when milk procurement cost, cheese yield from milk, net selling-price realisation and capacity utilisation are carefully managed. Turnover alone does not determine profitability.
- Raw milk typically accounts for 70–85% of variable production cost, so even a ₹1–2 per litre change in milk price or a 1–2% shift in cheese yield can materially alter the cheese plant profit margin.
- Cheese manufacturing plant profitability must be evaluated through contribution per kg, EBITDA margin, break even points, cash flows, return on capital employed, project IRR and DSCR-not just accounting profit on paper.
- Product mix decisions across mozzarella, processed cheese and cheddar, along with cold-chain efficiency and working-capital discipline, strongly influence cheese production business profitability in the Indian context.
- All financial figures used in this article are purely illustrative. Every proposed plant requires customised financial projections and a detailed project report to judge its actual ROI and risk profile.
Introduction: Is a Cheese Manufacturing Plant Profitable?
A cheese manufacturing plant in India can be profitable because it converts perishable milk into a higher-value, longer-shelf-life product with steady demand across retail, institutional and HoReCa channels. However, cheese manufacturing plant profitability is not automatic. It varies widely depending on location, scale, raw material economics, product mix, market access and financial structure.
The global cheese market was valued at USD 98 billion in 2025 and is expected to reach USD 153.08 billion by 2034, reflecting sustained cheese demand worldwide. Within India, urbanisation, the growth of QSR chains and rising protein awareness continue to drive consumption. Yet, small or new cheese makers often struggle to compete with larger brands due to higher per-unit production costs and limited distribution reach.
In my experience as CA Manish Gugliya, FCA, DISA (ICAI), while preparing DPRs and financial projections for dairy industry projects, I have observed that profitable cheese plants are those that control raw milk quality, track cheese yield batch-wise, align production with assured demand and maintain disciplined working-capital management. Turnover figures can be misleading. Investors should examine contribution per kg, EBITDA margin, break-even capacity, cash accruals and debt-servicing ability before committing capital.
The rest of this article stays focused on cheese manufacturing cost and profit, cheese plant profit margin and cheese plant ROI analysis. For process steps, machinery details and licensing, refer to the dedicated guides linked within.
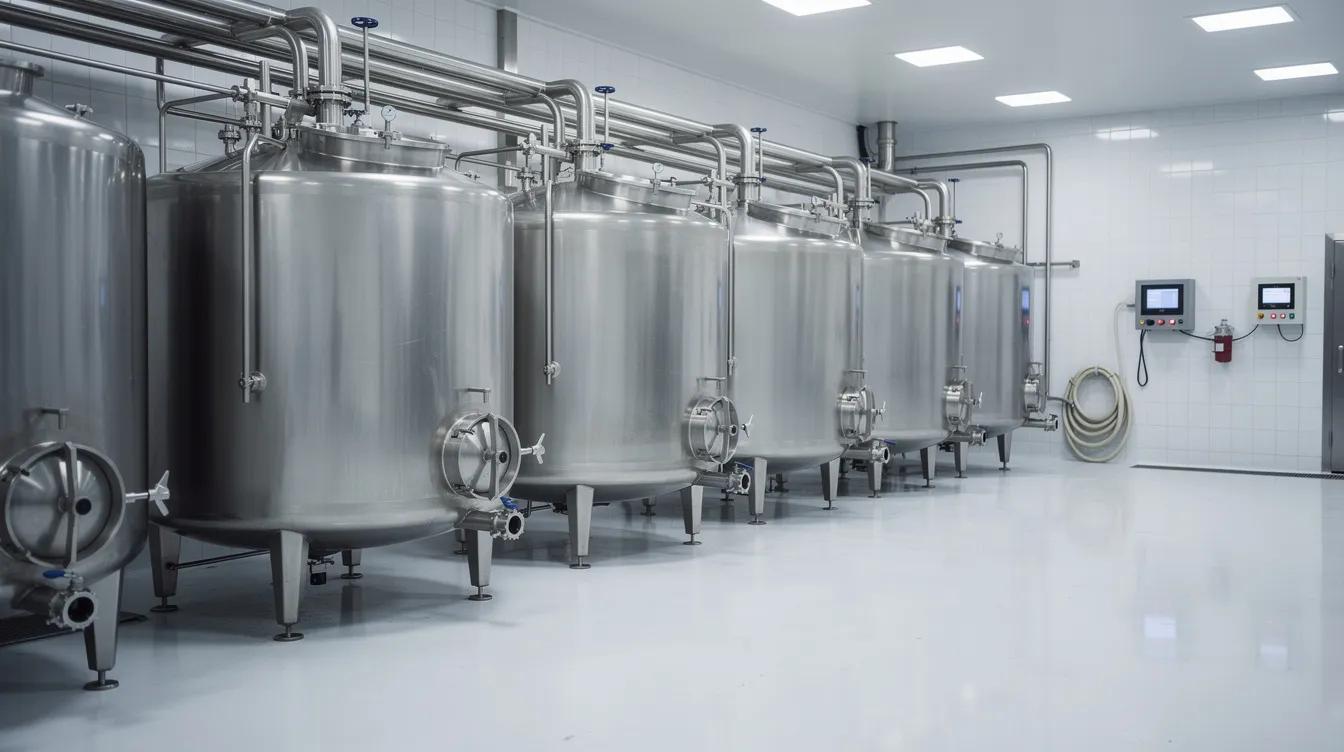
Understanding Cheese Manufacturing Plant Profitability
Profitability in cheese manufacturing must be analysed at multiple levels. A single “profit percentage” is insufficient for a capital-intensive manufacturing plant where investment decisions hinge on cash flows, repayment capacity and return ratios.
Here are the key profitability indicators and why each matters:
| Profitability Indicator | What It Measures | Why It Matters |
|---|---|---|
| Contribution per kg | Net realisation minus variable cost per kg | Tells whether each kg of cheese covers its direct costs |
| Gross profit | Revenue minus cost of goods sold | Measures basic production-level profitability |
| EBITDA | Earnings before interest, depreciation, amortisation and tax | Core operating profitability before financing and non-cash charges |
| EBITDA margin (%) | EBITDA as a percentage of net revenue | Enables comparison across plants of different sizes |
| Profit after tax (PAT) | Bottom-line accounting profit | Reflects final earnings after all charges |
| Cash accrual | PAT plus depreciation and non-cash charges | Shows actual cash generated for loan repayment and reinvestment |
| ROCE | Operating profit divided by total capital employed | Measures efficiency of total capital investment |
| Project IRR | Discount rate at which net present value of project cash flows equals zero | Single metric capturing overall project return over its life |
| Payback period | Time required to recover initial investment from net cash flows | Indicates risk horizon for the investor |
The difference between accounting profit and cash profit is important. Depreciation reduces reported PAT but does not consume cash. A cheese plant may show modest PAT while generating strong cash accruals sufficient for comfortable loan repayment. Conversely, a healthy EBITDA margin does not automatically mean an attractive ROI if total capital investment, interest and principal obligations are heavy relative to cash flow.
How Cheese Manufacturing Cost and Profit Are Calculated
The basic profitability equation for any cheese manufacturing unit is:
Profit = Net sales realisation − Raw materials − Packaging − Utilities − Labour − Factory overheads − Selling and distribution expenses − Interest − Depreciation − Taxes
The starting point for cheese manufacturing cost and profit analysis is the contribution per kg:
Contribution per kg = Net selling-price realisation per kg − Variable production cost per kg
GST collected from customers is a pass-through liability and should not be treated as operating revenue when evaluating financial performance.
Consider two quick illustrations (purely hypothetical):
- If net realisation is ₹320/kg and variable cost is ₹240/kg, contribution is ₹80/kg.
- If milk price rises by ₹5/litre and 10 litres are needed per kg, variable cost jumps to ₹290/kg, shrinking contribution to ₹30/kg-a 62% decline from one input-cost change alone.
Only after estimating contribution should fixed costs-salaries, repairs, depreciation, interest-be layered to arrive at PBT, PAT and cash accrual.
Milk Procurement Cost and Cheese Yield
In most Indian cheese plants, raw milk plus fat and cream standardisation accounts for the dominant share of variable cost. Milk accounts for 70–85% of cheese production expenses, making understanding input costs around milk procurement the single most critical factor in cheese manufacturing plant profitability.
Key procurement considerations include:
- Purchase price per litre (cow milk at ₹44–55/litre, buffalo milk higher)
- Fat and SNF composition, which affects cheese yield and standardisation cost
- Bacterial quality-high somatic cell counts or poor microbial quality reduce curd firmness and lower yield
- Seasonal availability and price volatility
- Collection, chilling and transport losses
- Rejection rates and quality-failure risk
Cheese yield from milk varies by product type. Fresh or soft cheeses may yield 18–19% of milk weight, while hard pressed varieties yield only 10–11%. Moisture retention and fat recovery in whey dictate how much solid matter makes it into the final product.
Cheese yield percentage = Cheese output ÷ Milk input × 100
A simple example: if 50,000 litres of milk produce 5,000 kg of cheese, yield is 10%. If yield improves to 11%, output rises to 5,500 kg from the same milk-an additional 500 kg at near-zero incremental milk cost. Small percentage shifts in yield can result in large swings in profit margins.
For detailed technical-process steps, refer to the guide on industrial cheese production process. This section focuses on the financial impact of yield and process efficiency.
There is no universal yield percentage. It varies by mozzarella, processed cheese and cheddar recipes, culture selection, processing requirements, equipment and quality specifications required by customers. Cheese yield efficiency significantly affects profit margins and must be tracked daily.
Major Operating Costs of a Cheese Plant
A structured view of operating expenditure is essential to understand cheese factory profit margin and identify areas for cost control. Total operational costs include utilities, maintenance, and labor alongside raw material and packaging expenses.
Variable Costs
Raw milk and cream, starter cultures, rennet and enzymes, salt and other ingredients, packaging materials, variable power and fuel, cold-chain transportation, sales commission and production losses.
Fixed and Semi-Fixed Costs
Salaries and wages (a medium-sized plant requires 60 to 150 employees), plant maintenance, quality control laboratory, factory administration, insurance, rent or lease, ETP and regulatory compliance costs, depreciation, interest and marketing overheads. Pasteurization and cooling processes utilise substantial thermal and electrical energy, adding to utility bills.
| Cost Component | Cost Behaviour | Effect on Profitability | Management Focus |
|---|---|---|---|
| Raw milk | Variable | Largest single cost; directly determines contribution | Quality-based procurement, supplier relationships |
| Starter cultures and rennet | Variable | Moderate per-kg impact; affects yield | Standardised dosing, vendor negotiation |
| Packaging materials | Variable | Higher for retail packs vs bulk | Size optimisation, resource efficiency |
| Power and fuel | Semi-variable | Rises with production volume | Energy audits, efficient equipment |
| Salaries and wages | Fixed / semi-fixed | High during low utilisation | Lean staffing during ramp-up |
| Maintenance and repairs | Semi-fixed | Neglect increases downtime and losses | Preventive maintenance schedules |
| Depreciation | Fixed | Non-cash but affects reported profit | Linked to total capital investment |
| Interest on term loan | Fixed | Directly reduces PBT and cash flow | Optimal leverage, scheme-based finance |
| Cold-chain and distribution costs | Semi-variable | Ensures the product reaches the customer in quality condition | Route planning, third-party logistics review |
| Quality control testing | Fixed | Avoids recalls and brand damage | HACCP-compliant systems |
Capital expenditure for machinery is typically 45–55% of setup costs. For detailed capex breakdowns, refer to articles on cheese manufacturing plant setup cost in India, cheese plant machinery and equipment cost and cheese plant project cost and means of finance. Civil works, utilities infrastructure and site development account for significant additional shares.
Controlling wastage, improving resource efficiency in packaging and optimising utility consumption can add meaningful improvements to cheese production business profitability, especially when milk prices are trending upward.
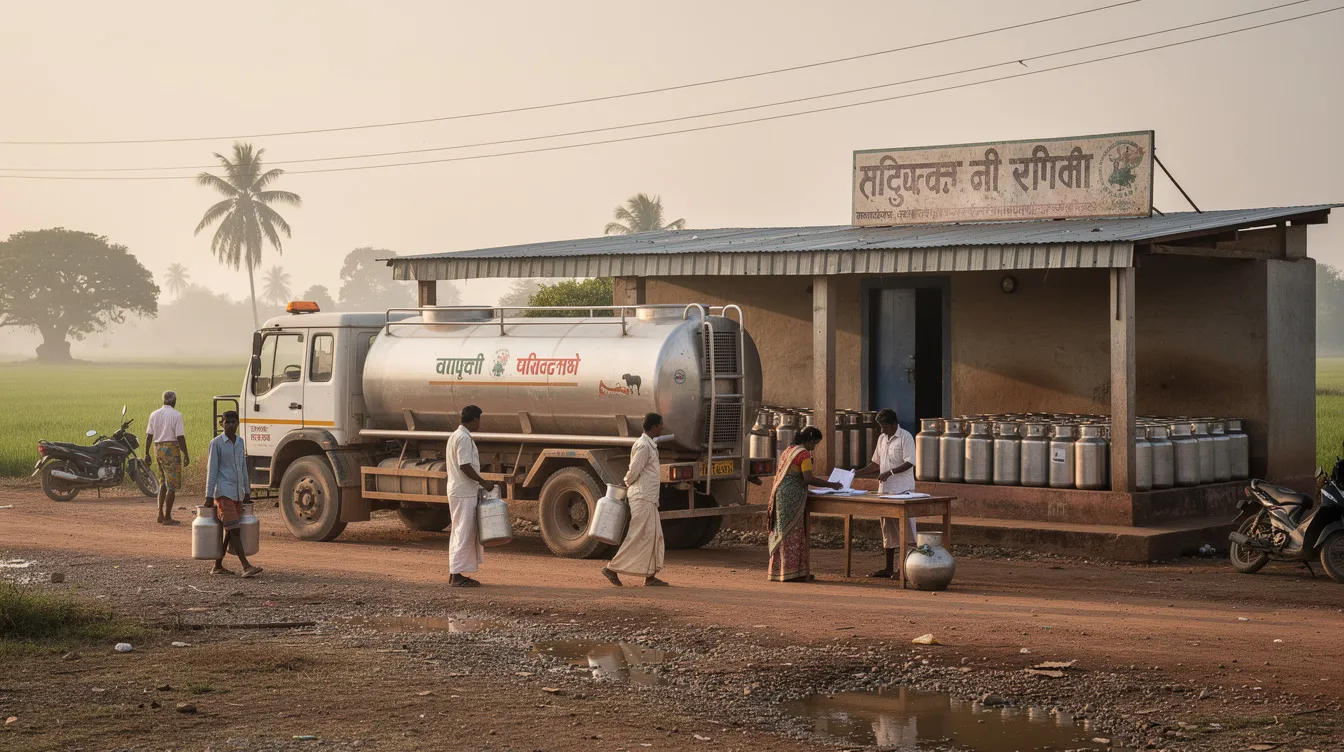
Effect of Plant Capacity Utilisation on Profit Margin
Cheese manufacturing is capital-intensive with significant fixed costs. Capacity utilisation therefore strongly affects cheese plant profit margin, particularly during the first two to three years when a new facility is still ramping up production. Operating costs can also increase significantly by the fifth year as maintenance cycles, wage revisions and compliance requirements mature.
| Capacity Utilisation | Production Level (Illustrative) | Fixed Cost per kg (Indicative Trend) | Expected Profitability Position |
|---|---|---|---|
| 40–50% | Well below installed capacity | Very high | Likely operating loss or marginal break-even |
| 65–75% | Moderate | Declining but still significant | Near break-even; may achieve modest profit |
| 80–90% | Strong utilisation | Spread efficiently | Comfortable EBITDA and reasonable net margins |
| 95–100% | Near full capacity | Lowest per unit | Highest margins, provided sales are realised |
However, producing at 100% capacity without adequate confirmed orders can increase unsold inventory, ageing costs, cold-storage load and working-capital interest-ultimately reducing overall cheese manufacturing plant profitability. For guidance on aligning installed capacity with realistic demand, refer to the article on cheese plant capacity and product mix planning.
Product Mix and Cheese Plant Profitability
Not all cheese varieties contribute equally. Product mix should be based on margins rather than solely selling high-priced items. Mozzarella, processed cheese and cheddar have different yield patterns, ageing periods, packaging requirements and market segments, each influencing cheese production business profitability differently.
Mozzarella is driven by pizza chains and QSR demand-fast turnover, minimal ageing but critical specifications on melt and stretch. Processed cheese targets retail consumers through slices and spreads with higher additive and packaging cost but quicker inventory cycles. Cheddar involves longer ageing periods and ties up working capital but commands premium pricing in certain channels.
| Product Category | Commercial Characteristic | Working-Capital Impact | Main Profitability Driver |
|---|---|---|---|
| Mozzarella | High volume, QSR-driven, fast turnover | Lower inventory holding | Volume throughput and yield consistency |
| Processed cheese | Retail-focused, brand-dependent, moderate shelf life | Moderate; packaging inventory needed | Brand premium and distribution reach |
| Cheddar | Longer ageing, bulk and premium retail | Higher; aged cheese ties up working capital and incurs ongoing costs | Ageing quality, net realisation per kg |
For detailed product-specific guides, see mozzarella cheese manufacturing plant, processed cheese manufacturing plant and cheddar cheese manufacturing plant.
Entrepreneurs should review contribution per kg, ageing loss and credit terms product-wise before finalising their cheese plant product mix. Introduction of new flavors and specialty cheeses can also improve per-unit margins for cheese makers targeting premium segments, though these require careful market validation.
Revenue Sources and By-Product Realisation
Revenue for a cheese plant flows from multiple channels: bulk cheese blocks, retail consumer packs, institutional and HoReCa supply, private-label and contract manufacturing. The cheese industry also benefits from the growing use of cheese in many dishes and snack products, which supports steady demand across price segments. As the IMARC Group examines in its latest analysis, the market breakup by product type shows processed and mozzarella leading consumption volumes, providing insights into where cheese demand is concentrated among key players in the dairy market.
Cheese plants often produce large volumes of whey as a byproduct. Whey can be converted into valuable protein powders or sold as a co-product, and efficient whey utilisation can significantly reduce the effective milk cost per kg of cheese. For example, Amul’s planned bioethanol-from-whey project is projected to add ₹700 crore in revenue, demonstrating the scale of by-product monetisation opportunity.
Revenue analysis must be based on net realisation after trade discounts, commissions, freight, returns and promotional expenses-not simply on MRP or gross invoice value. For a detailed breakdown, see the cheese manufacturing plant revenue model.
Illustrative by-product impact: If whey revenue of ₹8 per litre of milk processed is earned and 10 litres of milk are used per kg of cheese, the effective milk cost per kg of cheese reduces by ₹80-a material improvement to contribution.
Illustrative Cheese Plant Profitability Model
This section presents a purely hypothetical, illustrative example for educational purposes. It is not a quotation, standard industry margin or guaranteed projection.
Assumptions
- Daily milk processing: 50,000 litres
- Operating days: 300 per year
- Capacity utilisation (Year 3): 80%
- Cheese production capacity ranges from 5,000 to 10,000 MT annually for medium-scale plants; this example assumes ~1,200 MT at 80% utilisation
- Average cheese yield: 10%
- Net selling price (blended): ₹330/kg
- Milk procurement cost: ₹45/litre
| Particulars | Basis | Illustrative Annual Amount (₹ Lakhs) |
|---|---|---|
| Annual milk processed | 50,000 L × 300 days × 80% | 1,20,00,000 litres |
| Cheese production | 10% yield | 12,00,000 kg (1,200 MT) |
| Net revenue | 12,00,000 × ₹330 | 3,960 |
| Milk cost | 1,20,00,000 × ₹45 | 5,400 (adjusted for whey revenue of ~₹360L, net = 3,240) |
| Cultures, rennet, salt | ₹8/kg | 96 |
| Packaging | ₹15/kg | 180 |
| Utilities (power, fuel, water) | ₹12/kg | 144 |
| Total variable cost | 3,660 | |
| Contribution | Revenue − Variable cost | 300 |
| Salaries and wages | Annual estimate | 85 |
| Repairs and maintenance | 25 | |
| Quality control, admin, insurance | 30 | |
| Selling and distribution | 40 | |
| EBITDA | 120 | |
| Depreciation | 55 | |
| Interest on term loan | 35 | |
| PBT | 30 | |
| Tax (approx.) | 8 | |
| PAT | 22 | |
| Cash accrual (PAT + Dep) | 77 |
Derived Indicators (Illustrative)
- Contribution margin: ~7.6% of revenue
- EBITDA margin: ~3.0%
- Break-even sales: approximately ₹33 crore (where contribution covers all fixed costs)
- If total capital employed is ₹5 crore, ROCE would be approximately 16%
- Indicative payback period: 6–8 years based on cash accruals
These figures are for methodology illustration only. Actual cheese manufacturing cost and profit will vary with local milk prices, price trends, product mix, market demand, financing terms, expenditure projections and operational efficiency. Each investor should get a customised DPR and cheese plant ROI analysis prepared based on their specific parameters.
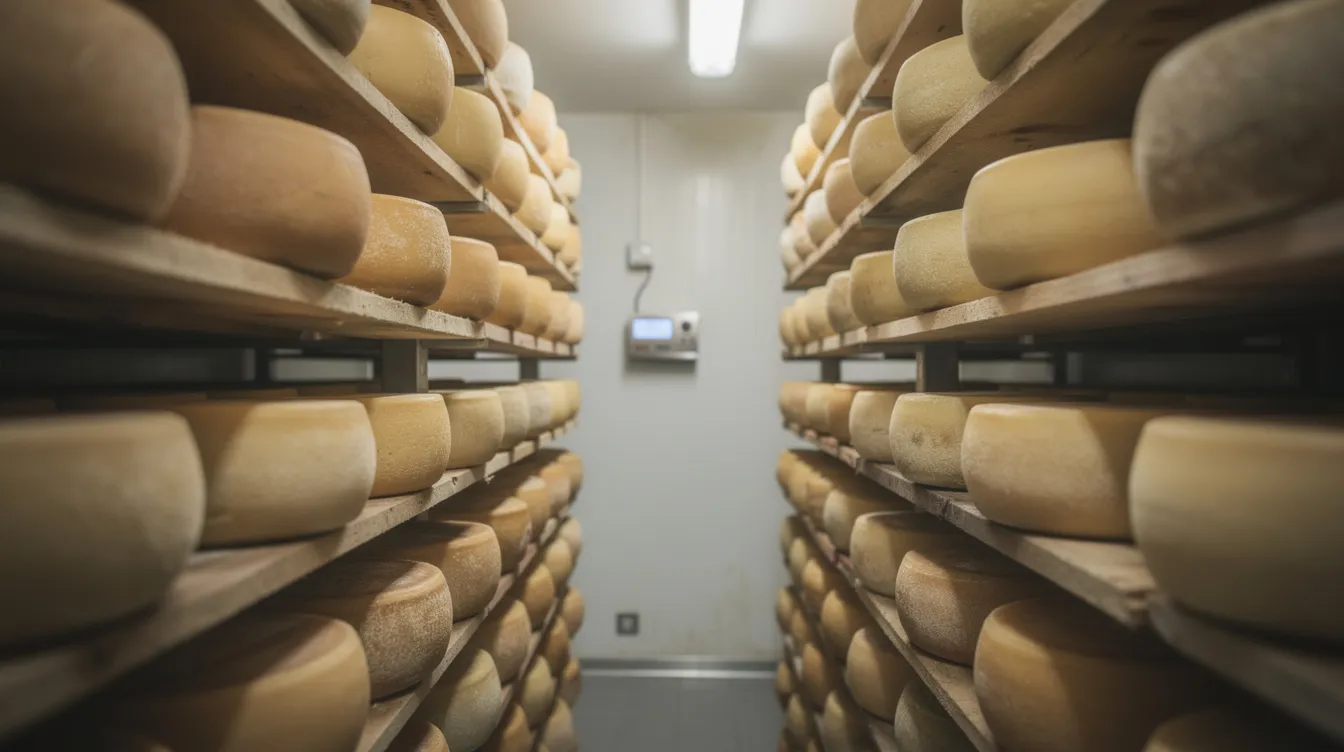
Cheese Plant Profit Margin: What Is a Reasonable Margin?
There is no single “standard” cheese plant profit margin applicable across all Indian cheese projects. Gross profit margins for cheese manufacturing typically range between 30–40% at the gross level (revenue minus direct material cost), but EBITDA margins after all operating expenditure tend to be considerably lower-often in the 11–18% range for standard cheese and potentially higher for specialty cheeses or strong consumer brands in the competitive landscape.
Plants focusing on bulk institutional mozzarella with efficient procurement may operate on moderate per-kg margins but compensate through high volumes and fast inventory turnover. Plants selling premium retail products may target higher per-kg margins but face higher marketing and distribution costs, making financial analysis at the EBITDA and PAT level essential.
Net profit percentage can look modest even when ROI is attractive, especially when leverage is optimised and asset utilisation is high. Entrepreneurs should compare their projected margins with sensitivity analysis around milk price, selling price and capacity utilisation before committing capital. Margins are also influenced by consumer taste preferences and how effectively the brand is positioned against established dairy industry players.
Break-Even Analysis
Break-even is the production and sales level at which total contribution equals total fixed costs, resulting in zero profit before tax. For capital-intensive cheese production, this is a critical benchmark.
Break-even quantity (kg) = Annual fixed cost ÷ Contribution per kg
Break-even capacity utilisation (%) = Break-even production ÷ Installed annual production capacity × 100
Using the illustrative model above: if annual fixed costs (including salaries, maintenance, depreciation, interest and overheads) total ₹2.70 crore and contribution per kg is ₹25, break-even quantity is approximately 10,80,000 kg. If installed capacity is 15,00,000 kg per year, break-even utilisation is roughly 72%.
If contribution per kg drops to ₹18 because of higher milk prices or lower net realisation, break-even quantity rises to 15,00,000 kg-effectively requiring 100% utilisation just to avoid losses. This is why break-even capacity should be one of the key questions when evaluating cheese manufacturing plant profitability and discussing funding risk with bankers.
Working Capital and Cash-Flow Profitability
A cheese plant can show accounting profit but still face cash-flow stress. Perishability of cheese leads to financial loss if products are not sold quickly, and aged cheese ties up working capital and incurs ongoing storage costs over extended periods. Inventory holding can incur high storage and climate-control costs that directly erode cash flow.
The typical working-capital cycle in cheese making involves:
- Daily raw milk purchases (largely cash or very short credit)
- Packaging-material and ingredient inventory
- In-process and finished cheese stock (including ageing inventory for cheddar)
- Receivables from distributors and institutional buyers (sometimes 30–60 days)
- Very limited supplier credit for milk procurement
The difference between profitability, liquidity and debt-servicing capacity is important. Lenders assess cash accruals and DSCR alongside projected PAT. Financial projections in the DPR should include monthly or quarterly cash-flow statements for initial years to capture seasonality in milk supply and sales realisation under normal operating conditions.
Cheese Plant ROI Analysis
This section is the core of investment evaluation. Cheese plant ROI analysis should consider both accounting returns and cash-flow-based metrics to properly influence investment decisions.
- Return on Capital Employed (ROCE): Operating profit ÷ Total capital employed. Measures how efficiently total capital investment generates returns.
- Project IRR: The discount rate at which the net present value of all project cash flows equals zero. Captures overall project-level return.
- Equity IRR: Return available specifically to equity investors, after accounting for debt servicing.
- Payback period: Time to recover initial investment from cumulative net cash flows. A cheese plant can recover investment in 6 to 11 years depending on scale, utilisation and product mix.
- DSCR: Cash available for debt service ÷ (Principal repayment + Interest due). Banks in India typically expect a minimum DSCR of 1.25× for cheese plant term loans under schemes like AHIDF.
Cheese manufacturing plants can achieve an ROI of 11 to 18% under normal conditions, though this depends heavily on capacity utilisation, milk price, yield and financial structure. Investors should not rely solely on net-profit percentage. Total capital deployed, leverage, cash-flow resilience under adverse scenarios and exit considerations must all inform the final decision.
Sensitivity Analysis
Sensitivity analysis tests how sensitive cheese manufacturing cost and profit are to changes in key variables. Bankers and investors routinely review such tables as part of cheese plant ROI analysis to assess whether a project can withstand adverse market movements.
| Risk Variable | Base Assumption | Adverse Scenario | Likely Profitability Effect |
|---|---|---|---|
| Milk procurement price | ₹45/litre | ₹50/litre (+11%) | Milk cost per kg cheese rises by ~₹50; contribution may halve |
| Net selling realisation | ₹330/kg | ₹315/kg (−5%) | Revenue drops ~₹18 lakh/year per 1,200 MT; EBITDA compressed |
| Cheese yield | 10% | 9% (−1% point) | Same milk produces ~11% less cheese; cost per kg rises sharply |
| Capacity utilisation | 80% | 70% (−10% points) | Fixed cost per kg increases; may push plant below break-even |
| Packaging cost | ₹15/kg | ₹18/kg (+20%) | Annual increase ~₹36 lakh; moderate margin erosion |
| Interest rate | 11% | 13% (+2% points) | Higher finance cost reduces PAT and DSCR |
| Debtor days | 30 days | 45 days (+15 days) | Increases working-capital requirement and interest burden |
Even small adverse movements in milk price or yield can significantly reduce contribution per kg and shift break-even capacity upward. Entrepreneurs should run multiple scenarios-best case, base case and conservative case-rather than relying on a single optimistic projection.
How to Improve Cheese Production Business Profitability
Practical strategies, viewed from a cost-and-margin perspective:
Procurement improvements:
- Buy milk based on tested fat and SNF content; pay on quality, not volume alone. Optimizing supply chain relationships helps stabilize raw milk prices.
- Reduce collection, chilling and transport losses.
- Negotiate stable supply arrangements with farmer producer organisations.
Production-side improvements:
- Improve fat and protein standardisation to maximise cheese yield from milk.
- Monitor yield batch-wise and investigate deviations immediately. Utilizing yield control systems can help systematically increase cheese production efficiency.
- Schedule preventive maintenance to reduce downtime; cheese production involves strict operational efficiency to maintain profitability.
Commercial strategies:
- Optimise product mix towards higher-contribution lines based on actual margin data.
- Gradually ramp up capacity utilisation rather than overproducing without demand. Manufacturers evaluating capacity expansion should ensure distribution is in place first.
- Develop institutional and HoReCa clients for volume stability.
Financial controls:
- Track contribution by product and by customer, customized based on actual realisations.
- Monitor receivable days strictly; enforce credit policy.
- Compare actual performance against DPR projections quarterly; revise budgets annually.
Risks That Can Reduce Profitability
Cheese manufacturing plant profitability is exposed to several operational, market and financial risks. Recognising these early supports better planning and more credible expenditure projections.
- Milk price volatility: Seasonal fluctuations and supply-demand imbalances can shift input costs sharply. Mitigation: Long-term procurement relationships, milk accounting systems and regional diversification of sourcing.
- Poor milk quality: Adulteration or high bacterial loads reduce yield and increase reject rates. Quality control is critical to avoid recalls and brand damage due to contamination risks. Mitigation: Rigorous incoming quality checks and supplier grading.
- Low capacity utilisation: Common in the first 2–3 years. Mitigation: Staged ramp-up aligned with confirmed demand.
- Cold-chain failures: Can render stock unsaleable. Mitigation: Backup power, temperature monitoring and robust cold-chain infrastructure.
- Working-capital strain: Delayed receivables and slow-moving aged inventory. Mitigation: Credit-policy discipline and inventory rotation protocols.
- Excessive debt: High gearing amplifies risk if margins compress. Mitigation: Conservative leverage, availing interest subvention under government schemes.
- Regulatory non-compliance: Implementing HACCP and sanitation procedures are essential in cheese manufacturing. Non-compliance leads to closure risk and reputational loss. Mitigation: Invest in quality infrastructure and regulatory compliance from day one.
Underestimating any of these in the DPR leads to optimistic projections that actual operations may not support. Risk analysis and mitigation planning are integral to any serious cheese plant ROI analysis and should be documented for lenders and investors.
Related Cheese Plant Guides
For readers conducting detailed feasibility work, the following guides on ProjectReportBank.com cover technical process, capex and revenue aspects in greater depth:
- Industrial cheese production process
- Cheese manufacturing plant setup cost in India
- Cheese plant machinery and equipment cost
- Cheese plant project cost and means of finance
- Cheese manufacturing plant revenue model
Each linked article covers its subject in dedicated detail. This article remains focused on profitability, margins and ROI analysis. For the full blog on any specific topic, follow the relevant link above. For analyst support or a special request, reach out through ProjectReportBank.com.
Preparing Financial Projections for a Cheese Plant DPR
A bankable DPR and CMA Data must present a coherent picture of cheese manufacturing plant profitability. Based on my practice, the most important considerations that lenders look for include:
- Installed and achievable capacity with a realistic ramp-up schedule
- Product-wise production plan and milk requirement, with validated yield assumptions
- Selling-price assumptions based on actual market feedback, not aspirational MRP
- Detailed project cost backed by machinery quotations, civil works estimates and pre-operative expenses
- Means of finance showing promoter contribution, term-loan and working-capital limits
- Projected profit and loss account, balance sheet, cash-flow statement and fund-flow statement for 7–10 years
- Break-even analysis, DSCR calculation, ROI and IRR estimates
- Clear loan-repayment schedule with sensitivity analysis
All projections must be grounded in verifiable data-local milk price data, actual quotations, conservative capacity assumptions and validated market realities. Financial analysis that relies on generic assumptions or inflated selling prices undermines credibility with lenders and investors.
CA Manish Gugliya, through ProjectReportBank.com, assists entrepreneurs and companies in preparing customised cheese plant DPRs, CMA Data and financial projections for bank finance and investment evaluation. No guaranteed loan sanction or profitability outcome is promised.
Conclusion
Cheese manufacturing plant profitability in India depends fundamentally on milk procurement cost, cheese yield, product mix, net realisation, operating expenditure control, capacity utilisation and disciplined working-capital management. The dairy market offers genuine opportunity-India’s milk production base of over 239 million tonnes and growing urban cheese demand provide a supportive structural backdrop.
However, even a technically well-designed cheese manufacturing plant can face financial stress if product demand, distribution arrangements, leverage and repayment schedules are not carefully planned. Profitability on paper means little if cash flows cannot sustain loan obligations and operational needs.
A structured approach to cheese manufacturing plant profitability-covering cost analysis, break-even, sensitivity checks and ROI metrics-is essential before committing capital. All illustrations in this article are indicative. Readers should base their final investment decisions on up-to-date data, detailed technical inputs and professional financial advice.
If you require project-specific financial projections, a bankable DPR or CMA Data for a cheese manufacturing project, you may consult CA Manish Gugliya through ProjectReportBank.com for customised, providing insights tailored to your facility requirements. No specific profit or loan outcome is guaranteed.
FAQs
Is a cheese manufacturing plant profitable in India?
Many Indian cheese plants operate profitably when they secure competitive milk supply, achieve good cheese yield, maintain capacity utilisation above their calculated break-even level and manage distribution and working capital efficiently. However, profitability depends on region, scale, product mix (for instance, mozzarella versus processed cheese), financing cost and management capability. Each project requires its own detailed feasibility study and customised financial projections before investment decisions are made.
How is cheese production cost per kilogram calculated?
Cheese production cost per kg includes cost of milk and cream, cultures and rennet, salt and ingredients, packaging material, utilities, direct labour and variable manufacturing overheads. For decision-making, distinguish between variable cost per kg (used for contribution analysis) and fully loaded cost per kg (which includes apportioned fixed costs like salaries, depreciation and other expenses). Milk accounting for the dominant share of variable cost makes procurement price the most sensitive input.
How does milk price affect cheese plant profitability?
Since milk can account for 70–85% of operating expenses, any increase in raw milk procurement cost directly reduces contribution per kg unless selling prices rise or yield improves proportionally. Investors should run sensitivity analysis showing the impact of 5–10% changes in milk price on contribution, EBITDA and break-even capacity. This is among the most important considerations before finalising project viability.
What capacity utilisation is usually required to reach break-even?
Break-even capacity utilisation varies by project but often falls between 60% and 80% of installed capacity in illustrative models, depending on contribution per kg and fixed-cost levels. This range is only indicative. Each cheese manufacturing unit must calculate its own break-even using its specific cost structure, expected net realisation and financing terms.
Which financial ratios are most important in a cheese plant DPR?
Lenders and investors typically focus on contribution margin, EBITDA margin, net profit margin, ROCE, project IRR, equity IRR, payback period and DSCR when assessing cheese manufacturing plant profitability. Additionally, projected balance-sheet strength, working-capital cycle indicators (inventory days, receivable days, payable days) and sensitivity of these ratios to changes in milk price and selling-price realisation are factors that influence investment decisions in a robust DPR.
Continue Exploring Our Cheese Project Guides
Explore all 17 guides covering cheese plant setup, products, financial planning, feasibility, bank loans and DPR preparation.