
Key Takeaways
- Cheese plant capacity must always be defined in two dimensions: milk-intake capacity in litres per day (LPD) and cheese output capacity in kilograms or tonnes per day (TPD). Specifying only one leads to mismatched equipment, procurement and financial projections.
- Product mix selection-whether mozzarella, processed cheese, cheddar or other cheese types-directly shapes installed capacity, yield assumptions, cold-storage sizing, working-capital requirements and overall profitability of the project.
- Realistic milk-to-cheese yield (typically 10–17% depending on cheese variety and milk composition), a phased production ramp-up schedule and adequate provision for brine salting, ageing and cold storage are non-negotiable elements of a bankable DPR and bank-loan proposal.
- Capacity utilisation in new Indian cheese plants commonly starts at 30–50% in year 1 and may reach 70–80% by year 3–5; inflating these numbers merely to improve DSCR on paper invites scrutiny from lenders.
- This guide is written from the practical, financial-feasibility perspective of CA Manish Gugliya, FCA and DISA (ICAI), for Indian cheese manufacturing projects from 2024–2026 onwards.
Introduction: Why Cheese Plant Capacity Planning Comes Before Machinery Orders
A pattern I see repeatedly: an Indian promoter receives a machinery quotation for a “10,000 LPD” or “20,000 LPD” cheese plant, commits a substantial deposit, and then discovers-months later-that dependable milk procurement in the region covers barely 60% of installed capacity, or that the local market cannot absorb the daily output of mozzarella and processed cheese the plant is designed to produce. By then, capital is locked, civil construction has begun and the project is shaping up for years of underutilisation or, worse, a stalled bank-loan application.
Cheese plant capacity planning is not about picking a number from a brochure. It involves two distinct dimensions that every serious DPR must specify: (a) milk intake capacity in litres per day-how much raw milk the plant can receive, chill, pasteurise and process-and (b) cheese output capacity in kilograms or tonnes per day-how much saleable cheese emerges at the packaging end after accounting for yield losses, whey, moisture and process downtime. A plant rated at 20,000 LPD milk intake may produce anywhere from 1.8 to 3.4 tonnes of cheese per day depending on the cheese types manufactured, the milk-to-cheese conversion ratio and the operational efficiency achieved.
Product mix and product assortment add another layer of complexity. Mozzarella, processed cheese and cheddar each impose different batch cycle times, equipment configurations, brine salting schedules, whey handling requirements, cold-storage volumes and working-capital cycles. A plant designed exclusively for mozzarella will have very different storage, ageing and capital profiles compared to one that includes a cheddar line requiring 30–90 days of maturation. These choices ripple through the DPR-from means of finance and profitability projections to the DSCR and repayment schedule.
This article focuses on how to determine appropriate cheese processing plant capacity, calculate daily milk requirements, estimate achievable capacity utilisation and design a commercially viable cheese plant product mix for industrial projects in India. It does not attempt to detail the entire industrial cheese production process, individual cheese-making procedures, or exhaustive machinery specifications-those subjects are covered in dedicated guides linked within this article.

What Is Cheese Plant Capacity Planning in Practical Terms?
Cheese plant capacity planning is the structured process of deciding how much milk the plant will process per day and how much saleable cheese it will produce annually, given the selected technology, product mix and realistic market demand. Planning the capacity of a cheese manufacturing plant involves balancing market demand and biological constraints-because milk is perishable, seasonal and variable in composition, and the production processes from milk preparation through the coagulation process to final packaging all have finite throughput windows.
Effective capacity planning requires balancing raw milk supply and multi-stage processing constraints. The key distinctions a promoter must understand are:
- Milk-handling capacity: the volume the milk reception, chilling and pasteurisation systems can process per hour or per day.
- Cheese-making capacity: the throughput of cheese vats, curd-handling equipment and moulding systems per batch.
- Batch capacity: kilograms of cheese per individual batch cycle in the vat.
- Daily production capacity: total cheese output in kg or tonnes per day across all batches and shifts.
- Annual installed capacity: the rated output assuming full utilisation across all planned operating days.
- Effective production capacity: installed capacity adjusted for cleaning, shift gaps, downtime, maintenance and changeovers.
- Saleable finished-product capacity: effective capacity minus process losses, trimming, rejected batches and moisture variation.
Two plants labelled “20,000 LPD” milk intake can have entirely different cheese production capacities and profitability. One plant making only fresh mozzarella at 14% yield and selling within 7 days will generate different daily despatch volumes, storage loads and cash-flow patterns than another plant splitting the same milk between cheddar (at ~10% yield with 60 days of ageing) and processed cheese blocks. In the DPR and CMA Data, capacity must therefore be expressed in both physical units-LPD, TPD, tonnes per annum-and in financial terms showing revenue potential at different utilisation levels in ₹ lakh or ₹ crore.
Units Used to Measure Cheese Manufacturing Plant Capacity
Banks, dairy engineers and project promoters frequently talk in different units. A DPR must reconcile these to avoid confusion and ensure that technical assumptions, financial projections and repayment schedules are internally consistent.
The standard units used in a cheese project include litres of milk processed per day, kilograms of cheese per batch, kilograms or tonnes of cheese per day, tonnes of cheese per year, number of batches per shift, number of working shifts per day, number of operating days per year (commonly 300–330 for Indian plants) and percentage of installed-capacity utilisation. For smaller or artisanal setups, daily target capacity can range from 300L to 2,000L of milk, while industrial plants handle 10,000 LPD upward.
| Unit | What It Represents | Primary User | DPR Chapter |
|---|---|---|---|
| Litres per day (LPD) | Daily milk intake | Technologist, Procurement | Technical, Raw Material |
| Kg per batch | Cheese output per vat cycle | Technologist, Engineer | Technical, Process Flow |
| Kg or Tonnes per day (TPD) | Daily cheese production | Promoter, Banker | Technical, Revenue |
| Tonnes per annum (TPA) | Annual installed cheese capacity | Banker, CA | Profitability, DSCR |
| Batches per shift | Production cycles per shift | Technologist | Technical |
| Operating shifts per day | 1, 2 or 3 shifts | Promoter, HR | Technical, Labour Cost |
| Operating days per year | Typically 300–330 in India | Promoter, CA | All Financial Chapters |
| Capacity utilisation (%) | Actual vs installed output | Banker, CA | Revenue, CMA, DSCR |
| Packs per hour | Packaging line output (retail/institutional packs) | Engineer, Marketing | Technical, Revenue |
Capacity expressed in tonnes per day or tonnes per annum is what drives financial projections and DSCR calculations. Batch capacity and milk-intake capacity are essential for engineering design. For processed cheese, mozzarella and cheddar, the packing line capacity-number of retail packs or institutional packs per hour-is also a practical unit that frequently becomes a production constraint if not sized correctly.
Factors That Determine the Appropriate Cheese Plant Capacity
Selecting the right size for an industrial cheese plant in India means arriving at a realistic, bankable capacity-not merely the maximum theoretical output a set of machines can deliver under ideal conditions. The factors below must be analysed systematically in the DPR, and each has direct implications for risk control: overcapacity leads to low utilisation and high fixed-cost burden, while undercapacity causes lost sales and production bottlenecks.
Consider a practical comparison. A 10 TPD cheese output plant may source milk from a 50-km procurement radius and serve regional distributors; a 30 TPD plant requires a far wider milk-collection network, larger cold-chain infrastructure and multi-state distribution to sustain utilisation. Both may be viable-but only if the underlying factors are honestly evaluated.
Availability and Quality of Milk for Cheese Production
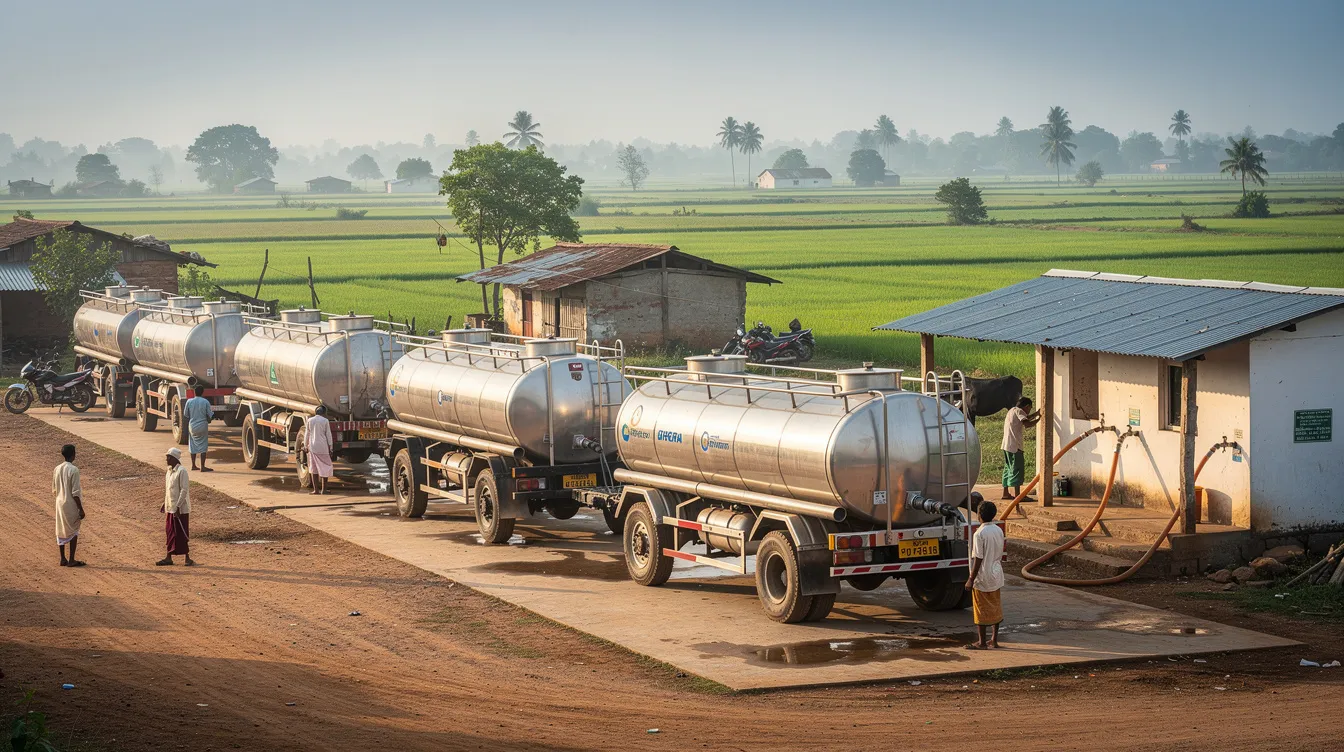
Dependable raw materials availability is the primary constraint for cheese factory capacity planning in India. India’s milk production in 2024–25 stood at approximately 250 million tonnes, but local availability varies enormously. Capacity planning in cheese production facilities requires balancing the biological nature of raw milk and processing windows-milk is perishable, and delays between procurement and pasteurisation cause quality losses that directly reduce cheese yield. Capacity planning must also manage raw milk variability and shelf life requirements across seasons.
Promoters must assess daily and seasonal milk intake capacity, procurement radius, chilling-centre network, raw material quality (milk fat, SNF and protein content), competition with other dairies and processors, and possible price volatility before freezing installed capacity. In most Indian states, flush season (October–January) delivers surplus milk while lean season (March–June) can reduce supply by 20–40%. You must account for raw milk seasonality to design baseline processing capacity around trough periods, not peak-season abundance. Milk supply availability requires aligning production goals with regional dairy farmer yields.
Installed capacity should not exceed realistically achievable milk procurement by a wide margin unless backed by a phased procurement plan and long-term tie-ups with farmers, co-operatives or milk unions. The cow versus buffalo milk mix also matters: buffalo milk yields higher fat and protein, giving significantly better cheese recovery for mozzarella and certain other cheese types-Indian research indicates mozzarella yield from buffalo milk can be nearly 50% higher than from cow milk alone. These differences must be reflected in the milk-to-cheese conversion ratios used in the DPR.
Milk-treatment limitations-such as pasteurisation capacity and cream separation-will surface as engineering bottlenecks later if ignored at the planning stage. Pasteurization typically occurs at 72–73°C for 15–20 seconds, and if the pasteuriser is undersized relative to milk intake, it constrains the entire downstream process.
Target Market, Sales Channel and Product Line Focus
Key market channels in India for cheese include:
- Branded retail through supermarkets, modern trade and kirana stores
- HORECA segment-hotels, restaurants and catering
- Quick-service restaurants (QSRs) and pizza chains
- Bakery and food-processing units using cheese as an ingredient
- Institutional kitchens, canteens and private-label or B2B buyers
- Export-eligible opportunities, where applicable
The dominant target segment directly influences product mix choices. Pizza chains and QSRs need mozzarella blocks or shredded packs. Retail consumers buy processed cheese slices, cubes and spreads. Industrial bakeries may prefer cheddar or processed cheese in bulk. These diverse consumer preferences shape what the plant must produce and in what pack sizes-retail packs versus institutional packs.
Use demand-driven capacity planning to size processing aggregates for peak demand. Market research should quantify realistic offtake by channel in year 1, year 3 and year 5, guiding the selection of a profitable cheese product mix and avoiding over-diversification of cheese types in the initial years. Demand forecasting involves analysing historical sales data and market trends. Adopt proactive demand forecasting strategies to manage seasonal peaks in cheese demand-and forecast demand by analysing market trends and seasonal fluctuations in milk supply.
The foodservice sector is expanding cheese demand significantly in India, and globally, the cheese market was valued at USD 98.0 billion in 2025, projected to reach USD 153.08 billion by 2034 at a CAGR of 5.1% from 2026 to 2034. Consumer demand for processed cheese is rising globally, and India’s own cheese consumption growth is estimated at over 20% per annum in the near term, driven by organised retail penetration and QSR expansion into Tier II and III cities.
Buyers’ minimum order quantities, credit terms and shelf-life expectations will shape daily production planning, batch sizes and cold-room capacity, which in turn determine optimal installed capacity.
Proposed Cheese Types and Product Assortment
Product assortment for an industrial cheese plant typically includes one or more major cheese types such as mozzarella, processed cheese, cheddar and selected value-added variants like cheese spreads or flavoured options. Cheese can be classified into hard, semi-hard and soft types, and the categories a promoter chooses have distinct implications for equipment, storage and capital.
Mozzarella is usually fresh or short-matured. Processed cheese is cooked and blended from base cheese. Cheddar requires longer ageing-sometimes 30 to 90 days or more. The same LPD milk intake therefore yields different daily despatch volumes and inventory levels across these cheese types. Cheese moisture content varies by type, affecting texture and flavor, and by extension, yield and storage requirements.
Product mix choices link directly to technical factors-brine salting requirements, cooking and stretching equipment needs, whey handling and ageing chambers-which together define effective production capacity. Promoters must decide which product lines will be manufactured from day one and which can be added in a second phase once the plant stabilises, as this bearing on capacity balancing and overall cheese plant capacity utilisation is significant.
Detailed production processes for each variety are covered in dedicated internal guides rather than replicated here.
Technology, Machinery Configuration and Line Flexibility
Cheese production line capacity is determined by the slowest unit operation. Whether it is the pasteuriser, batch cheese vats, curd handling, moulding, brine salting tanks, mozzarella cooking-stretching machine, processed-cheese cooker or packaging lines-the bottleneck sets the ceiling. Realistic capacity models should include peak simultaneous demand for utilities such as steam, refrigeration and water.
Promoters should decide between batch and semi-continuous lines based on plant size-for example, 1 TPD versus 10 TPD versus 25 TPD installed cheese output-and desired flexibility across product variations. Prevent cross-contamination during production by ensuring strict physical separation between zones, especially when handling multiple cheese types. The scope for future expansion-leaving civil and utilities provision for an additional cheese vat or packaging machine-should be built into the base design to avoid expensive rework later.
Automation level (manual, semi-automatic, fully automatic) affects achievable capacity per shift, manpower requirements, consistency and labor costs, but does not change the basic need for realistic milk and market planning. Detailed evaluation of cheese plant machinery and equipment cost and line balancing is covered in the dedicated internal guide.
For utility and waste management, plans must address high-volume water consumption and wastewater disposal systems at the design stage, not as an afterthought.
Working Shifts, Operating Days and Cleaning Time
The same machinery rated at 2 tonnes of cheese per 8-hour shift can deliver up to 6 tonnes per day if run in three shifts-provided milk procurement, manpower and demand support it. As a concrete example, a cheese vat system producing 800 kg per batch with two batches per shift delivers 1,600 kg in one shift and 4,800 kg in three shifts-a threefold difference from identical equipment.
Design for 75% to 80% operational capacity to allow for maintenance and sanitation downtime. Capacity planning must account for CIP (cleaning-in-place) time, changeovers between cheese types, brine salting cycles and maintenance windows that reduce effective production capacity versus nameplate capacity. Synchronize CIP downtime to account for sanitation cycles in production runs, and implement flexible batch scheduling to group similar product families sequentially to minimise changeover losses.
The DPR should clearly specify assumed working days per year-often 300–330 for Indian cheese plants-along with the proposed shift pattern in each project year as capacity utilisation ramps up. Processed cheese and mozzarella lines that require frequent flavour or pack-size changeovers need realistic allowances for cleaning and setup time, or capacity assumptions become overstated.
Storage, Brine Salting and Cheese Ageing Capacity
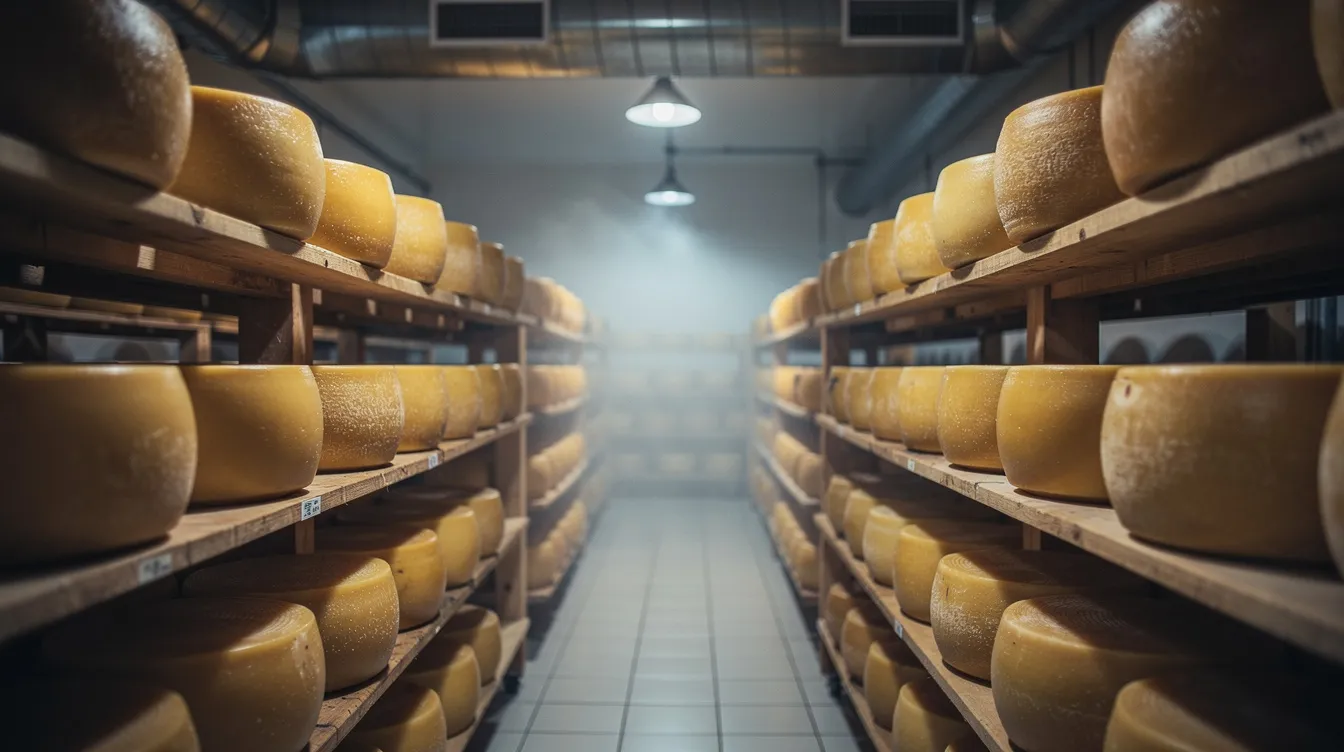
Plant capacity is not only about how much cheese can be produced per day but also about how much “green cheese” can be brine salted, chilled and aged at any given time. Aging and curing constraints are critical bottlenecks in cheese production capacity planning. Long-term inventory footprints for aged cheeses often dictate facility capacity rather than production-line speed.
Brine tanks, curing rooms and cold storage can become hard bottlenecks if their capacity is not aligned with production-line output. Calculate the aging footprint for aged cheeses to ensure sufficient curing space. Monitor utility and refrigeration limits to manage capacity for thermal processes in cheese manufacturing-ripening rooms require precise temperature control (5–15°C depending on cheese style) and humidity management that general cold stores often cannot provide.
Capacity planning must include inventory days for each product type: 1–7 days for most mozzarella, 30–90 days or more for cheddar. If a plant produces 2 TPD of cheddar, the curing rooms must hold 60–180 tonnes of cheese simultaneously at peak. As of June 2025, India had approximately 402.18 lakh metric tonnes of cold storage capacity nationally, with utilisation at around 70–75%, but much of this infrastructure is single-commodity (potatoes) or unsuitable for dairy-specific ageing. Insufficient ageing and cold-room capacity may force suboptimal product mix decisions-shifting from cheddar to more processed cheese, for instance-affecting the overall contribution margin.
Capital Availability, Working Capital and Phased Expansion
The promoter’s capital budget-both for fixed assets and working capital-sets a practical upper limit on plant capacity. Initial capital investment includes machinery and site development costs, but working capital for maturing cheese inventory (especially cheddar) can be equally substantial. Cheese manufacturing plant setup costs vary significantly by region-a plant in Punjab with existing dairy infrastructure will have different cost structures than one in a central Indian state without cold-chain access. For a detailed breakdown, refer to the guide on cheese manufacturing plant setup cost in India.
Financial and capital allocation balances capital expenditure against operational margins and return on investment. Build scalable, modular capacity to enable quick upsizing without major retrofits. Starting with core mozzarella and processed cheese lines at a moderate capacity, then adding cheddar or speciality cheeses once milk procurement, market demand and staff skills stabilise, is a proven approach to manage risk.
A bankable DPR should present a realistic ramp-up plan and phase-wise capital deployment-not a one-time oversized plant with unconvincing sales projections. Illustratively, a 5 TPD cheese output plant may require ₹8–15 crore in total project cost while a 15 TPD plant may need ₹25–45 crore or more, with proportionally higher working capital for inventory and distribution. These are indicative ranges only-actual costs depend on location, technology, product mix and civil-works scope.
Milk-to-Cheese Yield and Capacity Calculation
There is no universal milk-to-cheese conversion ratio. Yield varies with cheese type, milk composition (fat and protein content), standardisation practices, moisture targets and efficiency of the industrial cheese production process. Cheese production involves milk preparation, coagulation and packaging-but between those main stages, substantial variation in recovery is possible.
Factors influencing yield include:
- Cow versus buffalo milk (buffalo milk yields higher fat recovery and casein content)
- Fat and SNF adjustment, use of skim or whole milk
- Desired moisture and texture in the final product
- Brine salting time and whey drainage efficiency
- Use of rennet (which is used to coagulate milk into curd during cheesemaking) and starter cultures
- Process losses and rejected or downgraded product
- Account for milk-to-cheese ratios based on seasonal fluctuations in milk composition
During the coagulation process, curd grains are cut into small cubes to expel whey, and the efficiency of this step directly affects yield. Indian research on mozzarella with standardised milk (fat ~4.4%) has shown yields between approximately 11% and 17% depending on homogenisation pressure and moisture retention. Cheddar cheese typically yields about 10–11% of milk processed under standard Indian conditions.
Key Formulas for Cheese Production Capacity Calculation:
- Daily Cheese Output (kg) = Daily Milk Processed (litres) × Cheese Recovery Percentage
- Annual Installed Capacity (tonnes) = Daily Cheese Output (kg) × Operating Days ÷ 1,000
- Expected Annual Production (tonnes) = Annual Installed Capacity × Capacity Utilisation %
- Output of Each Product (tonnes) = Expected Annual Production × Product-Mix Percentage
Illustrative Example (2025, for reference only):
Consider a 20,000 LPD industrial cheese plant with the following assumptions:
| Parameter | Mozzarella Line | Processed Cheese Line |
|---|---|---|
| Milk allocated (LPD) | 12,000 | 8,000 |
| Assumed cheese recovery | 14% | 11% (from base cheese) |
| Daily cheese output (kg) | 1,680 | 880 |
| Operating days per year | 300 | 300 |
| Annual installed capacity (tonnes) | 504 | 264 |
| Year 1 capacity utilisation | 40% | 35% |
| Year 1 expected production (tonnes) | 201.6 | 92.4 |
| Year 3 capacity utilisation | 70% | 65% |
| Year 3 expected production (tonnes) | 352.8 | 171.6 |
These numbers are purely illustrative. Actual recovery must be validated through technical trials, machinery-supplier guarantees and product-specific processing assumptions. Processed cheese recovery is additionally complicated because processed cheese is made from a blend of natural cheeses plus emulsifying salts and moisture, so a direct milk-to-processed-cheese ratio is not straightforward.
Selecting the Right Cheese Plant Product Mix
Cheese plant product mix refers to the combination of cheese types, SKUs and pack sizes-such as mozzarella, processed cheese, cheddar, cheese spreads and selected product variations-produced by the plant over a given period. Getting this mix right is central to cheese factory capacity planning and profitability analysis.
Over-dependence on a single cheese variety increases concentration risk. If your sole product is mozzarella and a major pizza chain switches suppliers, utilisation drops overnight. Conversely, an excessively diversified product portfolio complicates production scheduling, inventory management and marketing spend-especially in the first two years when the plant is still stabilising.
Key criteria for selecting a commercially viable product mix:
- Local and regional demand validated through market research, not assumptions
- Confirmed or indicative institutional contracts and distribution arrangements
- Product shelf life and cold-chain requirements
- Contribution margin per kg after accounting for yield, packaging and storage
- Compatibility of production processes and equipment across cheese types
- Ageing period and its impact on cold-room sizing
- Packaging formats: retail packs versus institutional packs
- Working-capital cycle-how many days’ production sits in inventory before generating revenue
- Brand-development cost for each product category
- Distribution infrastructure including refrigerated transport
- Whey and by-product utilisation opportunities
Start with 2–3 strategic core products that follow similar distribution channels and share similar base cheese or process steps-for example, mozzarella plus processed cheese-before adding specialised variants like flavoured cheese or cheese sauces. Products that target similar customers and are similarly priced can share marketing spend and distribution infrastructure efficiently.
Major Cheese Products That Commonly Form the Product Mix
The main cheese products that Indian industrial plants typically include in their product lines are mozzarella cheese, processed cheese and cheddar cheese, sometimes supplemented by spreads, flavoured variants and by-products. Each has different demand patterns, milk-to-cheese yield, processing time, brine salting and storage needs, and therefore has a distinct impact on capacity utilisation and working capital.
The subsections below briefly cover market role and capacity implications. For detailed process descriptions, refer to the linked internal guides.
Mozzarella Cheese as a Capacity Anchor
Mozzarella cheese is often the anchor product for a commercial cheese processing plant in India because of strong and growing demand from pizza chains, QSRs, cloud kitchens and institutional food-service clients. Many company offers in the institutional segment rely on consistent supply of high-quality mozzarella with dependable meltability and stretchability-qualities that directly affect brand reputation.
Capacity-planning implications for a mozzarella-focused plant include relatively high daily throughput, shorter ageing, and a preference for larger institutional packs (2–5 kg blocks or shredded packs) that influence packaging-line capacity. Mozzarella typically has a distinct milk-to-cheese yield and brine salting schedule, which must be built into calculations of cheese production line capacity and cold-storage requirements.
Plants oriented towards mozzarella-heavy production should evaluate institutional contracts, frozen or chilled distribution capability and compatibility with a dedicated mozzarella cheese manufacturing plant configuration. A balanced product mix might still allocate a significant percentage of milk intake-for example, 50–70% in some illustrative models-to mozzarella in the initial years, shifting as the market and plant mature.
Processed Cheese and SKU Diversification
Processed cheese is made from a blend of natural cheeses-typically cheddar, mozzarella or a combination-blended with emulsifying salts and sometimes other dairy products to produce blocks, slices, cubes, spreads and institutional packs. This gives wide SKU planning flexibility. Consumer demand for processed cheese is rising globally and domestically, with processed cheese accounting for an estimated 60% of India’s cheese consumption by volume.
A processed cheese product line adds value through cooking and blending, can absorb surplus or off-spec base cheese within quality limits, and can help smooth product mix and sales mix over time. Capacity aspects to plan include cooker capacity (kg/hour), filling and packaging speeds, product-cooling and storage. All must be aligned with available base cheese production capacity.
Processed cheese targets both retail and food-service channels, so pack-size decisions significantly influence packaging-line capacity and daily achievable output. Detailed process and cost considerations for a processed cheese manufacturing plant are covered in the relevant internal guide.
Cheddar Cheese and Ageing Capacity
Cheddar cheese serves multiple roles: as a direct retail product, as a food-service cheese and as an ingredient or base cheese for processed cheese, making it a strategic component of the plant’s product portfolio. It provides depth to the product assortment and can command premium pricing in retail.
Cheddar requires a defined curing and ageing period-ranging from several weeks to many months depending on style-and this has a major impact on cold-room sizing and working-capital requirements. Capacity planning for a cheddar-centric product mix must calculate not only daily curd production but also peak tonnage of cheddar in maturation at any time, given the plant’s production ramp-up plan.
A dedicated cheddar cheese manufacturing plant article covers technology choices, salting methods and storage design. Here, the main concern is balancing cheddar output with available capital and cold-storage capacity. Plants often begin with moderate cheddar production and scale up as brands gain recognition and cash flows strengthen.
Other Value-Added Cheese Products and By-Products
Additional value-added products that may be introduced in later phases include:
- Cheese spreads and flavoured processed cheese-new flavors can attract consumers in the retail segment
- Cheese sauces for food-service and QSR applications
- Speciality cheeses such as cream cheese (a soft unripened cheese with a mild flavor), cottage cheese and blue cheese (which develops a blue-green mold during ripening)
- Whey cheese, produced by concentrating whey, often with added milk
- Whey-based beverages or whey powder
Each addition adds to product variations, process steps, packaging SKUs and quality-control requirements, which can reduce effective throughput if introduced prematurely. Whey utilisation can improve overall plant economics but requires additional equipment, utilities and storage capacity-justified in the DPR only with realistic demand estimates.
New entrepreneurs should initially focus on a limited but profitable product mix and consider these advanced options only after stabilising milk procurement, operational efficiency and market access. This subsection intentionally avoids deviating into unrelated dairy products like yogurt, butter or milk powder.
Illustrative Product-Mix and Capacity Scenarios
The following comparison presents three illustrative models of cheese plant product mix and capacity usage. These are intended as examples only-not industry standards. All percentages and capacities are dated to 2024–2026 conditions and are subject to change with market fluctuations and regional factors.
| Parameter | Scenario A: Mozzarella-Dominant | Scenario B: Mozzarella + Processed | Scenario C: Diversified |
|---|---|---|---|
| Main target market | Institutional (QSR, pizza chains) | Institutional + Retail | Institutional + Retail + B2B |
| Indicative product allocation | Mozzarella 75%, Processed 25% | Mozzarella 50%, Processed 40%, Other 10% | Mozzarella 40%, Processed 30%, Cheddar 25%, Other 5% |
| Principal operational advantage | High throughput, shorter inventory cycle | SKU diversification, dual-channel revenue | Broader market coverage, cheddar as premium anchor |
| Major risk | Concentration on few institutional buyers | Packaging-line complexity | Cold-storage and ageing capital, longer working-capital cycle |
| Storage and ageing requirement | Minimal ageing, standard cold room | Moderate cold room, minimal ageing | Substantial curing rooms for cheddar (30–90 days), large cold storage |
| Working-capital impact | Lower (fast inventory turnover) | Moderate | Higher (capital locked in maturing cheddar inventory) |
The final product mix must be based on updated market research, confirmed buyer intent and realistic milk availability in the promoter’s geography. No single scenario is universally superior-each suits a different set of market conditions, capital availability and risk appetite.

Cheese Plant Capacity Utilisation and Production Ramp-Up
New industrial cheese plants in India usually begin with lower capacity utilisation and ramp up gradually. Achieving 100% utilisation from day one is neither realistic nor expected by any experienced lender. The practical reasons include:
- Building and strengthening the milk procurement network takes time-milk quality and consistency improve over successive procurement cycles
- Product trials, quality standardisation and gaining FSSAI approvals require multiple batches
- Institutional customers (pizza chains, hotels) have their own approval processes that can take months
- Dealer and distributor networks must be appointed and developed
- Staff training, especially for making cheese with consistent taste and product quality across multiple variants, is an ongoing effort
- Initial engineering issues, maintenance and commissioning adjustments cause intermittent downtime
An illustrative year-wise capacity-utilisation schedule for a plant with 768 TPA installed capacity:
| Year | Installed Capacity (TPA) | Capacity Utilisation (%) | Expected Production (Tonnes) |
|---|---|---|---|
| Year 1 | 768 | 35% | 269 |
| Year 2 | 768 | 50% | 384 |
| Year 3 | 768 | 65% | 499 |
| Year 4 | 768 | 75% | 576 |
| Year 5 | 768 | 80% | 614 |
These figures are illustrative. Inflating early-year utilisation merely to make DSCR and profitability look attractive is a common practice that invites scrutiny from banks. Conservative but defensible assumptions, supported by a credible milk-procurement plan and marketing strategy, are better received.
Capacity-utilisation planning should explicitly differentiate between installed capacity and effective production capacity after downtime, as well as between milk-intake capacity and finished-cheese despatch capacity.
Machinery Bottlenecks and Capacity Balancing Across the Production Line
In cheese factory capacity planning, the overall capacity is constrained by the weakest link in the production chain-not by the largest or most expensive piece of equipment. You must identify the slowest continuous step in production to dictate the plant’s overall capacity and design for one-pass, bottleneck-focused flow to minimise handoffs and movements.
Likely bottlenecks include:
- Milk reception and pasteurisation rates-manage milk reception and pasteurization bottlenecks to ensure flow of raw milk and avoid spoilage
- Cheese vat filling and batch cycling
- Curd cutting and draining systems
- Pressing units for hard and semi-hard cheeses
- Mozzarella cooking and stretching machines
- Processed-cheese cookers and blending equipment
- Brine salting tanks (capacity and turnaround time)
- Packaging machines (speed, format flexibility)
- CIP systems (cleaning frequency and duration)
- Refrigeration and cold-storage capacity
Perform regular bottleneck analysis and throughput analyses to validate production capacity. Identify core bottlenecks in a cheese plant such as milk reception and pasteurisation rates, because these set the pace for everything downstream.
Engineering design should ensure that throughput at each major stage-measured in litres per hour or kg per hour-is balanced so that no equipment remains underutilised or overburdened. For example, if a pasteuriser is sized for 10,000 LPH but the cheese vat setup can handle only 5,000 LPH effectively, the practical utilisation drops to 50% unless additional vats are installed. This kind of imbalance is surprisingly common and must be corrected at design stage.
Detailed technical evaluation and cost implications are covered in the dedicated cheese plant machinery and equipment cost article.
Relationship Between Capacity, Product Mix and Profitability
Cheese plant capacity and product mix together determine revenue potential, cost structure, working-capital needs and ultimately profitability. High capacity with a weak product mix-or a premium product mix at underutilised capacity-may not be financially viable. Milk accounts for 70–80% of total operating expenses, which means that operating costs for cheese plants are 70–80% raw material expenses. This leaves limited room for error on yield, pricing or utilisation.
Each cheese type and SKU has its own average selling price, milk consumption per kg of final product, cheese recovery percentage, processing time, packaging cost, energy usage, storage time and credit terms-all of which affect contribution margin per kg. Gross profit margins for cheese production typically range from 30–40%, but this varies significantly by product and scale. The product with the highest selling price may not provide the highest contribution. A matured cheddar may fetch a premium but ties up capital in storage and incurs higher energy and packaging costs compared to high-throughput mozzarella.
| Financial Variable | Mozzarella (Illustrative) | Processed Cheese (Illustrative) | Cheddar (Illustrative) |
|---|---|---|---|
| Milk-to-cheese yield | 12–17% | ~11% (from base cheese) | 10–11% |
| Indicative net selling price (₹/kg) | ₹280–380 | ₹250–350 | ₹350–500 |
| Variable cost per kg (incl. milk) | ₹200–280 | ₹180–260 | ₹250–350 |
| Ageing days | 0–7 | 0–3 | 30–90+ |
| Inventory holding cost impact | Low | Low | High |
| Indicative contribution per kg | ₹60–120 | ₹50–100 | ₹70–150 |
All figures above are illustrative and will vary by scale, location, milk price, market channel and efficiency. The DPR and CMA Data should clearly show product-wise sales mix, contribution analysis and break-even, tying them back to the same capacity and utilisation assumptions used elsewhere in the project report.
Capacity Planning Inputs Required for a Bankable Cheese Plant DPR
Banks and financial institutions expect the capacity-planning section of a cheese plant DPR to be thorough, internally consistent and defensible. The following is a checklist of what they typically examine:
- Rationale for chosen plant capacity (LPD and TPD) with reference to milk supply and market demand
- Evidence of milk procurement availability-letters of intent, co-operative tie-ups, procurement radius data
- Proposed cheese types and product mix, with product-wise installed capacity
- Machinery-capacity justification-rated output at each stage, balanced across the production line
- Planned number of shifts and operating days, with basis for assumptions
- Technical yield assumptions by cheese type, supported by trials or supplier data
- Year-wise capacity-utilisation schedule, with realistic ramp-up
- Product-wise sales projections (volume and value), target markets and sales channels
- Storage, brine salting and maturation capacity relative to peak production
- Utilities at full capacity-power, steam, water, refrigeration
- Working-capital requirement for raw materials, work-in-progress and finished-goods inventory
- Break-even point calculation
- DSCR and loan-repayment schedule based on consistent volume and price assumptions
- Sensitivity analysis-impact of lower utilisation, higher milk prices or lower selling prices on DSCR
- Compliance with legal requirements including FSSAI standards and, where applicable, compliance with HACCP and FDA standards for export
All operational and technical inputs must flow through to financial projections-profit-and-loss statements, cash-flow statements and repayment schedules-without internal contradictions in volumes or selling prices. CA Manish Gugliya and ProjectReportBank.com assist promoters with preparing such bankable DPRs, financial projections and CMA Data. This is professional assistance in preparation-not certification of future results.
Common Cheese Plant Capacity-Planning Mistakes to Avoid
Many cheese plant proposals in India face questions from lenders because of simple but serious mistakes in capacity and product-mix planning.
Common errors include:
- Relying solely on one machinery quotation to determine capacity, without independently verifying milk availability or market demand
- Ignoring seasonal fluctuations in milk supply-building for flush-season volumes and then facing idle capacity for four months
- Using a single milk-to-cheese yield assumption for all cheese types, when mozzarella and cheddar have fundamentally different recovery rates
- Planning too many product lines initially-attempting to produce mozzarella, cheddar, processed cheese, spreads and cottage cheese from day one, overwhelming operations and quality control
- Assuming aggressive first-year capacity utilisation (70–80%) without confirmed institutional contracts or dealer networks
- Overlooking brine salting, ageing and cold-room constraints-discovering that the total number of curing days multiplied by daily cheddar output exceeds cold-room capacity by a wide margin
- Underestimating packaging capacity: production lines may generate 2 TPD of cheese, but if the packaging machine handles only 1.2 TPD, the balance sits unpackaged
- Ignoring CIP and changeover time-not accounting for 2–3 hours of cleaning per shift when switching between cheese types
- Assuming immediate institutional sales at full volume, when approval processes at major QSR chains commonly take 6–12 months
- Not budgeting sufficient working capital for maturing inventory, especially if 25–30% of output is cheddar with 60+ days of ageing
- Installing disproportionate upstream and downstream capacities-large pasteurisers paired with small vats, or high vat capacity with slow packaging equipment
- Preparing revenue projections that do not match the proposed product mix-showing 60% revenue from cheddar when the plant has ageing capacity for only 20% of output
One illustrative scenario (details anonymised): a mid-sized promoter in western India installed a 15,000 LPD cheese plant with three product lines-mozzarella, processed cheese and cheddar-and projected 65% utilisation in year 1. Milk procurement in the first lean season fell to 7,000 LPD, and the cold room was sized for only 30 tonnes of cheese at a time-sufficient for mozzarella but far short of the 90 tonnes needed when cheddar inventory accumulated over 60 days. The result was that cheddar production had to be suspended within three months of project completion, processed cheese was manufactured at half capacity due to lack of base cheese, and the actual year 1 utilisation was under 30%, creating severe cash-flow stress and market fluctuations in pricing that compounded losses.
Banks and investors tend to discount projections that appear to be driven by optimism rather than grounded analysis. Have technical and financial capacity assumptions independently reviewed before finalising the project report.
Related Cheese Plant Guides
- Cheese manufacturing plant setup cost in India – Understand how selected capacity affects total project investment including land, building, utilities and working capital.
- Cheese plant machinery and equipment cost – Detailed machinery sizing, rated output and cost analysis for cheese production equipment.
- Industrial cheese production process – Step-by-step process flow covering yield factors, whey handling and quality control.
- Mozzarella cheese manufacturing plant – Focused guide on mozzarella-specific capacity, institutional demand and plant configuration.
- Processed cheese manufacturing plant – Covers processed cheese line design, cooker sizing and SKU flexibility.
- Cheddar cheese manufacturing plant – Cheddar-specific ageing, storage planning and working-capital considerations.
Practical Recommendations from CA Manish Gugliya
Having prepared cheese plant DPRs, CMA Data and financial feasibility studies since 2006, I have seen enough projects succeed and struggle to offer some direct advice to promoters planning a cheese manufacturing project in India.
First, confirm your dependable milk availability-not just flush-season peak, but lean-season trough. If your soil-level survey of the procurement area suggests 12,000 LPD in January but only 7,000 LPD in May, build your base capacity around the lower figure and plan phased expansion. Clarify your target customer segments early: are you selling bulk mozzarella to two pizza chains, or are you building a retail brand with processed cheese slices in 200 g packs? These are fundamentally different businesses with different types of capacity, packaging, distribution and capital needs.
Finalise your initial product mix with no more than 2–3 products. Validate yield assumptions with dairy engineers and technologists-do not simply accept the percentage printed in a machinery catalogue. Prepare a detailed contribution analysis by cheese product, checking whether the proposed capacity and product mix are supported by your working-capital limits. Design a phased capacity-utilisation plan for at least 5–7 years, showing how procurement, production and sales grow in parallel.
Capacity should be commercially saleable, technically achievable and financially sustainable at Indian conditions-not merely the maximum number on a brochure for a cheese production line or processed-cheese cooker. An important factor I always emphasise: every number in your DPR must tell the same story. If your profitability statement shows 500 TPA of cheese, your raw-material plan must show the corresponding milk requirement, your machinery section must confirm the throughput, and your cold-storage plan must accommodate the resulting inventory. Internal inconsistency is what kills proposals at the bank’s desk.
If you are planning a cheese manufacturing project and need assistance with capacity assessment, DPR preparation, financial projections or CMA Data, I invite you to reach out through ProjectReportBank.com. I do not promise guaranteed loan approval or specific profit outcomes-what I offer is structured, experienced professional analysis that helps you present a credible, bankable project.
Conclusion: Integrating Capacity, Product Mix and Financial Viability
Successful cheese plant capacity planning integrates milk procurement, technology selection, cheese types, product mix, brine salting and ageing capacity, cold storage, working capital and risk assessment into one coherent plan. No single element can be planned in isolation-the capacity that goes into the DPR must be the same capacity that the procurement team can feed, the production team can achieve, the sales team can sell and the finance team can fund.
The promoter’s decisions on installed capacity, product mix and rollout schedule will directly influence profitability, DSCR and long-term sustainability. A carefully structured DPR with defensible capacity assumptions, supported by market evidence and technical validation, stands far better chances of securing bank finance and delivering the returns projected.
Entrepreneurs, dairy companies and project promoters considering a cheese manufacturing project in India are welcome to contact CA Manish Gugliya through ProjectReportBank.com for support on:
- Cheese manufacturing plant DPR and project report
- Capacity and product-mix assessment
- Project cost estimation and means of finance
- Financial projections and CMA Data assistance
- DSCR, break-even and repayment analysis
- Project feasibility analysis and cheese production planning for bank-loan DPR
Neither ProjectReportBank.com nor CA Manish Gugliya guarantees bank-loan sanction, subsidy approval, growth targets or specific profit outcomes. Professional analysis improves the quality of decisions and DPRs-the results depend on execution, market conditions and the promoter’s commitment.
Frequently Asked Questions
The following FAQs address common practical questions on cheese plant capacity planning and product-mix selection that may not have been fully covered in the main discussion. Answers are focused on Indian industrial and commercial cheese projects between 2024 and 2026.
How is cheese manufacturing plant capacity calculated for a DPR?
Start by determining the dependable daily milk intake in litres per day based on procurement studies. Apply product-wise milk-to-cheese yield percentages to estimate daily cheese output in kilograms for each cheese type. Select the number of operating days per year (typically 300–330). Compute annual installed capacity by multiplying daily output by operating days. Then apply realistic year-wise capacity-utilisation percentages-commonly 35–50% in year 1, rising to 70–80% by year 3–5-to arrive at expected annual production. Split this across the product mix to derive the cheese production capacity calculation for each product. Cross-check every figure against machinery-rated capacities, packaging-line speeds and cold-storage availability to ensure no stage is overcommitted. Final numbers must be validated with qualified dairy technologists and up-to-date specific requirements before submission to banks.
How much milk is required to produce one kilogram of cheese in practice?
For most semi-hard and hard natural cheeses, roughly 8–12 litres of milk per kg of cheese is a realistic range in Indian conditions, though this varies significantly. Mozzarella from standardised cow-buffalo milk at ~4% fat may require 6–9 litres per kg (at 11–17% yield). Cheddar typically needs 9–10 litres per kg (at ~10–11% yield). Processed cheese does not have a direct raw-milk-to-final-product ratio because processed cheese is made from a blend of natural cheeses plus other dairy ingredients and added moisture. Both cow and buffalo milk are used in India; buffalo milk generally delivers higher cheese yield per litre due to greater fat and protein content. These figures are illustrative-detailed technical design must rely on product-specific yield data and, where feasible, pilot trials.
Should cheese plant capacity be expressed in litres of milk or kilograms of cheese?
Both metrics are necessary. Milk-intake capacity in litres per day (LPD) is essential for procurement planning, pasteuriser sizing and process design. Cheese output capacity in kg per day (TPD) and tonnes per annum (TPA) is what drives sales projections, revenue calculations, profitability analysis and DSCR computation. Banks generally expect DPRs to present capacity in tonnes per year of saleable cheese. For mixed product lines, the DPR should break down capacity product-wise-TPA of mozzarella, processed cheese and cheddar-along with the underlying milk requirement for each.
Which cheese product mix is generally suitable for a new commercial plant in India?
Many new plants begin with a focused combination such as mozzarella plus processed cheese because of strong institutional and retail demand, manageable ageing requirements and moderate working-capital needs. Once the plant stabilises-typically by year 2–3-cheddar and speciality items can be added. However, there is no universally “best” product mix. The right combination depends on local market demand, existing competitor presence, distribution strengths, milk availability, ageing and cold-storage capacity and the promoter’s risk appetite. Region-specific market studies and, ideally, preliminary supply arrangements with QSRs or distributors should inform the decision before the product assortment is finalised in the DPR.
Can mozzarella, processed cheese and cheddar be produced in the same plant without losing efficiency?
It is technically feasible to produce mozzarella, processed cheese and cheddar in one integrated industrial cheese plant, provided the layout, equipment selection and cold storage are designed for this mixed product assortment. Combined plants must pay attention to line balancing-a common pasteuriser and cheese vats can be shared, but mozzarella stretching equipment and processed-cheese cooking units are typically separate. Adequate ageing rooms must be sized for cheddar. During initial years, many promoters choose to prioritise one or two main products for higher line efficiency and gradually expand to the full range after mastering operations and establishing market channels. Detailed engineering design should come from qualified dairy engineers and equipment suppliers, coordinated with the financial planning in the DPR.
Continue Exploring Our Cheese Project Guides
Explore all 17 guides covering cheese plant setup, products, financial planning, feasibility, bank loans and DPR preparation.