
A luxury hotel in India earns revenue from far more than just hotel rooms. Rooms, restaurants, banquets, weddings, spa services and a range of ancillary services together determine whether a project can repay its debt. This article explains how to build a realistic luxury hotel revenue model for your Detailed Project Report, with practical assumptions, illustrative calculations and guidance on what Indian banks actually examine during appraisal.
Key Takeaways
A luxury hotel revenue model is the foundation of every bankable hotel DPR. Before preparing financial projections, promoters should understand these essentials:
- A luxury hotel generates revenue from multiple streams-rooms, food and beverage outlets, banquets, weddings, conferences, spa, laundry, transport, retail and other guest services. Luxury hotels utilize a diversified mix of revenue streams to maximize profitability.
- Room revenue is usually the largest contributor, but in many Indian full-service hotels, non room revenue from F&B, events and wellness can collectively account for 35–50% of total revenue.
- Every revenue projection must start from operational drivers-room inventory, occupancy ramp-up, ARR, covers per restaurant, event days, spa utilisation-rather than arbitrary turnover percentages.
- Occupancy, ARR/ADR, RevPAR, banquet utilisation and guest spend assumptions must reflect the hotel’s specific location, competition, seasonality and positioning in the Indian market.
- All figures used in this article are illustrative assumptions. Actual performance depends on location, management quality, brand, competition and market conditions. This article is written as CA Manish Gugliya of ProjectReportBank.com, from the perspective of preparing bankable DPRs, CMA data and financial projections.
Explore Luxury / 4-Star & 5-Star Hotel Project Report Guides
Explore our complete Luxury, 4-Star and 5-Star Hotel Project Report and DPR guides covering setup cost, equipment, project cost, revenue, financial projections, occupancy, feasibility, project finance and bank loan assessment.
Introduction: Why Revenue Modelling Is Critical for Luxury Hotel DPRs
When a promoter approaches a bank for project finance to establish a 4-star or 5-star hotel, the lender’s primary question is not “how much will you invest?”-it is “how will you repay?” The answer lies entirely in the revenue model. In the hotel industry, revenue modelling is arguably the most important section of any Detailed Project Report because it determines projected EBITDA, cash accrual and the all-important DSCR (Debt Service Coverage Ratio).
Unlike simpler businesses, a luxury hotel’s total revenue is not generated from a single product line. A properly planned property can generate income through rooms, restaurants, coffee shops, bars, banquets, weddings, conferences, room service, spa and wellness, laundry, transport, business centre, retail concessions, memberships and other guest services. 81% of hotel executives expect a service model shift by 2025, reflecting just how rapidly the hospitality industry is evolving its revenue generation approach.
While preparing a luxury hotel DPR, I generally prefer to build revenue projections from detailed operational assumptions-room inventory, occupancy, ARR, covers, banquet utilisation and other measurable drivers-rather than beginning with an arbitrary turnover figure. Top-down targets like “we expect ₹200 crore revenue” are meaningless without bottom-up calculations backing them. For a complete understanding of how project cost and capital structure connect with revenue capacity, promoters should also study luxury hotel project cost and means of finance.
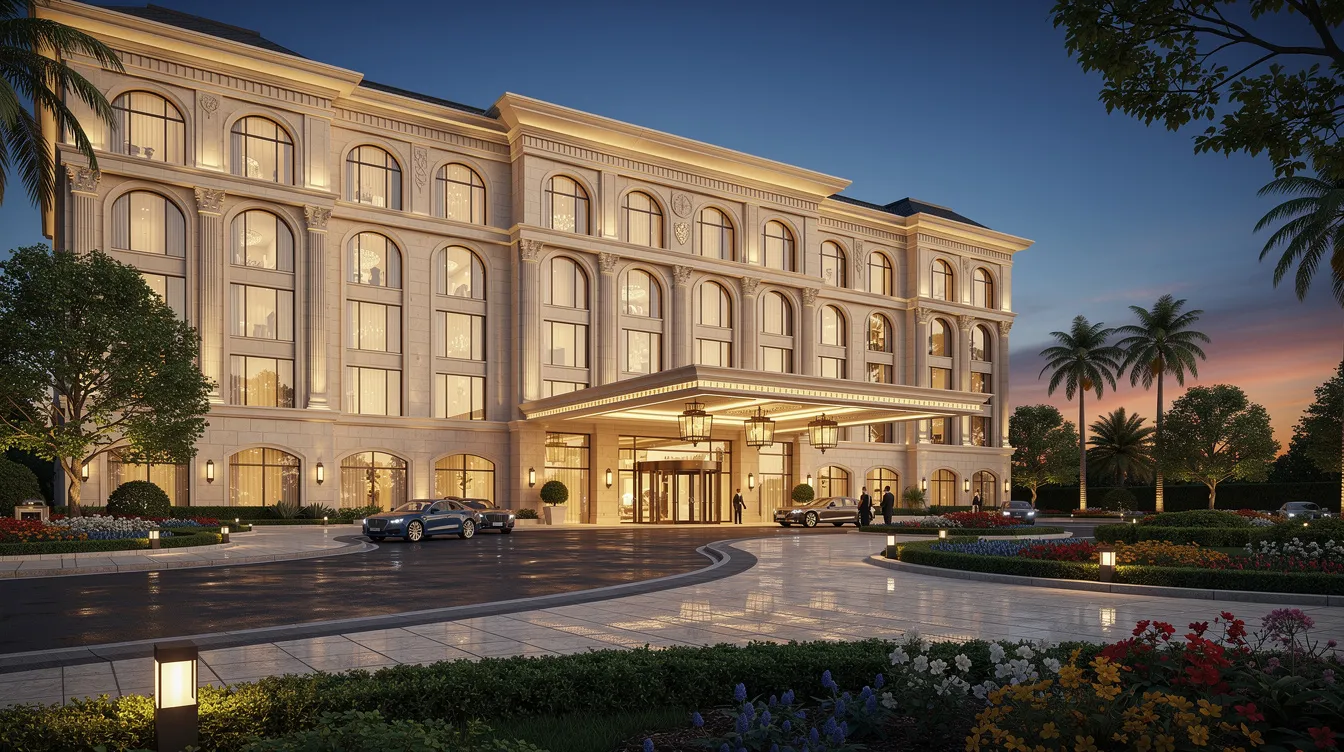
Understanding the Luxury Hotel Revenue Model
A luxury hotel revenue model captures the total hotel revenue a property can realistically generate across all its departments. From a DPR perspective, revenue falls into four broad categories:
- Room Revenue – income from selling room nights across different categories (standard rooms, deluxe, suites). Rooms revenue encompasses standard daily rates and high-end suites, and typically forms the core of the hotel’s profitability.
- F&B Revenue – income from restaurants, bars, lounges, in-room dining, coffee shops and mini-bars. Food and beverage revenue is a significant income source for luxury hotels.
- Banquet & Event Revenue – income from weddings, conferences, corporate events, exhibitions and social functions held in the hotel’s event spaces.
- Ancillary/Other Revenue – spa, wellness, laundry, transport, retail, memberships, travel desk commissions and other services.
A 5 star hotel revenue model in India is inherently “full-service,” meaning substantial capital is invested in creating facilities such as specialty restaurants, ballrooms, spas and business centres. Each facility must be monetised through corresponding revenue streams, and the DPR must demonstrate this. Luxury hotels rely on experiences and exclusivity for revenue generation-this is what justifies the premium capex.
Relying solely on room revenue can be risky. Downturns in travel, competition or seasonal dips can severely hit occupancy rates. Diversified luxury hotel revenue streams-strong F&B, active banquet business, wellness offerings-can stabilise cash flow through demand shocks. Recent data from Savills India and Hotelivate shows that in some Tier II and III city hotels, non-room revenues now contribute as much as 60% of total revenue. Key metrics like luxury hotel occupancy rate, hotel ARR/ADR and hotel RevPAR form the backbone of all financial projections.
Major Revenue Streams of a Luxury Hotel
The following table summarises the primary luxury hotel revenue sources, their drivers and calculation bases. These vary by property type-city hotel, resort, wedding venue, airport hotel-and by Indian location.
| Revenue Stream | Revenue Driver | Typical Calculation Basis | Key Variables |
|---|---|---|---|
| Rooms | Guest demand, corporate bookings | Occupied room nights × ARR | Room count, occupancy, rate, seasonality |
| All-day dining restaurant | In-house guests, walk-ins | Covers × average spend × operating days | Seat capacity, turnover, menu pricing |
| Specialty restaurant | Destination diners, hotel guests | Covers × average spend × operating days | Cuisine, positioning, local demand |
| Coffee shop / café | Casual visitors, guests | Covers × average spend | Location, footfall, hours |
| Bar / lounge | Evening guests, locals | Covers × average beverage spend | Licensing, ambience, events |
| Banquets & conferences | Corporate events, MICE | Event days × average billing per event | Hall capacity, demand, corporate base |
| Weddings & social events | Wedding demand, social functions | Event days × average wedding billing | Location, wedding season, reputation |
| Room service / in-room dining | Hotel guests | % of occupied rooms × average order | Room count, occupancy, menu |
| Spa & wellness | Guests and external visitors | Utilisation % × average treatment spend | Spa size, therapist count, pricing |
| Laundry | Guest usage | Volume (kg or pieces) × rate | Occupancy, guest profile |
| Transport / airport transfers | Guest arrivals and departures | Number of transfers × charge | Airport distance, fleet |
| Business centre | Corporate guests | Usage hours × rate | Demand, facilities |
| Retail / concessions | Guest and visitor footfall | Rental or commission income | Shop count, footfall |
| Memberships / club | Local residents | Members × annual fee | Facilities, local market |
| Other guest services | Miscellaneous | Volume × rate | Service type |
In many hotels globally, room revenue accounts for about 70% of total revenue, and luxury hotels generate roughly 30% of revenue from non-room sources. However, in Indian full-service properties-especially those with strong wedding or MICE potential-non-room share can be considerably higher. Using fixed “industry percentages” for F&B or spa is acceptable only as a high-level cross-check, never as the primary DPR method.
Room Revenue – Core Revenue Driver
Room revenue is the single largest revenue stream for most luxury hotels. Modelling it correctly in your DPR requires clear operational assumptions and transparent formulas.
Available Room Nights = Number of Rooms × Operating Days Occupied Room Nights = Available Room Nights × Occupancy Rate Room Revenue = Occupied Room Nights × Average Room Rate (ARR)
Key components to model include:
- Number of rooms by category (standard, deluxe, premium, suite)
- Operating days per year (typically 360–365, adjusted for planned maintenance)
- Weekday versus weekend room rates, peak season and off-season rate buckets
- Corporate rates, group rates, OTA rates and direct bookings-noting that direct bookings reduce OTA commissions by 15% to 25% and generate significantly higher net revenue per reservation
- Complimentary rooms (typically 1–3% of occupied room nights) and discount adjustments
- Inclusive packages (breakfast, airport transfers) that shift part of revenue between rooms and F&B heads
Illustrative Example: A 120-room luxury hotel in Jaipur, operating 365 days, with Year 1 occupancy at 60% and blended ARR of ₹7,000:
- Available room nights = 120 × 365 = 43,800
- Occupied room nights = 43,800 × 60% = 26,280
- Room revenue = 26,280 × ₹7,000 = ₹18.40 crore
This is purely illustrative. Realistic inventory control, demand forecasting and dynamic pricing strategies will influence actual achievement. Dynamic pricing adjusts room rates in real time based on demand, and hotels using AI-enabled systems see RevPAR increases of 5 to 10 percent. Optimizing online presence can significantly increase direct bookings, while loyalty programs also play a role-loyalty program membership grew 14.5% in 2024 to 675 million members globally. Repeat guests book more directly and cancel less, and loyalty fees average $5.46 per occupied room.

Occupancy Rate and Ramp-Up Assumptions
The occupancy rate measures the percentage of rooms sold out of total available room nights. It is perhaps the most scrutinised assumption in any luxury hotel revenue projection for bank loan purposes.
New luxury hotels in India rarely achieve mature occupancy from Day 1. Revenue managers typically expect a ramp-up over 3–5 years as the property builds brand recognition, corporate contracts and online reputation. An illustrative ramp-up schedule:
| Year | Illustrative Occupancy |
|---|---|
| Year 1 | 35% |
| Year 2 | 45% |
| Year 3 | 55% |
| Year 4 | 60% |
| Year 5 | 62% |
Assuming 75–80% occupancy from Year 1 is one of the most common DPR mistakes. Banks regularly challenge such projections. Occupancy assumptions should be supported by a brief market study covering existing room supply, demand generators (IT parks, industrial corridors, tourist attractions, wedding demand), competitor performance and transport connectivity. Understanding market demand in the local context is essential to maximize occupancy realistically.
ARR / ADR – Average Room Rate Modelling
Average daily rate (ADR) reflects revenue earned per occupied room. It is calculated as total room revenue divided by number of rooms sold. In the Jaipur example above, the blended ARR of ₹7,000 represents the weighted average price across all room categories, seasons and booking channels.
Factors influencing achievable ARR include hotel positioning (4-star versus 5-star), chain affiliation, location (metro versus Tier-2 city versus resort destination), competition, seasonality and guest mix. Strong brand equity allows luxury hotels to maintain high average daily rates, and luxury hotels emphasize customer willingness to pay over volume sales. Dynamic pricing protects brand equity by focusing on value-adding inclusions rather than deep discounting. Dynamic pricing helps avoid leaving money on the table during peak periods.
For DPR modelling, weekday versus weekend rates, peak versus off-season rates and event period premiums can be modelled as separate rate buckets to arrive at a realistic blended ARR. ARR growth assumptions of 4–6% per annum-aligned with inflation, market trends and brand strength-should be clearly documented. Dynamic pricing strategies consider competitor pricing and local events to optimise this further.
RevPAR – Revenue per Available Room
RevPAR combines occupancy and ADR into one metric, providing a more complete picture of room revenue efficiency.
- RevPAR = ARR × Occupancy Rate
- Or: RevPAR = Room Revenue ÷ Available Room Nights
- Using the Jaipur example: RevPAR = ₹7,000 × 60% = ₹4,200 per available room night
Luxury hotels prioritize total revenue per available room for profitability. Total revenue management shifts focus from RevPAR to TRevPAR, which includes all revenue generated per available room-rooms, F&B, spa, ancillaries. Similarly, GOPPAR measures gross operating profit per available room, connecting revenue to the hotel’s profitability at an operational level.
RevPAR is useful for benchmarking projected performance against comparable hotel properties. While banks in India may not always request RevPAR specifically, presenting it demonstrates that your revenue assumptions are internally consistent. Promoters should benchmark projected RevPAR against realistic expectations from comparable hotels, without copying exact figures, to avoid unrealistic luxury hotel revenue projections.
Food & Beverage Revenue Model (Restaurants, Bars & In-Room Dining)
Food and beverage encompasses everything from specialty restaurants to exclusive bars, and is a major revenue centre in many hotels. Typical F&B outlets in a luxury hotel DPR include all-day dining, specialty restaurants, coffee shop, bar/lounge, poolside service, in-room dining and mini-bar.
Main methods to estimate luxury hotel F&B revenue in a DPR:
- Revenue per occupied room basis: Assume a percentage of guests using F&B outlets and their average spend
- Covers × average spend per cover: For each outlet, model seat capacity, daily covers, average guest spend and seat turnover (e.g., 1.5–2.0 turns at dinner on weekends)
- Package-linked meals: MAP or AP inclusions allocated between rooms and F&B-handle carefully to avoid double-counting complimentary breakfast in both heads
- Banquet-linked F&B: Catering revenue from events
For a serious DPR, outlet-wise calculation is more credible. For example, a 100-seat all-day dining outlet in a Gurgaon business hotel: assuming 55% average seat utilisation across meals, average spend of ₹2,200 per cover, and 360 operating days produces annual revenue of approximately ₹4.36 crore. This is illustrative-actual outcomes depend on cuisine, local competition, marketing strategies and the property’s ability to attract more guests beyond in-house visitors.
Food and beverage revenue can also benefit from private dining offerings, upselling premium menus and attracting local clientele. Upselling increases revenue from guests at no additional marketing cost, and integrating upsell offers into customer relationship management systems increases guest engagement. Hyper-personalization utilizes CRM systems for tailored guest experiences, which directly affects guest spend and guest satisfaction.
The kitchen equipment, back-of-house infrastructure and service investments required to support F&B revenue are significant. Promoters should study the luxury hotel equipment, furniture and FF&E list with cost to ensure capex assumptions align with planned revenue outlets.
Banquet, Wedding & Conference Revenue Model
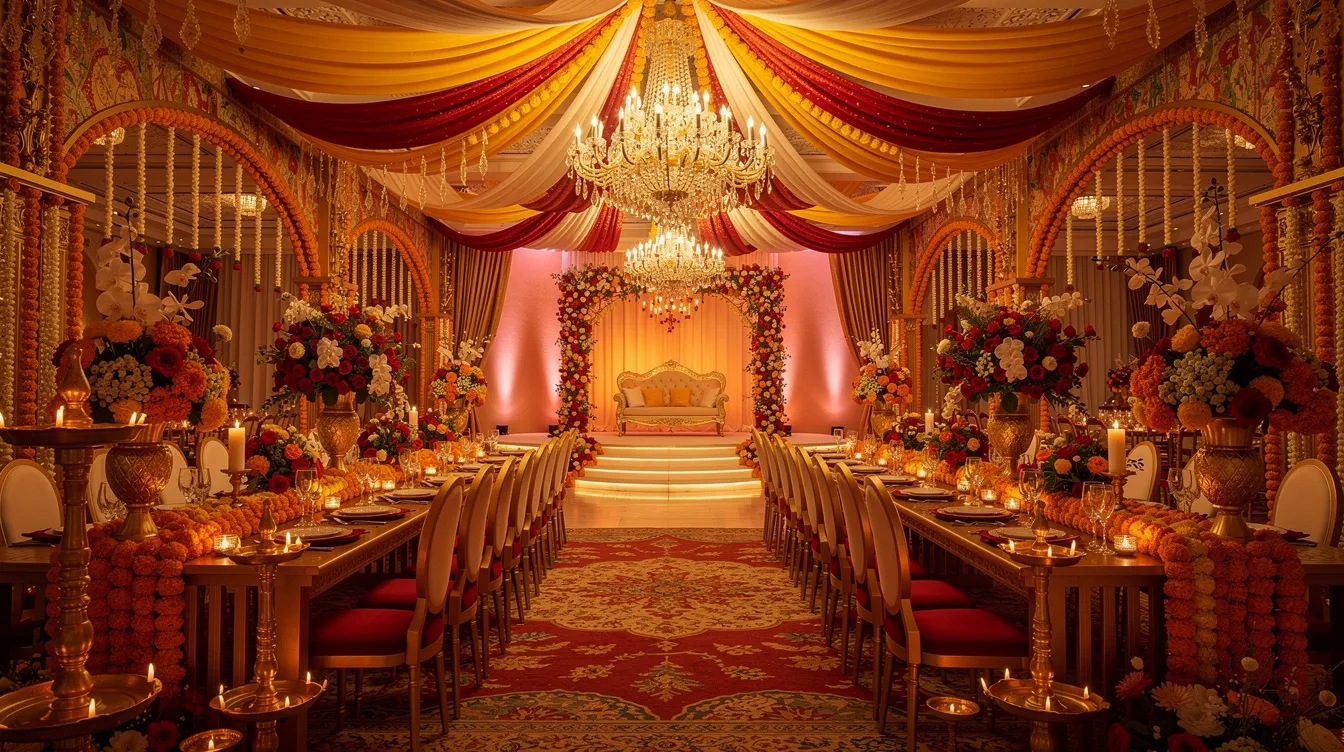
Banquets and event spaces can generate high-margin revenue independent of room occupancy, making them a powerful component of the luxury hotel revenue model in India. Events and weddings generate high-volume revenue through group bookings, often including room blocks, catering, décor and transport.
Event types include weddings, receptions, pre-wedding functions (sangeet, mehendi), corporate conferences, dealer meets, exhibitions and social functions. Revenue components typically include venue hire, per-plate food packages, beverage packages, audio-visual charges, décor coordination fees and service charges.
Modelling approach:
- Large events: Number of Event Days × Average Revenue per Event Day
- Smaller events: Number of Function Bookings × Average Billing per Booking
Illustrative example: A wedding-destination hotel in Udaipur might project 45 major wedding/event days per year at an average billing of ₹25 lakh per event, plus 75 smaller corporate or social events at ₹5 lakh each. This yields approximately ₹14.90 crore from banquets alone. These figures are location-specific and illustrative.
Wedding and banquet potential should never be overstated. Assumptions must align with local demand, competition, hall capacities, lead times and seasonal patterns. 49% of hotel executives agree special amenities are critical for revenue, underscoring the importance of investing in banquet infrastructure thoughtfully.
Spa, Wellness & Other Ancillary Revenue
Luxury hotels can earn significant revenue from ancillary services and events beyond rooms and F&B. Spa and wellness offerings include bespoke treatments and fitness coaching, while ancillary services include airport transfers and curated local excursions.
Common ancillary revenue heads:
- Spa treatments, salon services and wellness packages (yoga, meditation)
- Gym and health club memberships for local residents
- Laundry and dry cleaning
- Airport transfers and chauffeur services
- Business centre, parking and retail/concession income
- Travel desk commissions, equipment rental and guest activities
- Spa access as a separately chargeable service or part of premium packages
Spa services can generate substantial revenue from guests and external visitors. Local partnerships can attract higher-value guests and generate commission income. Personalized upselling can significantly boost ancillary revenue, and loyalty programs drive higher ancillary spending from guests. Loyalty programs also help generate reviews that attract new guests.
Each head is modelled using volume × rate assumptions: for example, 20% of in-house guests using the spa at an average spend of ₹2,500. Revenue heads should be included in the DPR only if the hotel will genuinely offer those services and has the required space and capex. Smaller heads can be clubbed under “Other Operating Income” with a consolidated assumption, provided the basis is explained.
Illustrative Luxury Hotel Revenue Model – Year 1 Snapshot
The following numerical example is purely illustrative and should not be treated as a standard revenue benchmark. Actual financial performance will vary by location, brand, competition and management quality.
Hypothetical Hotel: 150-room luxury city hotel in Pune, operating 360 days, Year 1.
| Revenue Line | Assumption | Revenue Estimate (₹ Crore) |
|---|---|---|
| Rooms | 150 rooms × 360 days × 50% occupancy × ₹10,000 ARR | 27.00 |
| F&B (restaurants, bar, in-room dining) | ~60% of room revenue (outlet-wise built up) | 16.20 |
| Banquets & Events | 40 event days × ₹20 lakh average | 8.00 |
| Spa & Wellness | 20% of guests × avg ₹2,000 spend | 1.08 |
| Other Ancillary (laundry, transfers, retail) | ~10% of room revenue | 2.70 |
| Total Operating Revenue | 54.98 |
Revenue Mix:
| Revenue Type | % of Total |
|---|---|
| Rooms | ~49% |
| F&B | ~29% |
| Banquets/Events | ~15% |
| Spa & Other | ~7% |
Each line is derived from operational assumptions-occupied room nights, covers and average spend, event days and billing, spa usage rates. This example can be adapted for different Indian cities, resorts or airport hotels in a customised luxury hotel project report revenue model. The average price per room and per cover should always reflect local competitive realities.
Five-Year Luxury Hotel Revenue Projection & Revenue Mix
Revenue grows over five years primarily through occupancy ramp-up and ARR escalation.
| Year | Occupancy | ARR (₹) | Rooms Revenue (₹ Cr) | F&B (₹ Cr) | Banquets (₹ Cr) | Other (₹ Cr) | Total (₹ Cr) |
|---|---|---|---|---|---|---|---|
| Year 1 | 50% | 10,000 | 27.00 | 16.20 | 8.00 | 3.78 | 54.98 |
| Year 2 | 60% | 10,500 | 34.02 | 19.44 | 9.50 | 4.50 | 67.46 |
| Year 3 | 65% | 11,025 | 38.69 | 21.39 | 10.50 | 5.00 | 75.58 |
| Year 4 | 70% | 11,576 | 43.74 | 23.31 | 11.50 | 5.50 | 84.05 |
| Year 5 | 72% | 12,155 | 47.24 | 24.48 | 12.10 | 5.90 | 89.72 |
Over time, the rooms contribution tends to stabilise at 55–65% in city business hotels, while wedding or resort properties may see banquet and F&B shares rise to 40–50%. Banks will examine whether year-on-year growth looks reasonable for the specific market rather than accepting arbitrary 15–20% annual increases. Revenue strategy should adapt each year based on data analysis and analyzing historical data from the first years of operation.
Seasonality & Demand Patterns in Luxury Hotel Revenue
Seasonality significantly affects every line of the hotel revenue model in India. Typical patterns include:
- Peak seasons: October–March for tourism in many regions; November–February and April–May for weddings
- Off-seasons: Summer months (April–June) in most cities; monsoon months in regions with heavy rains
- Corporate demand: More stable on weekdays; peaks during conferences and trade fairs
Projections prepared month-wise or quarter-wise are more credible with banks than flat annual averages. Revenue management systems help forecast demand and monitor competitor rates, while continuous dynamic pricing allows for thousands of price points updated frequently. Luxury hotels often utilize sophisticated data tools for pricing decisions and adjusting room rates based on real-time demand.
Seasonality also affects F&B (festive menus, weekend brunch demand), banquet bookings (wedding season concentration), spa usage and other new revenue streams. Understanding these patterns improves both hotel revenue management and inventory control, helping align staffing and operating costs with expected market demand.
Revenue Assumptions for a Bankable Luxury Hotel DPR
The key revenue-related assumptions that must be clearly documented in a DPR include:
- Room inventory by category, operating days and annual occupancy by year
- ARR by year with rate escalation rationale
- F&B seating capacity by outlet, expected covers, average spend per cover
- Banquet hall capacity, expected event days and average billing
- Spa utilisation rates and average treatment spend
- Other income heads with volume × rate basis
- Annual escalation rates aligned with inflation and brand growth
Transparent, well-structured assumptions enhance the credibility of luxury hotel financial projections for bank loan appraisal. Assumptions must be internally consistent-banquet revenue should correlate with event days and F&B outputs, and planned facilities should tie back to capex. Cloud-based property management systems streamline hotel operations and guest data, while data dashboards consolidate key metrics for informed marketing and pricing decisions.
Promoters should include assumption tables or annexures within the DPR to make it easy for lenders to follow the logic from operational inputs to financial outputs. This provides valuable insight into the project’s revenue generation potential.
Connecting Revenue Model to Operating Expenses, EBITDA & DSCR
Revenue is not profit. The revenue model must flow logically into operating expenses and profitability.
Major cost heads driven by revenue volumes include employee cost, food and beverage material cost (typically 60–68% of F&B revenue), utilities, housekeeping, repairs, sales and marketing, OTA commissions, administration and management/brand fees. Operational efficiency in managing these costs is critical.
The financial flow in projections:
- Total Revenue → Departmental Expenses → Departmental Income
- Less Undistributed Expenses → Gross Operating Profit (GOP) / EBITDA
- Less Depreciation and Interest → Profit After Tax → Cash Accrual
- Cash Accrual must cover Debt Service (interest + principal) → DSCR
GOPPAR measures gross operating profit per available room, connecting revenue directly to the hotel’s profitability. Lenders in India typically expect DSCR of 1.25× to 1.40× over the loan tenure. They focus on whether projected EBITDA and cash accrual based on realistic revenue assumptions can sustain term loan repayment. Managing revenue effectively is therefore not just an operational goal-it directly determines bankability.
Sensitivity Analysis & Common Revenue Projection Mistakes
Capital-intensive hotel projects demand sensitivity analysis. A simple three-scenario framework works well:
| Scenario | Assumption Change | Impact |
|---|---|---|
| Base Case | As projected | DSCR meets requirement |
| Moderate Stress | 10% lower occupancy and F&B revenue | DSCR may dip but remains above 1.0× |
| Higher Stress | 15–20% lower revenue + 5% cost increase | Tests whether DSCR survives adversity |
Common mistakes I frequently observe in luxury hotel revenue models:
- Assuming very high occupancy (70%+) from Year 1 without ramp-up
- Setting unrealistically high ARR compared to local competition without brand premium
- Ignoring seasonality and applying flat annual assumptions
- Double-counting breakfast revenue in both rooms and F&B
- Overstating banquet and wedding revenue without local demand evidence
- Applying identical growth percentages across all revenue heads without rationale
- Confusing revenue with profit-projecting high turnover but failing to model corresponding costs
- Ignoring how room upgrades, early check in policies and complimentary breakfast affect net revenue
In my practice, conservative yet realistic revenue assumptions often strengthen the DPR during bank discussions. Banks appreciate caution supported by logic more than optimism unsupported by data. I always advise promoters to discuss assumptions with experienced operators or brand partners before finalising. Hotels leveraging AI revenue management see RevPAR increases of 5% to 10%, but such tools must be part of the post-opening operational plan, not baked into opening-year projections as guaranteed outcomes.
How Banks Evaluate Luxury Hotel Revenue Assumptions in India
Banks scrutinise hotel revenue assumptions for DPR through multiple lenses. Typical factors lenders examine:
- City and micro-location, access, visibility and connectivity
- Demand generators: corporate offices, tourist flows, weddings, MICE potential, local events
- Competition set: existing hotels, their occupancy, ADR and positioning
- Proposed star category, brand or management arrangement
- Promoters’ track record, experience and equity contribution
- Banquet capacity and utilisation potential
- Projected occupancy, ARR, RevPAR and revenue mix benchmarks
Banks compare projections with market data-sometimes referencing published surveys from industry bodies or third-party consultants. They also run their own stress tests, reducing revenue by 10–15% to check if DSCR remains adequate. There is no single universal appraisal policy across all banks; each institution has its own risk appetite. However, well-documented, logically derived hotel revenue assumptions for DPR significantly improve the chances of smooth appraisal, though loan sanction always remains at the lender’s discretion. Business intelligence tools and historical data can help promoters present a stronger case.
Revenue Model Variations by Luxury Hotel Type
The same revenue assumptions should never be copied from one hotel project to another. Revenue characteristics differ significantly:
- City luxury hotel: High weekday occupancy, strong corporate rate mix; banquet revenue moderate; ancillary income steady from transport and retail
- Destination resort: Strong peak-season leisure demand; ARR varies widely by season; wellness, touring and guest journey experiences are major revenue contributors
- Wedding-focused hotel: Lower weekday occupancy but very strong seasonal banquet and wedding revenue; F&B share may exceed 40%
- Airport luxury hotel: Consistent transit corporate demand; fewer weddings; F&B may be strong due to traveller footfall; limited event spaces
- Tier II/III city hotel: Lower ARR but potentially higher banquet share; generating demand from local social events can compensate for weaker corporate room demand
Asset-light management models reduce capital risk for luxury hotel brands, making branded properties increasingly common across these categories. Each luxury hotel revenue model must be customised to the specific concept, location and target guest profile. DPRs should briefly explain the chosen business model and how it shapes the expected revenue mix. Yield management and revenue management approaches will also differ across these property types.
Practical Checklist Before Building Your Luxury Hotel Revenue Model
Before attempting detailed luxury hotel revenue projections, promoters should gather:
- Number and category of hotel rooms, proposed rack rates and package ideas
- Competitor tariffs and occupancy from public sources or consultants
- Expected occupancy by season and year
- Restaurant seating capacities, planned cuisines and target segments
- Expected daily covers by outlet and average F&B spend per guest type
- Banquet hall sizes, capacities and expected number of weddings/events per year
- Spa area, service menu and pricing
- Planned other income generators-laundry, transfers, memberships, retail, activities
- Brand or management agreement status
- Local demand generators-corporate offices, institutions, tourist attractions, local businesses
- Any tie-ups for experiences or MICE demand
Having this information ready significantly improves the quality and credibility of the luxury hotel project report revenue model and helps boost hotel revenue projections during bank appraisal. Guest expectations and guest retention strategies should also be considered as part of the broader revenue strategy and data analysis process.
Conclusion – From Revenue Model to Bankable Project Report
A credible luxury hotel revenue model is built from measurable operational drivers-room inventory, occupancy ramp-up, ARR, covers per outlet, event days and ancillary utilisation-not arbitrary turnover targets. The logical chain is clear:
Rooms + F&B + Banquets + Other Income → Total Revenue → Operating Profit/EBITDA → Cash Accrual → DSCR → Repayment Capacity
Detailed, transparent revenue workings help promoters, investors and lenders understand both the potential and the risk. They also form the basis for responsible dynamic pricing, revenue management and operational efficiency once the hotel opens. Revenue management systems, property management systems and CRM tools will all play a role in whether projected revenues are achieved-but the DPR must first establish a realistic baseline.
If you are planning a luxury hotel, 4-star or 5-star property in India and require assistance with a customised project report, DPR, CMA data or financial projections for bank finance, you are welcome to reach out to me at ProjectReportBank.com. Every project is different, and every revenue model must be built to reflect its specific reality. Neither profitability, occupancy levels nor loan sanction can be guaranteed-but a professionally prepared DPR can certainly increase revenue potential and improve your prospects with lenders.

Frequently Asked Questions (FAQ)
How do you calculate revenue of a new luxury hotel for a DPR?
Revenue is calculated by breaking it into components: hotel room revenue calculation (occupied room nights × ARR), F&B from restaurants and bars (covers × average spend per cover × operating days), banquet and event revenue (event days × average billing) and ancillary services (volume × rate per service). Each calculation should be based on realistic utilisation assumptions rooted in local market demand, competitor benchmarking and expected ramp-up, rather than flat percentages of project cost. Together, these calculations form the luxury hotel revenue projection used in the Profit and Loss, cash flow and DSCR analysis. Revenue per available room and other key metrics should be derived from these bottom-up workings. Many hotels also generate revenue through services like security service for events, where performing security verification and access control at large functions becomes a billable service. In the digital realm, online booking platforms use security verification to protect against malicious bots, and once verification successful, bookings are confirmed-these processes are handled by the hotel’s online travel agencies and direct booking channels, sometimes tracked via a respond ray id for technical troubleshooting.
What is a reasonable occupancy rate for a luxury or 5-star hotel in India?
There is no single “good” occupancy rate. In many Indian cities, mature luxury hotels might stabilise between roughly 55–70% depending on the market, brand and location. IHCL’s standalone properties, for instance, report occupancy around 75% at stabilisation. However, new hotels should assume substantially lower ramp-up occupancy in initial years-often starting at 35–50% and building gradually over 4–5 years.
Promoters should derive their luxury hotel occupancy rate assumptions from a market study covering existing supply, demand generators, competition and seasonality patterns, and present a gradual progression rather than assuming immediate stabilisation. To maximize revenue, repeat business should be encouraged through loyalty programs and guest retention strategies.
How many years of financial projections should a luxury hotel DPR contain?
Most bankable DPRs in India for hotel projects typically present at least 7–10 years of financial projections. Some lenders focus primarily on the loan tenure period (often 7–9 years for term loans). It is advisable to include detailed year-wise revenue, expense, profitability and DSCR projections for at least the initial 5 years when ramp-up occurs, with extended projections covering full debt repayment. All figures should be clearly marked as estimates based on stated assumptions.
Can wedding and banquet revenue be included in a luxury hotel project report?
Yes-wedding and banquet revenue can and should be included if the proposed hotel has suitable event spaces and is located in a market where such demand exists. Indian wedding destinations like Udaipur, Jaipur and Goa have demonstrated strong wedding revenue potential. However, assumptions about number of events, average billing and seasonality must be conservative and supported by local data. Simply assuming high wedding income without evidence can weaken the DPR during bank appraisal. Analyze data from comparable properties before finalising these projections.
Do banks in India verify the ARR and RevPAR assumptions used in hotel DPRs?
Banks do not formally “certify” ARR or RevPAR, but they cross-check these assumptions against market information, comparable properties and sometimes third-party reports such as those from Hotelivate or STR. If projected ARR and RevPAR are significantly above prevailing levels without strong justification-unique location, established brand, exceptional positioning-lenders may scale down revenue projections for their internal assessment. Well-documented, benchmark-supported assumptions increase revenue model credibility and improve the hotel’s profitability outlook in the bank’s eyes.
Explore More Luxury / 4-Star & 5-Star Hotel Project Report Guides
Continue exploring our Luxury, 4-Star and 5-Star Hotel DPR guides covering setup cost, equipment, project cost, revenue, financial projections, occupancy, feasibility, project finance and bank loan assessment.