
Key Takeaways
- A luxury hotel’s viability depends on the full chain – available rooms, realistic occupancy ramp-up, achievable average room rate, RevPAR, gross operating profit and debt-servicing capacity – not just “number of rooms × rack rate.” Projections built on inflated assumptions collapse during bank appraisal.
- For a 100-room luxury or 5-star hotel in India, even small changes – 5 percentage points in occupancy or ₹500 in ARR – can shift annual room revenue by ₹1–2 crore. DPR assumptions must therefore be conservative and backed by local market data.
- RevPAR (ARR × occupancy) is the central metric linking pricing and utilisation. Banks, NBFCs and equity investors focus on RevPAR trends along with gross operating profit and DSCR, not just headline tariffs or the “5-star” label.
- Break-even occupancy is usually well below the occupancy level needed for comfortable term-loan repayment. Project reports must analyse operating break-even, project break-even and DSCR as separate, related metrics.
- Realistic ramp-up (for example, 45–50% occupancy in Year 1 for a new luxury property) and sensitivity analysis covering base, optimistic and stress scenarios are essential for a bankable Luxury Hotel Project Report or DPR.
Explore Luxury / 4-Star & 5-Star Hotel Project Report Guides
Explore our complete Luxury, 4-Star and 5-Star Hotel Project Report and DPR guides covering setup cost, equipment, project cost, revenue, financial projections, occupancy, feasibility, project finance and bank loan assessment.
Introduction: Why Occupancy, ARR, RevPAR & Break-Even Drive Luxury Hotel Viability
A luxury hotel project is among the most capital-intensive investments in the hospitality industry. Having prepared and reviewed financial projections for several 4-star and 5-star hotel projects across India, I have consistently found that the single most frequent cause of weak DPRs is the mishandling of four interconnected assumptions: occupancy, ARR, RevPAR and break-even occupancy.
A hotel’s financial health cannot be judged by room count or proposed tariff alone. Every projection in a bankable project report flows from a logical chain: Available Rooms → Occupancy → Rooms Sold → Average Room Rate (ARR / ADR) → Room Revenue → RevPAR → Gross Operating Profit → Break-Even → Debt-Servicing Capacity. If any link in this chain is unrealistic, the entire feasibility analysis falls apart.
Luxury hotel occupancy is influenced by macroeconomic factors and affluent consumer behavior, making it inherently more volatile than many promoters assume. This article explains how to estimate, calculate and analyse these metrics from a project feasibility, DPR and bank-finance perspective – with Indian market context, worked examples and practical guidance for entrepreneurs, hotel promoters, investors, CAs and project-finance professionals.
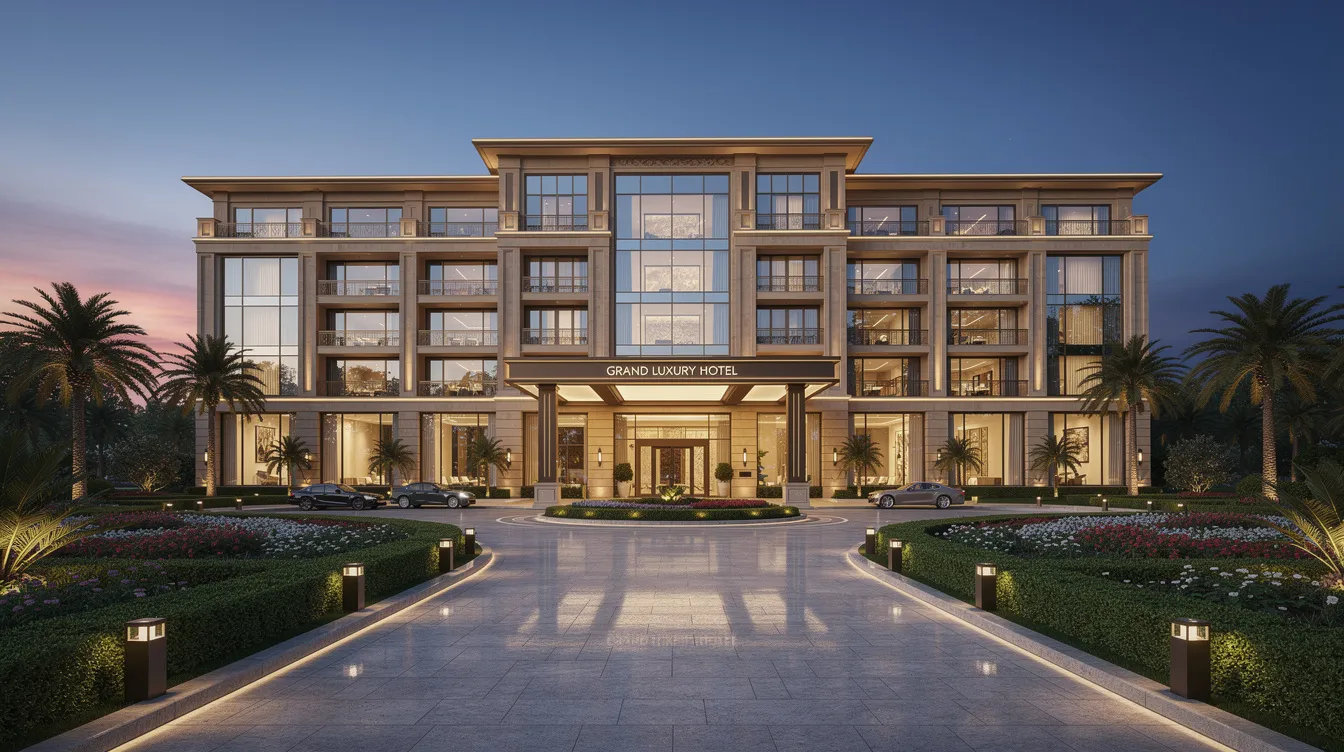
Understanding Luxury Hotel Occupancy Rate
Room occupancy is the starting point of every luxury hotel financial analysis. It measures the percentage of available rooms actually sold over a given period and is, at its core, a measure of demand utilisation.
The formula is straightforward:
Occupancy Rate (%) = (Rooms Sold ÷ Rooms Available) × 100
The occupancy rate is calculated by dividing occupied rooms by available rooms. For a simple illustration, a 10-room hotel with 5 sold rooms has a 50% occupancy rate.
Key concepts that affect this calculation:
- Available room nights – Total rooms in operation multiplied by days in the period. Rooms under renovation or out of order are excluded.
- Rooms sold – Actual revenue-generating room nights. Complimentary rooms provided to VIPs, promoters or travel agents are generally excluded from this count.
- Seasonal occupancy – Luxury hotel occupancy can vary greatly across regions and seasons. Tourist destinations like Goa, Udaipur and Jaipur see stronger occupancy during October–March, while business hotels in metros typically have higher weekday occupancy and softer weekends.
- Peak vs off-peak – Luxury hotels typically maintain occupancy rates above 70% to 85% during peak seasons, but annual averages are substantially lower. Occupancy rates help identify peak demand periods, which feed directly into revenue management and pricing strategy.
Corporate travel impacts luxury hotel occupancy significantly through leadership retreats, incentive trips and MICE events. Luxury hotels also benefit from rising domestic travel and event demand, including weddings and exhibitions.
Occupancy rates for luxury hotels in India are estimated between 70% and 72% for FY25, according to ICRA’s sector analysis. However, lenders focus not just on annual averages but also on seasonality and weekday-versus-weekend splits.
Example: A 120-room 5-star hotel in Mumbai with 70% annual occupancy sells approximately 30,660 room nights per year (120 × 365 × 0.70), reflecting strong and consistent demand – something a project report must evidence with local data, not just assume.
How to Calculate Available Room Nights (100-Room Luxury Hotel Example)
Available room nights form the foundation of all occupancy, ARR, RevPAR and room revenue projections in a DPR. Only rooms ready for rent count as available rooms in occupancy calculations.
For a 100-room luxury hotel: 100 rooms × 365 days = 36,500 available room nights per year, assuming all rooms are operational. If a floor is planned for renovation for, say, 25 days covering 20 rooms, available nights reduce by 500 (20 × 25), yielding approximately 36,000 available room nights.
Using 36,500 as the base, here is how different occupancy levels translate into rooms sold:
| Occupancy (%) | Rooms Sold (Room Nights) |
|---|---|
| 40% | 14,600 |
| 50% | 18,250 |
| 60% | 21,900 |
| 65% | 23,725 |
| 70% | 25,550 |
| 75% | 27,375 |
These room nights sold will be multiplied by ARR to compute projected room revenue – the single largest revenue line in any luxury hotel DPR.
What Is ARR / ADR in a Luxury Hotel?
Average Room Rate (ARR) and Average Daily Rate (ADR) are used interchangeably in the hotel industry in India to indicate the realised average revenue per sold room.
ARR / ADR = Room Revenue ÷ Rooms Sold
This uses net room revenue – typically before GST but after discounts, commissions and negotiated deals. ARR is always lower than the published rack rate because of corporate discounts, OTA promotions, group rates, wedding packages and seasonal offers. The luxury segment’s average daily rates have increased significantly compared to pre-pandemic levels, but realised ARR still varies widely by location and segment.
Factors influencing ARR in a 5-star hotel include room category mix (standard rooms versus suites), dynamic pricing, lead time of bookings, day of week, events and overall market positioning. Distribution costs are significant: OTAs may support room occupancy but heavy discounting and commissions reduce both ARR and net revenue. After deducting distribution costs, the effective realised rate per sold room can be materially lower than the headline figure. This is why revenue managers at full service hotels and select service hotels alike track net revenue rather than gross tariff.
Illustration: If a 5-star hotel sells 20,000 room nights in a year with ₹20 crore of total room revenue, ARR = ₹10,000. This is illustrative – not a benchmark for all luxury hotels in India.
ARR Assumptions for a Luxury Hotel DPR (India-Focused)
ARR assumptions in a DPR must be location- and segment-specific. Copying national averages or competitor rack rates without adjustment is a common mistake that weakens credibility during bank appraisal.
Key drivers of achievable ARR for a luxury or 5-star project:
- Location type – Gateway city versus leisure destination versus pilgrimage centre
- Connectivity – Air connectivity significantly affects resort occupancy in destinations like the Maldives and Goa; similarly, proximity to airports, highways and railway stations matters
- Demand generators – IT parks, SEZs, convention centres, industrial corridors, tourist attractions
- Chain scale and brand – International brands with loyalty programs generally command premium ARR over standalone properties
- Target segment – Luxury hotels often target high-net-worth individuals who are somewhat insulated from economic downturns, enabling stronger rate resilience
Luxury hotel average room rates are projected between ₹7,800 and ₹8,000 for FY25 at an all-India industry level, but individual properties in prime metro locations regularly achieve ₹12,000–₹25,000+ depending on positioning and brand. Limited supply in prime locations protects luxury hotels from oversaturation and supports rate integrity.
Luxury hotel supply growth lags behind demand growth in several key Indian markets, creating pricing power for existing properties – a factor that should be reflected in ARR growth assumptions.
From a project finance perspective, I generally recommend developing ARR assumptions by segment – corporate, leisure FIT, groups, weddings and MICE, OTAs, and direct bookings – then blending these into a weighted-average ARR. In the DPR, ARR should be shown net of complimentary breakfast cost if breakfast is included but accounted for separately as an F&B expense.
What Is RevPAR and Why It Matters for Luxury Hotel Financial Analysis
RevPAR stands for Revenue Per Available Room. It is the single most important metric linking room occupancy and pricing into one number, providing insight into hotel pricing and occupancy effectiveness.
Two equivalent formulas:
- RevPAR = Total Room Revenue ÷ Available Room Nights
- RevPAR = ADR × Occupancy Rate – both yield the same result if data is consistent
RevPAR can also be calculated as ADR multiplied by occupancy rate – this is the more commonly used formula in DPRs.
Example: For a 100-room luxury hotel with 36,500 available room nights, 65% occupancy and ARR of ₹10,000:
- Rooms sold = 23,725
- Annual room revenue = ₹23.73 crore
- RevPAR = ₹10,000 × 0.65 = ₹6,500
High RevPAR indicates effective revenue optimisation and strong guest demand. Luxury hotels increasingly prioritize revenue per available room over simply maximizing occupancy rates, because chasing occupancy through deep discounting can erode both ARR and profitability.
Globally, RevPAR growth has slowed: between 2018 and 2023, RevPAR growth fell to 1.5% from 3.0% recorded in the 2013–2018 period. Luxury hotels themselves saw a 1.6% RevPAR growth from 2018 to 2023, while luxury hotel room growth accelerated to 2.4% over the same period – meaning new supply outpaced RevPAR gains. Only 26% of brands generated RevPAR growth above inflation from 2013 to 2023, underscoring how important it is to get assumptions right.
A good RevPAR benchmark for luxury hotels in major global cities is above $300, though Indian luxury properties operate in a different rate band. In India’s key markets, HVS-ANAROCK data for Q1 CY2026 shows luxury/premium RevPAR at approximately ₹6,700–₹7,038 – a useful reference for DPR calibration.
Occupancy vs ARR vs RevPAR: Comparative View for DPRs
High occupancy does not always correlate with higher profits. A hotel filling rooms at a lower price point through aggressive discounting may achieve impressive occupancy numbers but generate less room revenue than a competitor with moderate occupancy at a stronger rate.
| Metric | Formula | What It Measures | DPR Importance | Limitation |
|---|---|---|---|---|
| Occupancy | Rooms Sold ÷ Available Rooms | Room utilisation | Demand validation | Ignores rate quality |
| ARR / ADR | Room Revenue ÷ Rooms Sold | Realised pricing | Revenue quality | Ignores unsold inventory |
| RevPAR | ARR × Occupancy | Combined performance | Revenue generation per available room | Ignores operational costs |
Case A: 80% occupancy at ₹7,500 ARR → RevPAR = ₹6,000 Case B: 60% occupancy at ₹10,000 ARR → RevPAR = ₹6,000
Both cases produce the same RevPAR, but Case B likely generates higher gross operating profit because fewer rooms occupied means lower variable costs while room revenue remains identical. This distinction matters significantly for hotel profitability analysis.
For a complete picture, RevPAR must be read together with cost per occupied room (CPOR), operational expenses and EBITDA margins.
Luxury Hotel Occupancy Ramp-Up: Year-Wise Assumptions
New luxury hotels rarely achieve stabilised occupancy in the first year. Brand awareness, distribution strategy, online reputation and guest reviews all take time to build. Hotel operators need a credible ramp-up plan to demonstrate to lenders that projections are grounded in reality.
Illustrative ramp-up for a 100-room 5-star hotel (example assumptions only):
| Year | Occupancy (%) | Rooms Sold |
|---|---|---|
| Year 1 | 45% | 16,425 |
| Year 2 | 52% | 18,980 |
| Year 3 | 58% | 21,170 |
| Year 4 | 63% | 22,995 |
| Year 5 | 67% | 24,455 |
Factors justifying faster ramp-up include a strong brand with an existing loyalty base, robust pre-opening sales activity, anchor demand generators such as IT parks or convention centres, and limited competing supply. Slower ramp-up should be assumed for standalone properties in Tier-2 or Tier-3 cities without established demand patterns.
In my experience, term-lending banks in India generally prefer conservative early-year occupancy assumptions. Projections showing 70%+ occupancy in Year 1 without strong anchor demand evidence are frequently challenged during credit committee discussions.

ARR Growth Assumptions and Pricing Strategy Over Five Years
Improving occupancy and increasing ARR are distinct drivers of revenue growth. Both cannot be pushed to unrealistic levels simultaneously in a bankable DPR.
Illustrative ARR trajectory for the same 100-room luxury hotel:
| Year | ARR (₹) | Growth Driver |
|---|---|---|
| Year 1 | 8,500 | Opening rates, introductory positioning |
| Year 2 | 9,000 | Market acceptance, improved mix |
| Year 3 | 9,500 | Stronger brand, better segment blend |
| Year 4 | 10,000 | Dynamic pricing, matured operations |
| Year 5 | 10,500 | Inflation + positioning improvement |
Components of ARR growth include inflationary increase (approximately 4–5% per annum), improvement in hotel positioning as guest reviews and brand recognition build, better revenue management through dynamic pricing tools, and a shift towards higher-paying market segments.
Sudden large ARR jumps of 20–25% per annum should be avoided in projections unless supported by strong evidence – such as significant demand-supply imbalances or a major infrastructure development (new airport, convention centre) coming online.
Five-Year Occupancy, ARR & RevPAR Illustration (100-Room Luxury Hotel)
This consolidated 5-year model integrates occupancy ramp-up and ARR growth into room revenue projections. All figures are illustrative assumptions.
| Year | Rooms | Available Room Nights | Occupancy (%) | Rooms Sold | ARR (₹) | Room Revenue (₹ Crore) | RevPAR (₹) |
|---|---|---|---|---|---|---|---|
| 1 | 100 | 36,500 | 45% | 16,425 | 8,500 | 13.96 | 3,825 |
| 2 | 100 | 36,500 | 52% | 18,980 | 9,000 | 17.08 | 4,680 |
| 3 | 100 | 36,500 | 58% | 21,170 | 9,500 | 20.11 | 5,510 |
| 4 | 100 | 36,500 | 63% | 22,995 | 10,000 | 23.00 | 6,300 |
| 5 | 100 | 36,500 | 67% | 24,455 | 10,500 | 25.68 | 7,035 |
Verification: Year 5 RevPAR = ₹10,500 × 0.67 = ₹7,035; Room Revenue = 24,455 × ₹10,500 = ₹25.68 crore.
This illustration helps entrepreneurs and consultants validate whether projected revenues used in the project report, CMA data and DSCR calculations are realistic. Note that this covers only room revenue; for total revenue and gross operating profit, F&B, banquets and other income must be incorporated separately.
Relationship Between Occupancy and Total Hotel Revenue Streams
Higher room occupancy in a luxury hotel increases not just room revenue but also ancillary revenue streams. When more rooms are occupied, restaurants see higher covers, in room services and minibar consumption increase, spa services generate more bookings, laundry volumes rise, and guest-transport services are used more frequently. The average length of stay and average spend per occupied room together influence how much revenue each guest contributes beyond the room rate.
The shift towards experiential and wellness tourism is driving additional revenue opportunities for luxury hotels that invest in curated guest experiences.
However, banquet and event revenue – particularly weddings and conferences – may have independent demand trends and can remain strong even when room occupancy is moderate, especially in Tier-2 Indian cities with strong social-event markets.
For a detailed breakdown of how different departments contribute to total income, refer to the Luxury Hotel Revenue Model – Rooms, F&B, Banquet & Other Income. In a full DPR, total revenue projections combine room revenue with these additional revenue streams, which then feed into gross operating profit and break-even analysis.
Scenario Analysis – Occupancy vs ARR Sensitivity
For bankable luxury hotel financial projections, testing how changes in occupancy and ARR impact room revenue and RevPAR is essential. Major global events can create significant spikes in luxury hotel demand, while geopolitical conditions can dramatically impact luxury hotel occupancy rates in the opposite direction.
Sensitivity Table – RevPAR and Annual Room Revenue (100-Room Hotel, 36,500 Available Room Nights)
| ARR ₹8,000 | ARR ₹10,000 | ARR ₹12,000 | |
|---|---|---|---|
| 50% Occupancy | RevPAR ₹4,000 / ₹14.60 Cr | RevPAR ₹5,000 / ₹18.25 Cr | RevPAR ₹6,000 / ₹21.90 Cr |
| 60% Occupancy | RevPAR ₹4,800 / ₹17.52 Cr | RevPAR ₹6,000 / ₹21.90 Cr | RevPAR ₹7,200 / ₹26.28 Cr |
| 70% Occupancy | RevPAR ₹5,600 / ₹20.44 Cr | RevPAR ₹7,000 / ₹25.55 Cr | RevPAR ₹8,400 / ₹30.66 Cr |
A drop from 65% to 55% occupancy at ₹10,000 ARR reduces annual room revenue by approximately ₹3.65 crore – enough to significantly impact gross operating profit and DSCR. Such sensitivity analysis should be part of every luxury hotel project report. Revenue managers and CAs preparing CMA data should include at least base, optimistic and stress cases.

What Is Break-Even Analysis for a Luxury Hotel?
Break-even analysis determines the occupancy and revenue required for a hotel to cover its operating costs and, eventually, meet overall project obligations including interest and principal repayment. It helps identify the break even point below which the hotel generates losses.
Three important variants:
- Operating break-even – EBITDA turns positive; hotel covers operational expenses from its own revenue generated
- Accounting break-even – Net profit is nil after all expenses including interest and depreciation
- Cash break-even – Cash accrual is sufficient to cover interest plus scheduled principal repayment
Fixed or semi-fixed costs in a luxury hotel include base staff salaries, administration, marketing overheads, property taxes, insurance, fixed portion of utilities, management fees, minimum maintenance and security costs. Labor costs are a particularly large component for 5-star hotels given the high staff-to-room ratios required.
Variable costs rise with rooms occupied and guest volumes: laundry and linen, guest amenities, variable utilities, F&B raw materials for complimentary breakfast or in-room dining, OTA commissions and distribution costs linked to room sales.
How to Calculate Break-Even Occupancy in a Luxury Hotel
The simplified framework for break-even occupancy calculation focuses on the rooms department. A full hotel model would incorporate all departments.
Step-wise logic:
- Revenue per occupied room = ARR
- Variable cost per occupied room = Guest consumables + cleaning + variable utilities + OTA/distribution costs + other room-specific variable expenses
- Contribution per occupied room = ARR – Variable cost per occupied room
- Break-even room nights = Total annual fixed operating costs ÷ Contribution per occupied room
- Break-even occupancy (%) = Break-even room nights ÷ Available room nights × 100
In Indian bank appraisals, consultants often compute both room-department break-even occupancy and overall hotel break-even occupancy, factoring in contributions from F&B and banquet revenue toward covering undistributed expenses and fixed costs.
Break-Even Occupancy Example with Numbers
All figures below are illustrative assumptions for a 100-room luxury hotel.
| Component | Value |
|---|---|
| Available room nights | 36,500 |
| ARR (assumed) | ₹9,500 |
| Variable cost per occupied room | ₹2,500 |
| Contribution per occupied room | ₹7,000 |
| Annual fixed operating costs (rooms + undistributed) | ₹10.00 crore |
| Break-even room nights | 14,286 (₹10 Cr ÷ ₹7,000) |
| Break-even occupancy | 39.1% (14,286 ÷ 36,500) |
If projected stabilised occupancy after ramp-up is 65–68%, the gap between 39% break-even and 65%+ expected occupancy provides a meaningful comfort margin for both promoters and lenders.
In full DPRs, additional revenue from F&B, banquets and other services typically contributes positive gross operating profit, which can further reduce the effective break-even occupancy for the hotel as a whole.
Break-Even Occupancy vs Project Break-Even & Debt Obligations
Reaching operating break-even does not automatically mean the luxury hotel project can service its debt comfortably. The financial chain runs deeper:
Room and other revenues → Departmental profit → Gross Operating Profit (GOP) → EBITDA → Less interest → Less depreciation → Profit Before Tax → Tax → Net Profit → Cash accrual
Project break-even for lenders is more closely related to whether cash accrual covers debt servicing (interest + principal), typically measured through DSCR.
A luxury hotel may operate above break-even occupancy but still show weak DSCR if project cost is high, ARR is below expectation, or the debt-equity ratio is aggressive. Both operating break-even occupancy and project-level DSCR must be computed to ensure feasibility reports are robust.
Impact of Occupancy on EBITDA and Operating Leverage
Hotels exhibit strong operating leverage. A substantial proportion of costs is fixed or semi-fixed, so once break-even is crossed, incremental occupancy has a disproportionately positive impact on EBITDA.
Illustrative EBITDA sensitivity (ARR constant at ₹10,000, 100 rooms):
| Occupancy | Room Revenue (₹ Cr) | Estimated EBITDA (₹ Cr)* |
|---|---|---|
| 40% | 14.60 | (–) 1.50 |
| 50% | 18.25 | 1.50 |
| 60% | 21.90 | 5.00 |
| 70% | 25.55 | 8.50 |
| 80% | 29.20 | 11.80 |
Indicative; includes assumed F&B and other departmental revenues at conservative ratios, minus total operating expenses.
Moving from 50% to 60% occupancy can improve EBITDA margin far more than the percentage increase in occupancy suggests, because fixed costs are spread over a larger revenue base. However, very high occupancy achieved at heavily discounted rates may still not be optimal if it dilutes ARR and strains service standards. In project reports, EBITDA projections should be cross-checked by calculating CPOR and comparing it against industry norms for 5-star hotels.
Impact on DSCR and Loan Repayment Capacity
DSCR (Debt Service Coverage Ratio) measures whether the hotel’s cash accrual is sufficient to service its debt obligations:
DSCR = Cash Accrual Available for Debt Service ÷ Total Debt Service (Interest + Principal)
Higher occupancy and ARR increase room revenue and total hotel income, improving EBITDA, cash accrual and ultimately DSCR. Indian lenders often look for average DSCR of at least 1.5–1.7 over the loan period for hotel projects, though exact thresholds vary by institution and risk perception.
Promoters should prepare alternative DSCR runs under base, optimistic and stress scenarios to understand how sensitive their loan-repayment ability is to changes in luxury hotel occupancy rate and ARR. DSCR analysis must align with the sanctioned repayment schedule, interest rate assumptions and overall project cost – topics covered in detail under Luxury Hotel Project Cost & Means of Finance.
Occupancy Sensitivity Analysis for Bank Finance (Base, Optimistic, Stress)
Scenario planning strengthens any luxury hotel project report. Three cases are standard:
| Scenario | Occupancy (Yr 5) | ARR (Yr 5, ₹) | Room Rev (₹ Cr) | EBITDA Approx (₹ Cr) | DSCR Indicative |
|---|---|---|---|---|---|
| Stress | 55% | 9,500 | 19.07 | 3.50 | ~1.10 |
| Base | 67% | 10,500 | 25.68 | 8.00 | ~1.75 |
| Optimistic | 72% | 11,000 | 28.91 | 10.50 | ~2.10 |
The stress case uses approximately 12 percentage points lower occupancy and ₹1,000 lower ARR than the base case. When projections show acceptable DSCR even under moderate stress, lenders are more confident in sanctioning term loans. In my experience, this kind of analysis materially improves approval timelines for hotel projects.
Common Mistakes in Luxury Hotel Occupancy & ARR Projections
Frequent errors observed in Indian hotel DPRs include:
- Assuming 70–80% occupancy from Year 1 without ramp-up or demand evidence
- Using published rack rate instead of realistic net ARR after discounts and OTA commissions
- Ignoring weekday-weekend and seasonal variations in occupancy
- Misinterpreting national or chain-level averages as applicable to all cities – broader trends at the industry level may not reflect local micro-markets
- Overlooking competition from new supply, unbranded hotels, guest houses, homestays and third party channels
- Confusing ARR with RevPAR
- Treating complimentary breakfast cost as “free” rather than accounting for it as a variable expense
- Projecting aggressive ARR escalation without evidence-based justification
- Failing to calculate break-even occupancy or perform sensitivity analysis
Unrealistic projections may look attractive on paper but undermine the credibility of the project report during bank appraisal and internal credit committee discussions. Corrective actions include structured market study, conservative assumptions, explicit ramp-up scheduling and clear documentation of the basis for each assumption.
How Banks Evaluate Luxury Hotel Occupancy & Revenue Assumptions
Banks evaluate hotel projects differently from generic commercial ventures because of the high fixed costs and cyclical demand patterns inherent in the hospitality industry.
Key aspects examined during appraisal:
- Project location, visibility and proximity to demand generators
- Existing and upcoming competing hotels by chain scale
- Historical occupancy and ARR data where available
- Brand tie-up or management contract quality
- Promoter experience in hospitality businesses
- Whether market-study reports support the proposed luxury hotel occupancy rate and ARR
- Projected P&L, break-even occupancy, DSCR and stress-test scenarios
A well-prepared, data-backed DPR and CMA data prepared or reviewed by a Chartered Accountant can significantly improve the chances of timely loan approval. Industry leaders in project lending increasingly expect structured sensitivity analysis as standard.
Connection Between Occupancy, Project Cost & Means of Finance
Higher project cost – land, civil works, high-end interiors, FF&E, pre-opening expenses – leads to higher term debt, which demands stronger and more stable occupancy and ARR to generate sufficient cash accrual.
The capital structure (debt-equity ratio), interest rate, repayment tenor and moratorium period must be aligned with realistic expectations of ramp-up. When project cost is high relative to expected RevPAR, promoters may need to bring in higher equity or consider phased development to keep DSCR at acceptable levels.
For a detailed discussion of cost heads, funding patterns and their interaction with projected cash flows, refer to the Luxury Hotel Project Cost & Means of Finance. Occupancy and ARR assumptions cannot be finalised in isolation – they must be consistent with project-investment size and target segment.
Impact of FF&E Investment and Positioning on ARR & Occupancy
ARR and sustainable occupancy levels depend heavily on perceived value. Room quality, public areas, F&B outlets, spa services, banquets and the overall guest experience collectively determine how much revenue a property can command. Business travelers and leisure guests alike evaluate these attributes against the room rate.
Typical FF&E and OS&E components include premium guest-room furniture and fixtures, high-quality bedding and bathroom fittings, commercial kitchen and laundry equipment, banquet infrastructure, and POS/PMS technology systems. Under-investment constrains achievable ARR and brand affiliation; over-investment without corresponding demand depresses returns.
Promoters should review the Luxury Hotel Equipment, Furniture & FF&E List with Cost to understand how quality and specification levels interact with positioning and expected room rate.
In financial projections, depreciation on FF&E assets affects profitability and DSCR, so asset-quality decisions must be consistent with expected hotel’s RevPAR and gross operating profit.
Integrated Hotel Financial Projection Flow: From Rooms to Debt Servicing
A typical luxury hotel DPR connects operational assumptions to final project-viability metrics through this flow:
Rooms → Available Room Nights → Occupancy → Rooms Sold → ARR → Room Revenue → F&B and Banquet Revenue → Other Income → Total Revenue → Operating Expenses → Gross Operating Profit → EBITDA → Interest → Cash Accrual → Term-Loan Repayment → DSCR
Starting with the 5-year occupancy/ARR/RevPAR table, apply assumed departmental revenue ratios (F&B typically 25–35% of total revenue for luxury hotels; banquets 15–25%) to derive total revenue. From there, apply cost ratios to compute gross operating profit and EBITDA.
All ratios and assumptions should be supported by comparable-property data or sensible benchmarks for the luxury chain scale and location. Integrated projection models can be built in spreadsheets where changing occupancy or ARR automatically updates RevPAR, gross operating profit, EBITDA and DSCR, enabling quick sensitivity testing.
I encourage promoters to work with experienced financial consultants or CAs so that the integrated model used for the Project Report, CMA Data and bank submissions is internally consistent and defendable.
Conservative vs Aggressive Projections in Luxury Hotel DPRs
Lenders consistently prefer reasonable, supportable projections over optimistic best-case numbers. Over-projecting occupancy at 75–80% consistently, or assuming ARR surpassing established competitors without brand strength or unique attributes, generates suspicion rather than confidence.
Aggressive projections may produce high gross operating profit and DSCR on paper but can become unachievable in actual operations, leading to stress in term-loan servicing. For bank-finance purposes, base the DPR on conservative base cases with upside documented separately. Ensure ramp-up, ARR and expense assumptions are cross-checked against local market realities and demand trends.
In my experience, conservative yet well-substantiated projections build trust with bankers and investors and support smoother project execution. Revenue potential should be presented honestly, not inflated.
Practical Checklist for Occupancy, ARR & RevPAR Assumptions
Before finalising luxury hotel occupancy and ARR assumptions in a DPR or CMA projection, confirm:
- Proposed number of rooms and room-type mix (standard, deluxe, suite)
- Comparable hotels and their observed ARR, occupancy and RevPAR
- Local tourism and business-travel statistics from state tourism departments
- Distance from airport, railway station and major highways
- Major demand generators – corporate hubs, IT parks, convention centres, tourist attractions
- Demand segments to analyse: corporate, leisure, MICE, weddings, airline crew, government/PSU
- Expected average length of stay and rate tolerance per segment
- Proposed brand or management operator
- Marketing and distribution strategy – expected share of direct bookings versus OTAs
- Planned pre-opening sales and soft-opening promotions
- A documented basis for each assumption (competitor analysis, tourism data, feasibility study) for confident explanation during bank appraisal
Key Takeaways and Conclusion
Luxury hotel viability in India depends on the correct interplay of available room nights, realistic occupancy ramp-up, achievable ARR, sustainable RevPAR and carefully evaluated break-even occupancy. RevPAR and break-even analysis are central for lenders because they directly influence gross operating profit, EBITDA, DSCR and debt-servicing capacity.
Robust DPRs combine quantitative rigour – accurate calculations, internally consistent projections and sensitivity analysis – with qualitative judgement on location, brand, positioning and FF&E quality. Occupancy, ARR, RevPAR and break-even are not mere formulas. They are key performance indicators and strategic levers shaping long-term hotel’s profitability and sustained growth.
Careful financial planning at the DPR stage, supported by informed decisions on every assumption, can prevent avoidable distress later and help build luxury hotel assets that generate profit while remaining financially sound. The goal is not to create the most optimistic project report, but the most defensible one.
FAQ – Luxury Hotel Occupancy, ARR, RevPAR & Break-Even
Is there a standard “good” occupancy rate for a luxury or 5-star hotel in India?
There is no universal benchmark. Performance depends on city, location within the city, seasonality, chain scale, brand strength and property maturity. Many successful luxury and 5-star hotels stabilise in the 60–70% occupancy band with healthy ARR and RevPAR. Some resort destinations may be operationally viable even at lower annual occupancy if ARR is strong during peak months. Each DPR must rely on local data rather than generic rules. According to GlobalData, luxury hotels in India achieved approximately 67.4% average occupancy in 2023.
Can a luxury hotel have high occupancy but still be financially stressed?
Yes. If high occupancy is driven by deep discounting, heavy OTA dependence or excessive complimentary room usage, ARR and net RevPAR may be weak, leading to poor gross operating profit and low DSCR. Financial stress can also arise when project cost and debt servicing are high relative to achievable RevPAR, even if occupancy appears strong. High occupancy does not always correlate with higher profits – hotel owners must balance room sales volume with rate quality and operational efficiency.
How should I estimate ARR for a new luxury hotel where there is limited existing data?
Survey comparable hotels in nearby cities, study online rates across different days and seasons, speak to corporate travel managers and travel agents, and consider guidance from prospective brand operators. Use conservative mid-range values rather than the highest rates observed, then apply a reasonable ramp-up. For India-wide context, luxury hotel average room rates are projected between ₹7,800 and ₹8,000 for FY25, but location-specific ARR can differ substantially.
How frequently should occupancy, ARR and RevPAR assumptions be revisited after opening?
Promoters and finance teams should review actual performance against projections at least quarterly during the first 2–3 years, and annually thereafter. Rolling financial projections and CMA data should be updated based on actual occupancy and ARR trends so that banks and investors maintain a transparent, comprehensive view of project performance and sustainable growth potential.
Do banks in India insist on a particular RevPAR or break-even occupancy level before sanctioning hotel loans?
Banks generally do not prescribe a single RevPAR or occupancy threshold. Instead, they examine whether projected cash flows at assumed occupancy and ARR are sufficient to service proposed debt with adequate DSCR under both base and stress scenarios. Well-structured projections, realistic occupancy ramp-up, defensible ARR and clear break-even analysis are far more important than meeting any arbitrary occupancy number. A hotel that can demonstrate operational efficiency and revenue resilience under moderate downside conditions stands a stronger chance of securing financing.
Explore More Luxury / 4-Star & 5-Star Hotel Project Report Guides
Continue exploring our Luxury, 4-Star and 5-Star Hotel DPR guides covering setup cost, equipment, project cost, revenue, financial projections, occupancy, feasibility, project finance and bank loan assessment.